How to Generate and Ingest Terraform Logs for Observability and Analysis


Try OpenObserve Cloud today for more efficient and performant observability.

IaC monitoring and observability play critical roles in managing and troubleshooting complex deployments. When using infrastructure-as-code tools like Terraform, maintaining visibility into deployment logs is essential for pinpointing issues quickly. This blog provides a step-by-step guide to configuring Terraform to generate logs, setting up Fluent Bit to ingest these logs, and then sending them to your preferred observability platform.
Capturing Terraform logs is crucial for various operational and compliance needs, including:
http://localhost:5080). Terraform doesn’t create log files by default, so let’s start by configuring it to log information during executions.
Set the Environment Variable for Logging: To enable logging, add the following environment variable to your shell profile (e.g., .bashrc, .zshrc):
export TF_LOG=DEBUG
export TF_LOG_PATH="./tf.log"
Adjust the log path as needed. Setting TF_LOG=DEBUG captures detailed information, making it easier to troubleshoot issues.
Test Log Generation: Run a Terraform command to verify logs are generated in the specified file path:
terraform apply
Confirm that tf.log captures all activity. This log will be read by Fluent Bit for ingestion.
Fluent Bit is a lightweight log processor and forwarder, making it ideal for ingesting Terraform logs into an observability platform. Below is a Fluent Bit configuration tailored to Terraform logs.
Install Fluent Bit: If you haven’t installed Fluent Bit yet, you can do so with:
brew install fluent-bit
Create the Fluent Bit Configuration File: Save the following configuration in a file (e.g., fluent-bit.conf):
[INPUT]
    Name            tail
    Path           ./tf.log
    Tag             terraform
    Mem_Buf_Limit   5MB
    Skip_Long_Lines On
    Read_from_Head  On

[FILTER]
    Name            record_modifier
    Match           terraform
    Record          level DEBUG

[FILTER]
    Name            record_modifier
    Match           terraform
    Record          log_source terraform

[OUTPUT]
    Name            http
    Match           *
    URI             /api/default/terraform/_json
    Host            localhost
    Port            5080
    tls             Off
    Format          json
    Json_date_key   _timestamp
    Json_date_format iso8601
    HTTP_User       <openobserve_user>
    HTTP_Passwd     <openobserve_basic_password>
    compress        gzip
Configuration Explanation:
Path specifies the location of tf.log. Tag identifies log entries related to Terraform. Read_from_Head ensures Fluent Bit starts reading from the beginning of the file.record_modifier adds fields, such as level and log_source, which help to categorize the log data.URI is the destination path on the observability platform. HTTP_User and HTTP_Passwd handle authentication. Format ensures the logs are structured in JSON.Run Fluent Bit using the configuration file you just created to start forwarding Terraform logs to your observability platform.
fluent-bit -c /path/to/fluent-bit.conf
This command starts Fluent Bit with the specified configuration. You should see Terraform logs from tf.log being ingested in real-time. Logs are now forwarded, allowing you to analyze and search through them easily.

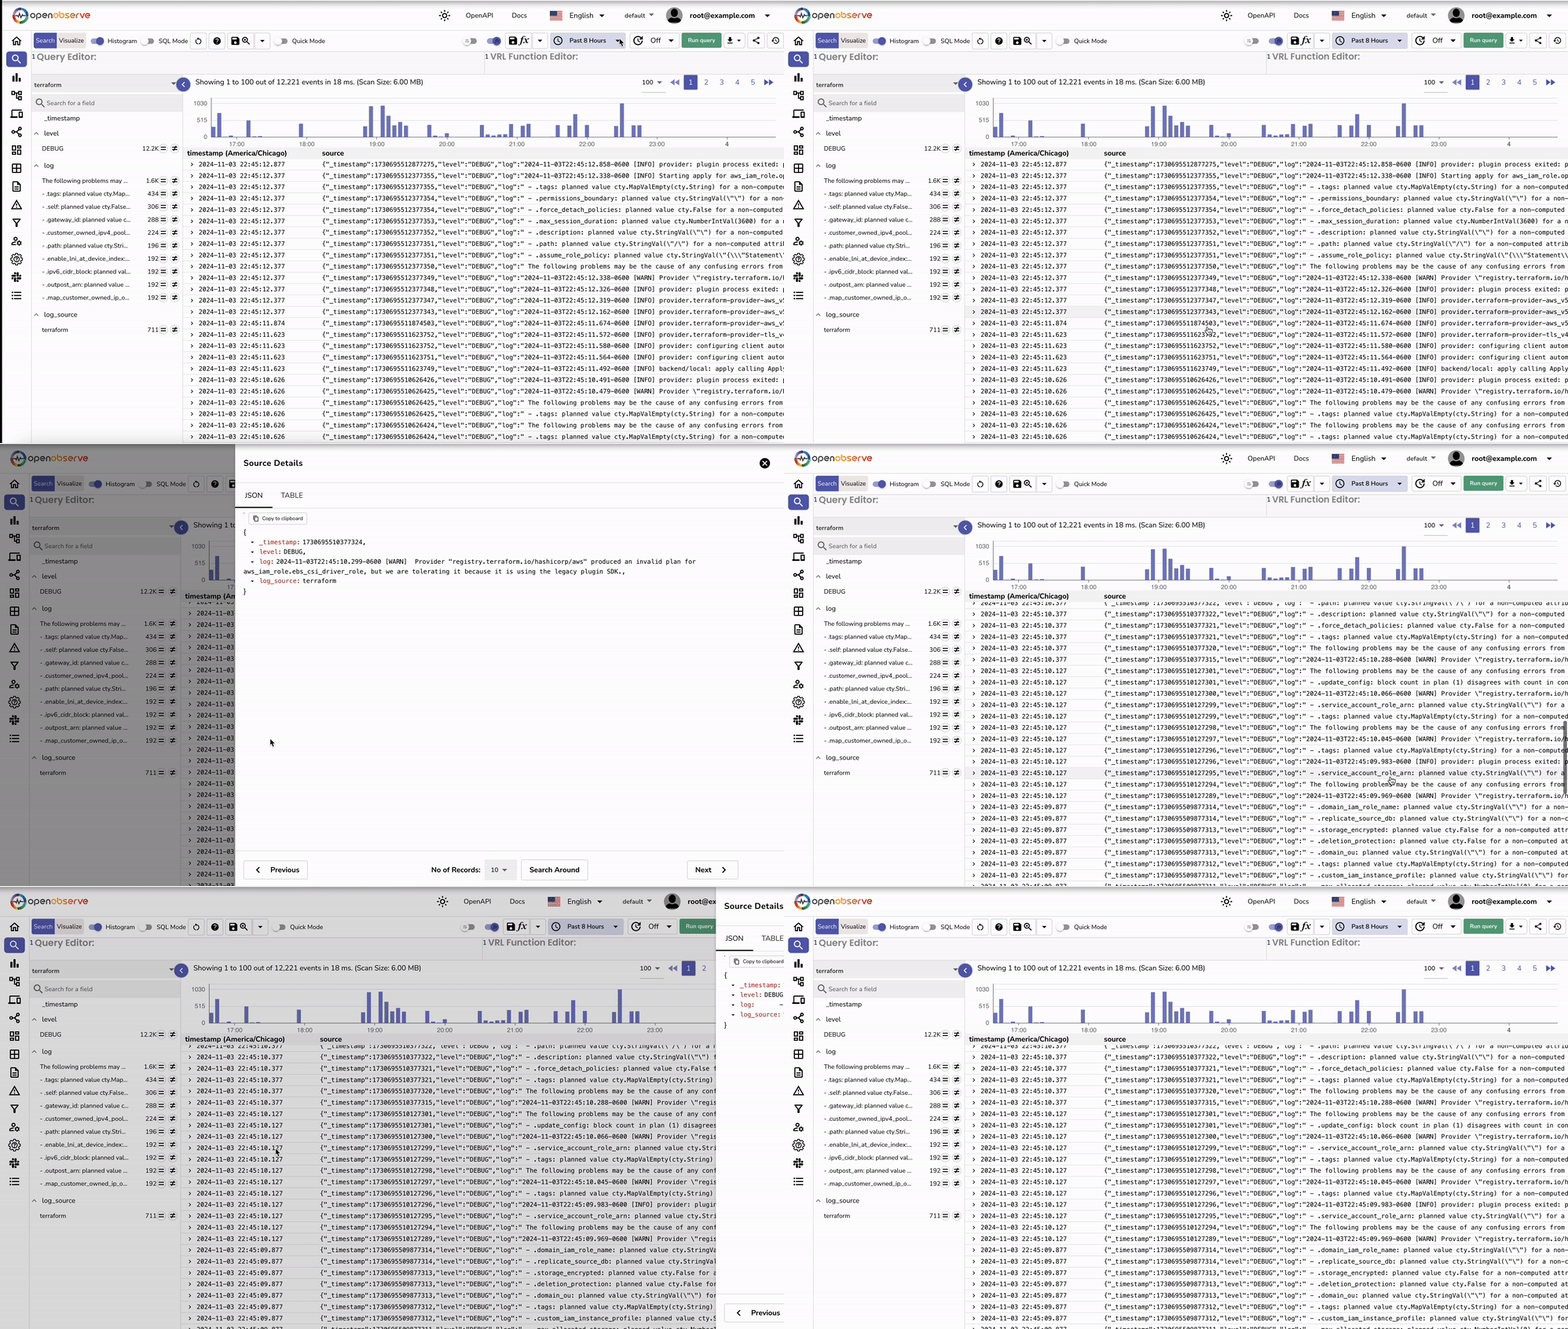
After setting up Fluent Bit to forward Terraform logs, you can validate the ingestion within OpenObserve to ensure the logs are being received and processed correctly.
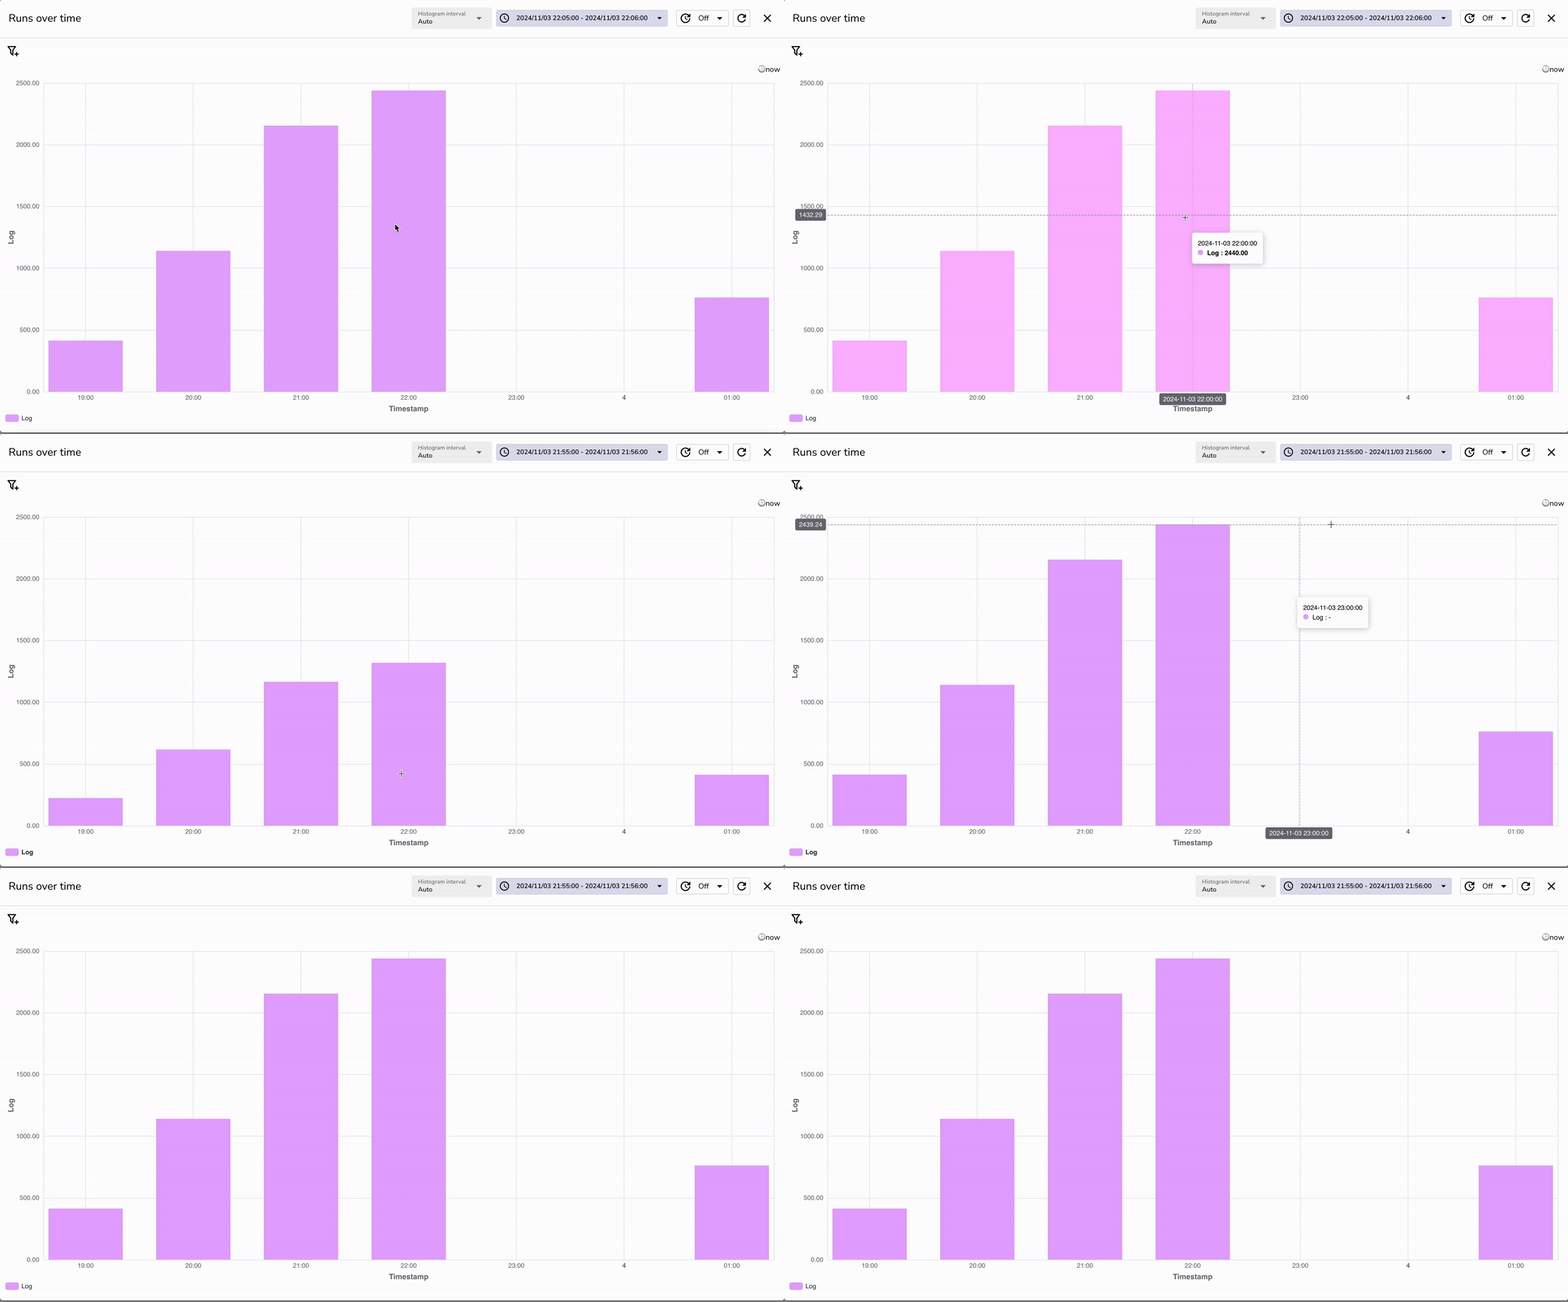
http://localhost:5080 or the domain/IP address where OpenObserve is hosted. terraform. Run Query._timestamp, log_source, and level to organize and verify the ingested data.log_source: terraform and level: DEBUG as set by the record_modifier filter in the Fluent Bit configuration. These fields help identify the source and type of logs in OpenObserve. Now that Terraform logs are ingested, here are some ways to gain insights:

DEBUG level logs will capture Terraform warnings and errors, making it easier to troubleshoot. tf.log from becoming unmanageable. DEBUG is useful for detailed insights, it can generate large volumes of logs. Set log levels to INFO or ERROR in production to reduce noise. This setup can also be extended to your CI/CD pipelines, allowing Terraform logs generated during automated deployments to be routed directly to OpenObserve. By adding Fluent Bit to your CI/CD pipeline configuration, you can capture Infrastructure-as-Code (IaC) logs during each deployment run. This provides centralized, real-time visibility into every change and deployment action, making it easier to monitor, troubleshoot, and maintain your infrastructure, all within OpenObserve.
By integrating Terraform logs into an observability platform with Fluent Bit, you can streamline troubleshooting and enhance your monitoring capabilities. This setup provides continuous insight into your infrastructure provisioning, allowing you to identify issues, optimize deployments, and maintain reliable cloud environments. Start today, and transform your approach to infrastructure monitoring!

Chaitanya Sistla is a Principal Solutions Architect with 17X certifications across Cloud, Data, DevOps, and Cybersecurity. Leveraging extensive startup experience and a focus on MLOps, Chaitanya excels at designing scalable, innovative solutions that drive operational excellence and business transformation.