NVIDIA GPU Monitoring with DCGM Exporter and OpenObserve: Complete Setup Guide

Chaitanya Sistla
November 06, 2025
9 min read
Don’t forget to share!
Try OpenObserve Cloud today for more efficient and performant observability.
AI-driven infrastructure landscape is evolving and GPU clusters represent one of the most significant capital investments for organizations. Whether you're running large language models, training deep learning models, or processing massive datasets, your NVIDIA GPUs (H100s, H200s, A100s, or L40S) are the workhorses powering your most critical workloads.
But here's the challenge: how do you know if your GPU infrastructure is performing optimally?
Traditional monitoring approaches fall short when it comes to GPU infrastructure. System metrics like CPU and memory utilization don't tell you if your GPUs are thermal throttling, experiencing memory bottlenecks, or operating at peak efficiency. You need deep visibility into GPU-specific metrics like utilization, temperature, power consumption, memory usage, and PCIe throughput.
This is where NVIDIA's Data Center GPU Manager (DCGM) Exporter combined with OpenObserve creates a powerful, cost-effective monitoring solution that gives you real-time insights into your GPU infrastructure.
Consider this scenario: You're running an 8x NVIDIA H200 cluster. Each H200 costs approximately $30,000-$40,000, meaning your hardware investment alone is around $240,000-$320,000. Operating costs (power, cooling, infrastructure) can easily add another $50,000-$100,000 annually.
Now imagine:
Without proper monitoring, you're flying blind. You might be:
Effective GPU monitoring requires tracking dozens of metrics across multiple dimensions:
Performance Metrics:
Thermal & Power:
Memory:
Interconnect:
Health & Reliability:
NVIDIA's Data Center GPU Manager (DCGM) is a suite of tools for managing and monitoring NVIDIA datacenter GPUs. DCGM Exporter exposes GPU metrics in Prometheus format, making it easy to integrate with modern observability platforms.
You can find more details about DCGM exporter here.
Key capabilities:
Before starting, ensure you have:
First, confirm your GPUs are properly detected by the system:
# Check if GPUs are visible
nvidia-smi

# Expected output: List of GPUs with utilization, temperature, and memory
For NVIDIA H200 or multi-GPU systems with NVSwitch, you'll need the NVIDIA Fabric Manager:
# Install fabric manager (version should match your driver)
sudo apt update
sudo apt install -y nvidia-driver-535 nvidia-fabricmanager-535

# Reboot to load new driver
sudo reboot

# After reboot, start the service
sudo systemctl start nvidia-fabricmanager
sudo systemctl enable nvidia-fabricmanager

# Verify
nvidia-smi  # Should now show all GPUs
Deploy DCGM Exporter as a Docker container. This lightweight container exposes GPU metrics on port 9400:
docker run -d \
  --gpus all \
  --cap-add SYS_ADMIN \
  --network host \
  --name dcgm-exporter \
  --restart unless-stopped \
  nvcr.io/nvidia/k8s/dcgm-exporter:3.3.5-3.4.0-ubuntu22.04
Configuration breakdown:
--gpus all - Grants access to all GPUs on the host--cap-add SYS_ADMIN - Required for DCGM to query GPU metrics--network host - Uses host networking for easier access--restart unless-stopped - Ensures resilience across rebootsVerify DCGM is working:
# Wait 10 seconds for initialization
sleep 10

# Access metrics from inside the container
docker exec dcgm-exporter curl -s http://localhost:9400/metrics | head -30

# You should see output like:
# DCGM_FI_DEV_GPU_UTIL{gpu="0",UUID="GPU-xxxx",...} 45.0
# DCGM_FI_DEV_GPU_TEMP{gpu="0",UUID="GPU-xxxx",...} 42.0
The OpenTelemetry Collector scrapes metrics from DCGM Exporter and forwards them to OpenObserve. Create the configuration:
receivers:
  prometheus:
    config:
      scrape_configs:
        - job_name: 'dcgm-gpu-metrics'
          scrape_interval: 30s
          static_configs:
            - targets: ['localhost:9400']
          metric_relabel_configs:
            # Keep only DCGM metrics
            - source_labels: [__name__]
              regex: 'DCGM_.*'
              action: keep

exporters:
  otlphttp/openobserve:
    endpoint: https://example.openobserve.ai/api/ORG_NAME/
    headers:
      Authorization: "Basic YOUR_O2_TOKEN"

processors:
  batch:
    timeout: 10s
    send_batch_size: 1024

service:
  pipelines:
    metrics:
      receivers: [prometheus]
      processors: [batch]
      exporters: [otlphttp/openobserve]
Get your OpenObserve credentials:
# For Ingestion token authentication (recommended):
Go to OpenObserve UI → Datasources -> Custom -> Otel Collector
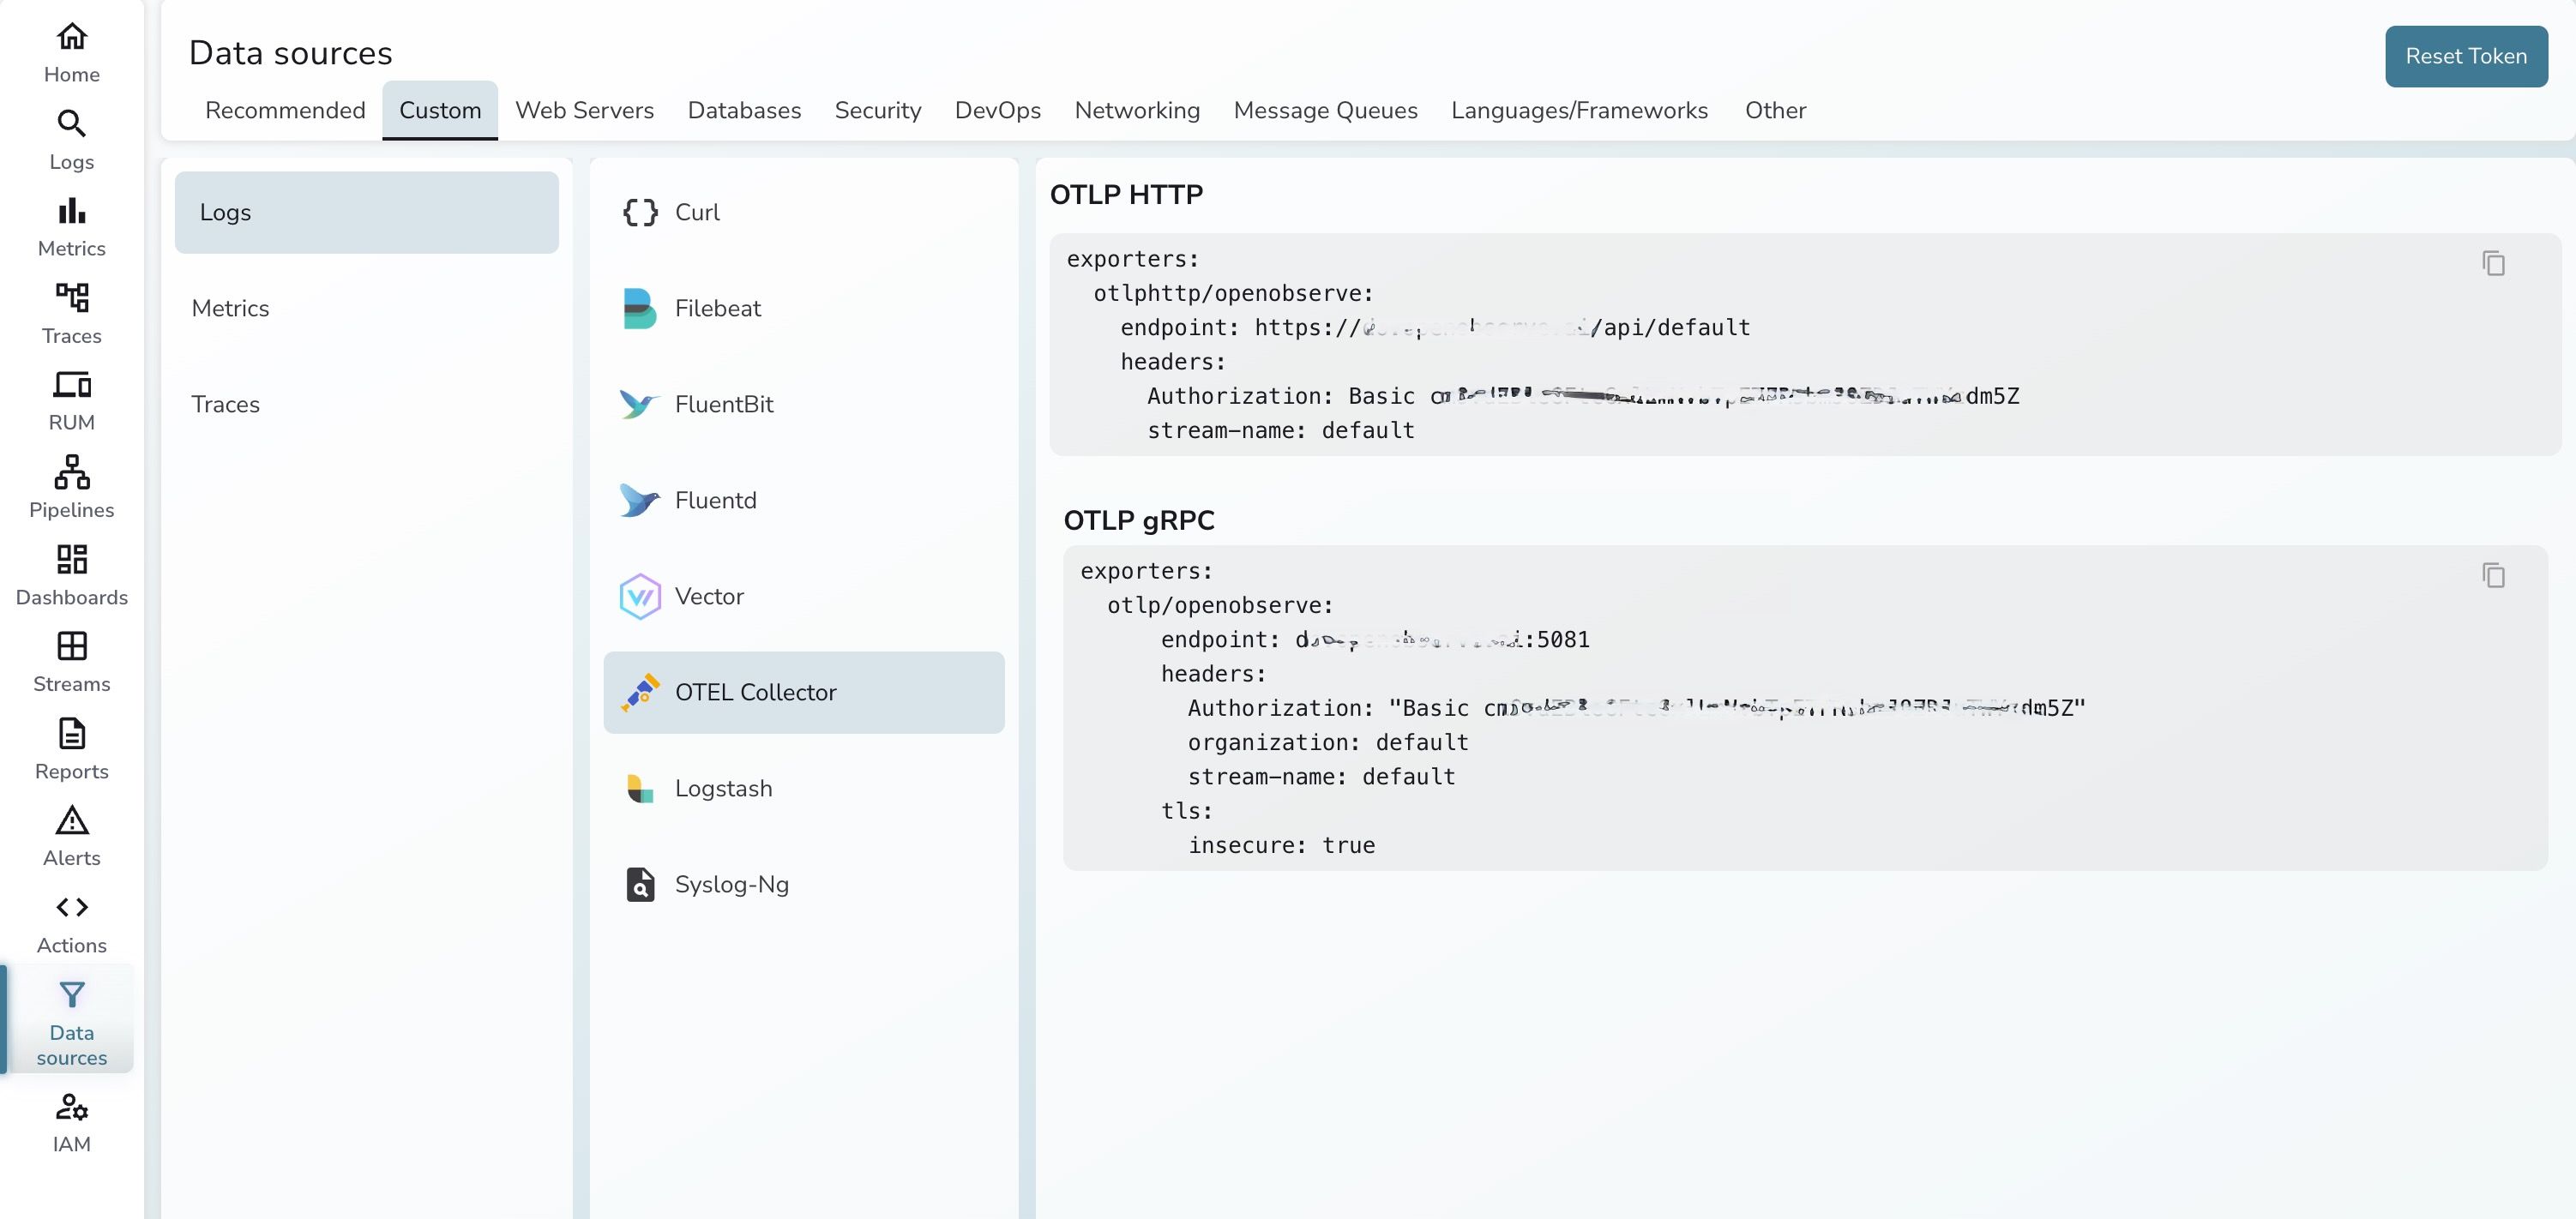
Update the Authorization header in the config with your base64-encoded credentials.
docker run -d \
  --network host \
  -v $(pwd)/otel-collector-config.yaml:/etc/otel-collector-config.yaml \
  --name otel-collector \
  --restart unless-stopped \
  otel/opentelemetry-collector-contrib:latest \
  --config=/etc/otel-collector-config.yaml
Check OpenTelemetry Collector:
# View collector logs
docker logs otel-collector

# Look for successful scrapes (no error messages)
Check OpenObserve:
DCGM_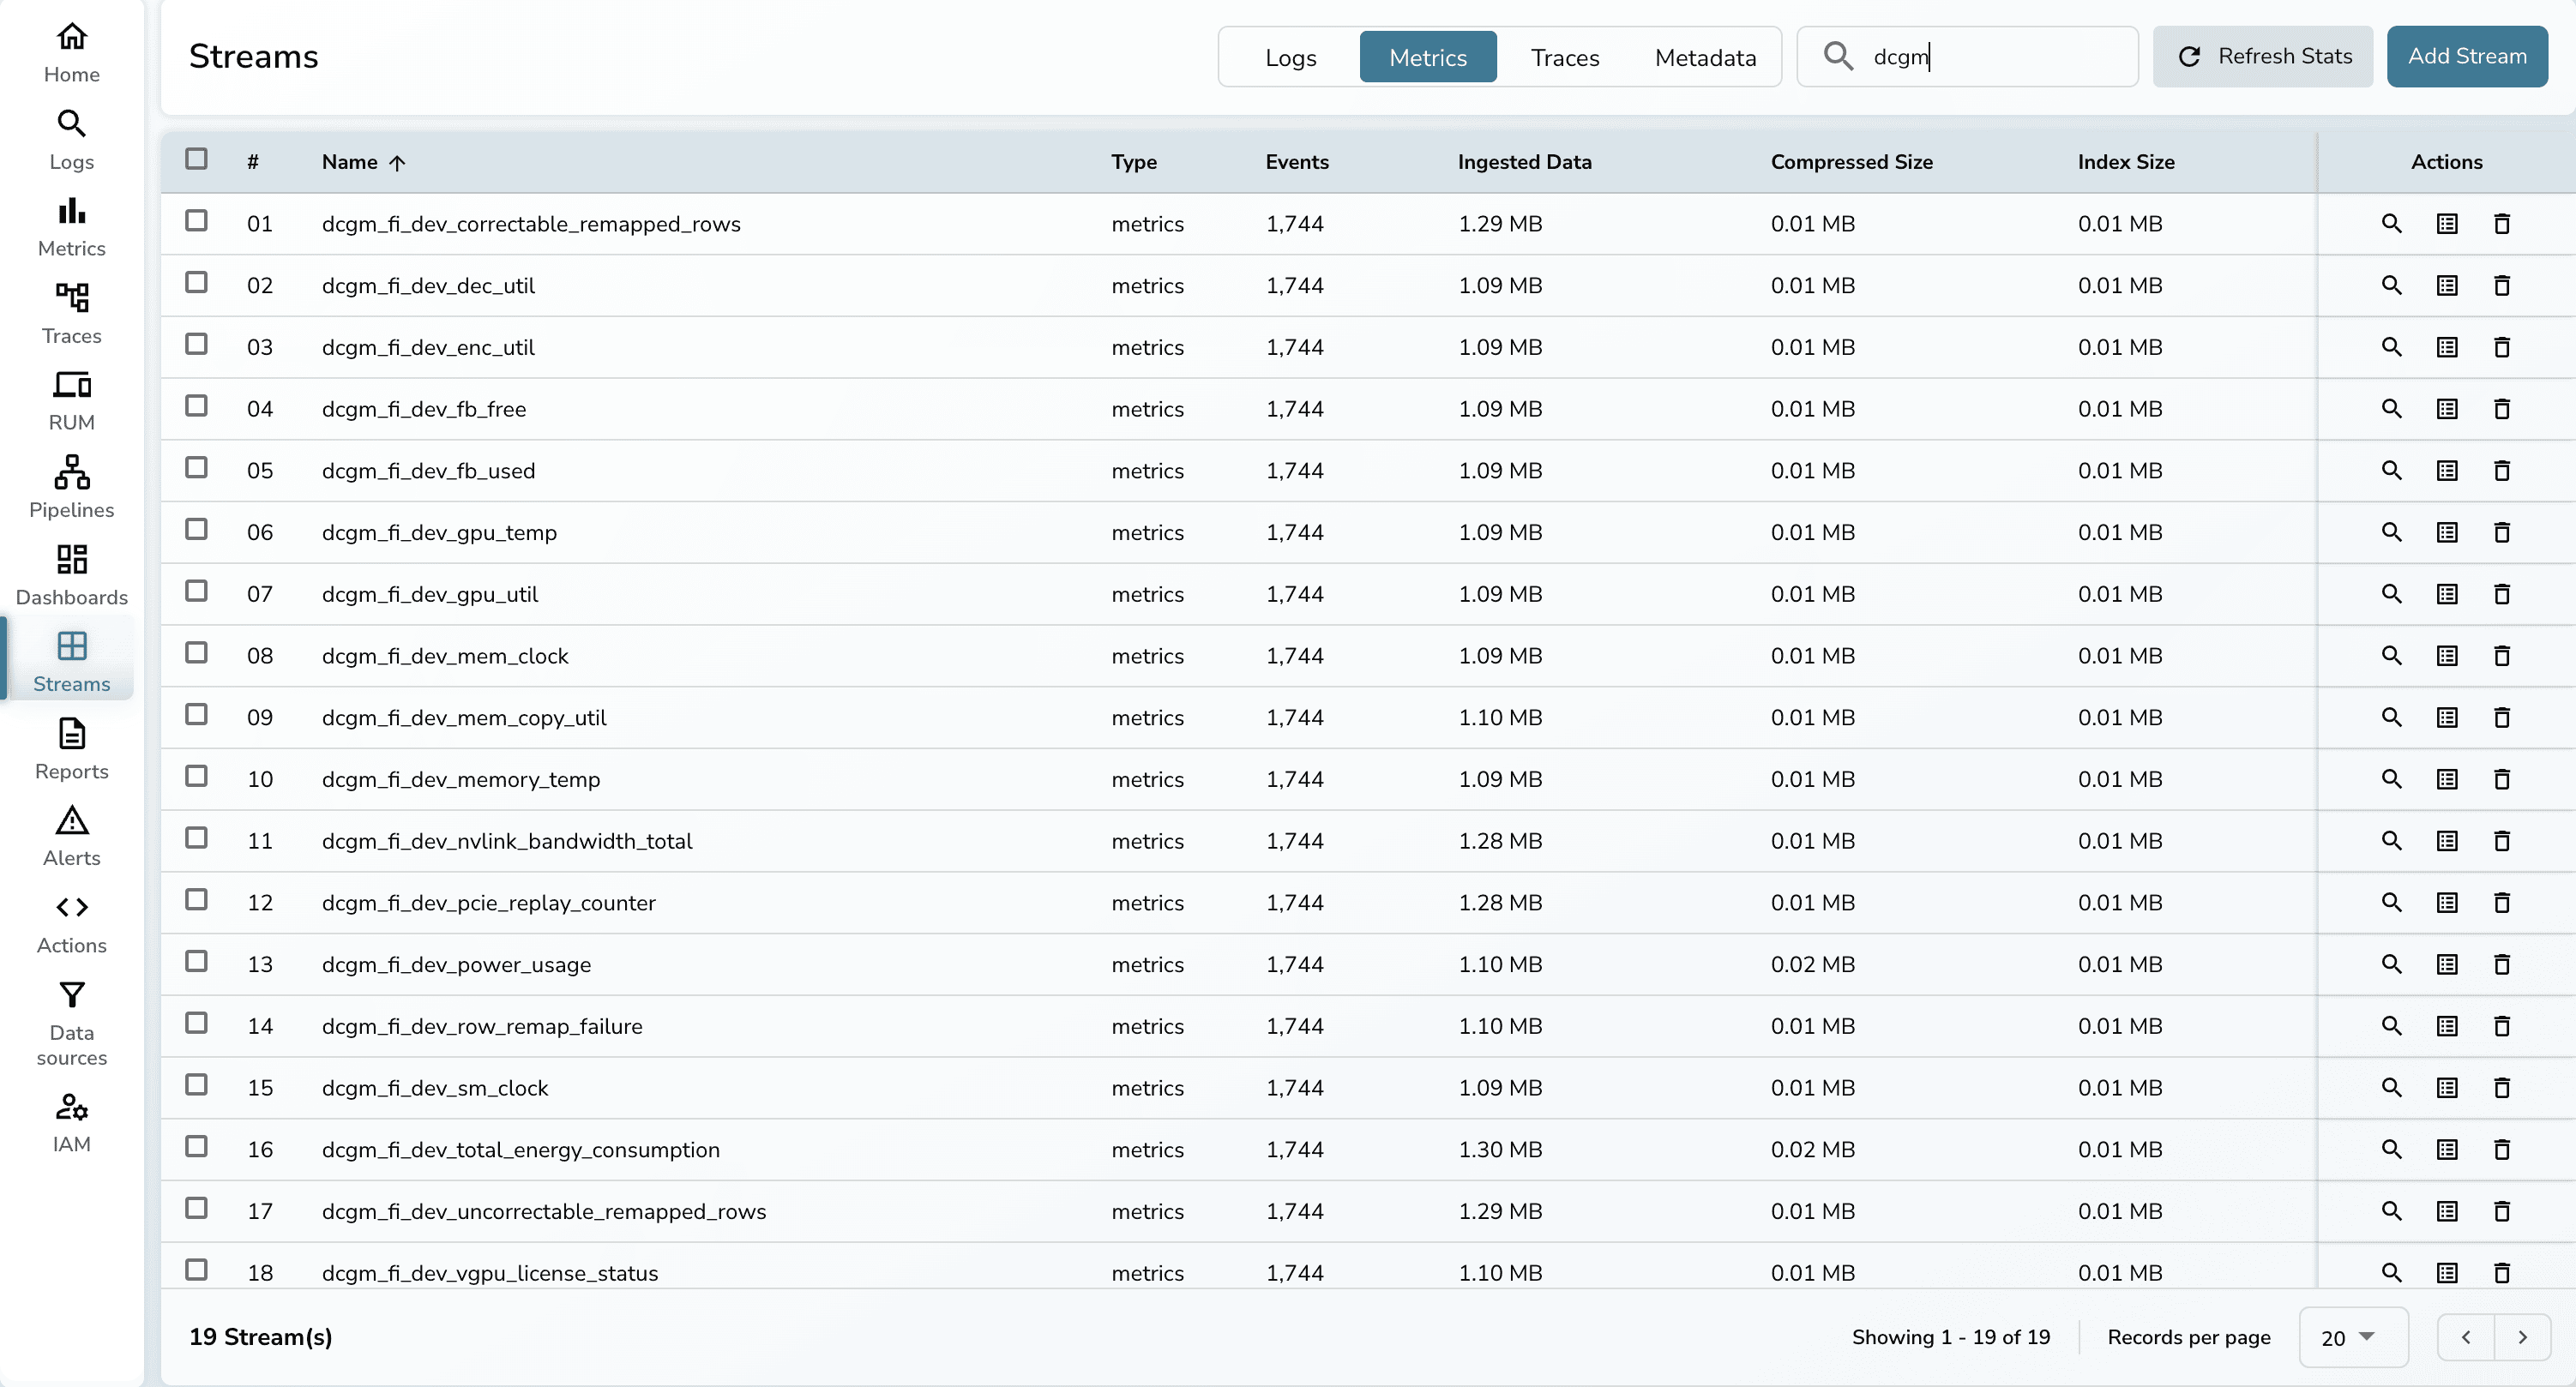
To verify monitoring is working, generate some GPU activity:
# Install PyTorch
pip3 install torch

# Create a load test script
cat > gpu_load.py <<'EOF'
import torch
import time

print("Starting GPU load test...")
devices = [torch.device(f'cuda:{i}') for i in range(torch.cuda.device_count())]
tensors = [torch.randn(15000, 15000, device=d) for d in devices]

print(f"Loaded {len(devices)} GPUs")
while True:
    for tensor in tensors:
        _ = torch.mm(tensor, tensor)
    time.sleep(0.5)
EOF

# Run load test
python3 gpu_load.py
Watch your metrics in OpenObserve - you should see GPU utilization spike!
 3. Once the dashboard has been imported, you will see the below metrics that were prebuilt and you can always customize the dashboards as needed.
Critical alerts to configure in OpenObserve:
DCGM_FI_DEV_GPU_TEMP > 85
Severity: Warning at 85°C, Critical at 90°C
Action: Check cooling systems, reduce workload
(DCGM_FI_DEV_FB_USED / (DCGM_FI_DEV_FB_USED + DCGM_FI_DEV_FB_FREE)) > 0.90
Severity: Warning at 90%, Critical at 95%
Action: Optimize memory usage or scale horizontally
avg(DCGM_FI_DEV_GPU_UTIL) < 20
Duration: For 30 minutes
Action: Review workload scheduling, consider rightsizing
increase(DCGM_FI_DEV_XID_ERRORS[5m]) > 0
Severity: Critical
Action: Immediate investigation, potential RMA
increase(DCGM_FI_DEV_THERMAL_VIOLATION[5m]) > 0
Severity: Warning
Action: Improve cooling or reduce ambient temperature
absent(DCGM_FI_DEV_GPU_TEMP)
Duration: For 2 minutes
Action: Check GPU health, driver status, fabric manager
| Aspect | Traditional Monitoring (Prometheus/Grafana) | OpenObserve for GPU Monitoring |
|---|---|---|
| Setup Complexity | Requires Prometheus, node exporters, Grafana, storage backend, and complex configuration | Single unified platform with built-in visualization |
| Storage Costs | High - Prometheus stores all metrics at full resolution, requires expensive SSD storage | 80% lower - Advanced compression and columnar storage |
| Multi-tenancy | Complex setup requiring multiple Prometheus instances or federation | Built-in with organization isolation and access controls |
| Alerting | Separate alerting system (Alertmanager), complex routing configuration | Integrated alerting with flexible notification channels |
| Long-term Retention | Expensive - requires additional tools like Thanos or Cortex | Native long-term storage with automatic data lifecycle management |
| GPU-Specific Features | Generic time-series database, not optimized for GPU metrics | Optimized for high-cardinality workloads like GPU monitoring |
| Log Correlation | Separate log management system needed (ELK, Loki) | Unified logs, metrics, and traces in one platform |
| Setup Time | 4-8 hours (multiple components, configurations, troubleshooting) | 30 minutes (end-to-end) |
| Maintenance Overhead | High - multiple systems to update, monitor, and troubleshoot | Low - single platform with automatic updates |
For an 8-GPU H200 cluster worth $320,000:
Detect thermal throttling early:
Optimize utilization:
Prevent downtime:
GPU monitoring is no longer optional—it's essential infrastructure for any organization running GPU workloads. The combination of DCGM Exporter and OpenObserve provides:
✅ Complete visibility into GPU health, performance, and utilization
✅ Cost optimization through identifying waste and inefficiencies
✅ Proactive alerting to prevent outages and degradation
✅ Data-driven decisions for capacity planning and architecture
✅ 89% lower TCO compared to traditional monitoring stacks
✅ 30-minute setup vs. days with traditional tools
Whether you're running AI/ML workloads, rendering farms, scientific computing, or GPU-accelerated databases, this monitoring solution delivers immediate ROI while scaling effortlessly as your infrastructure grows.
Get Started with OpenObserve Today!
Sign up for a 14 day trial Check out our GitHub repository for self-hosting and contribution opportunities
Chaitanya Sistla is a Principal Solutions Architect with 17X certifications across Cloud, Data, DevOps, and Cybersecurity. Leveraging extensive startup experience and a focus on MLOps, Chaitanya excels at designing scalable, innovative solutions that drive operational excellence and business transformation.


