Unveiling Microsoft 365 Insights: From Diagnostics to Actionable Observability


Try OpenObserve Cloud today for more efficient and performant observability.

Managing and analyzing logs from Microsoft 365 services like Graph APIs, audit logs, sign-ins, and managed identities is critical for ensuring security, compliance, and performance optimization. While Microsoft 365 provides rich telemetry, collecting, processing, and centralizing these logs for real-time observability can be challenging without a scalable pipeline.
This guide explains the necessity of structured log ingestion, how it empowers security and operational excellence, and provides a step-by-step setup for ingesting Microsoft 365 logs into OpenObserve via Azure Event Hub.
Ingesting Microsoft 365 logs into OpenObserve enables:
Before starting, ensure you have:
m365-eventhub). 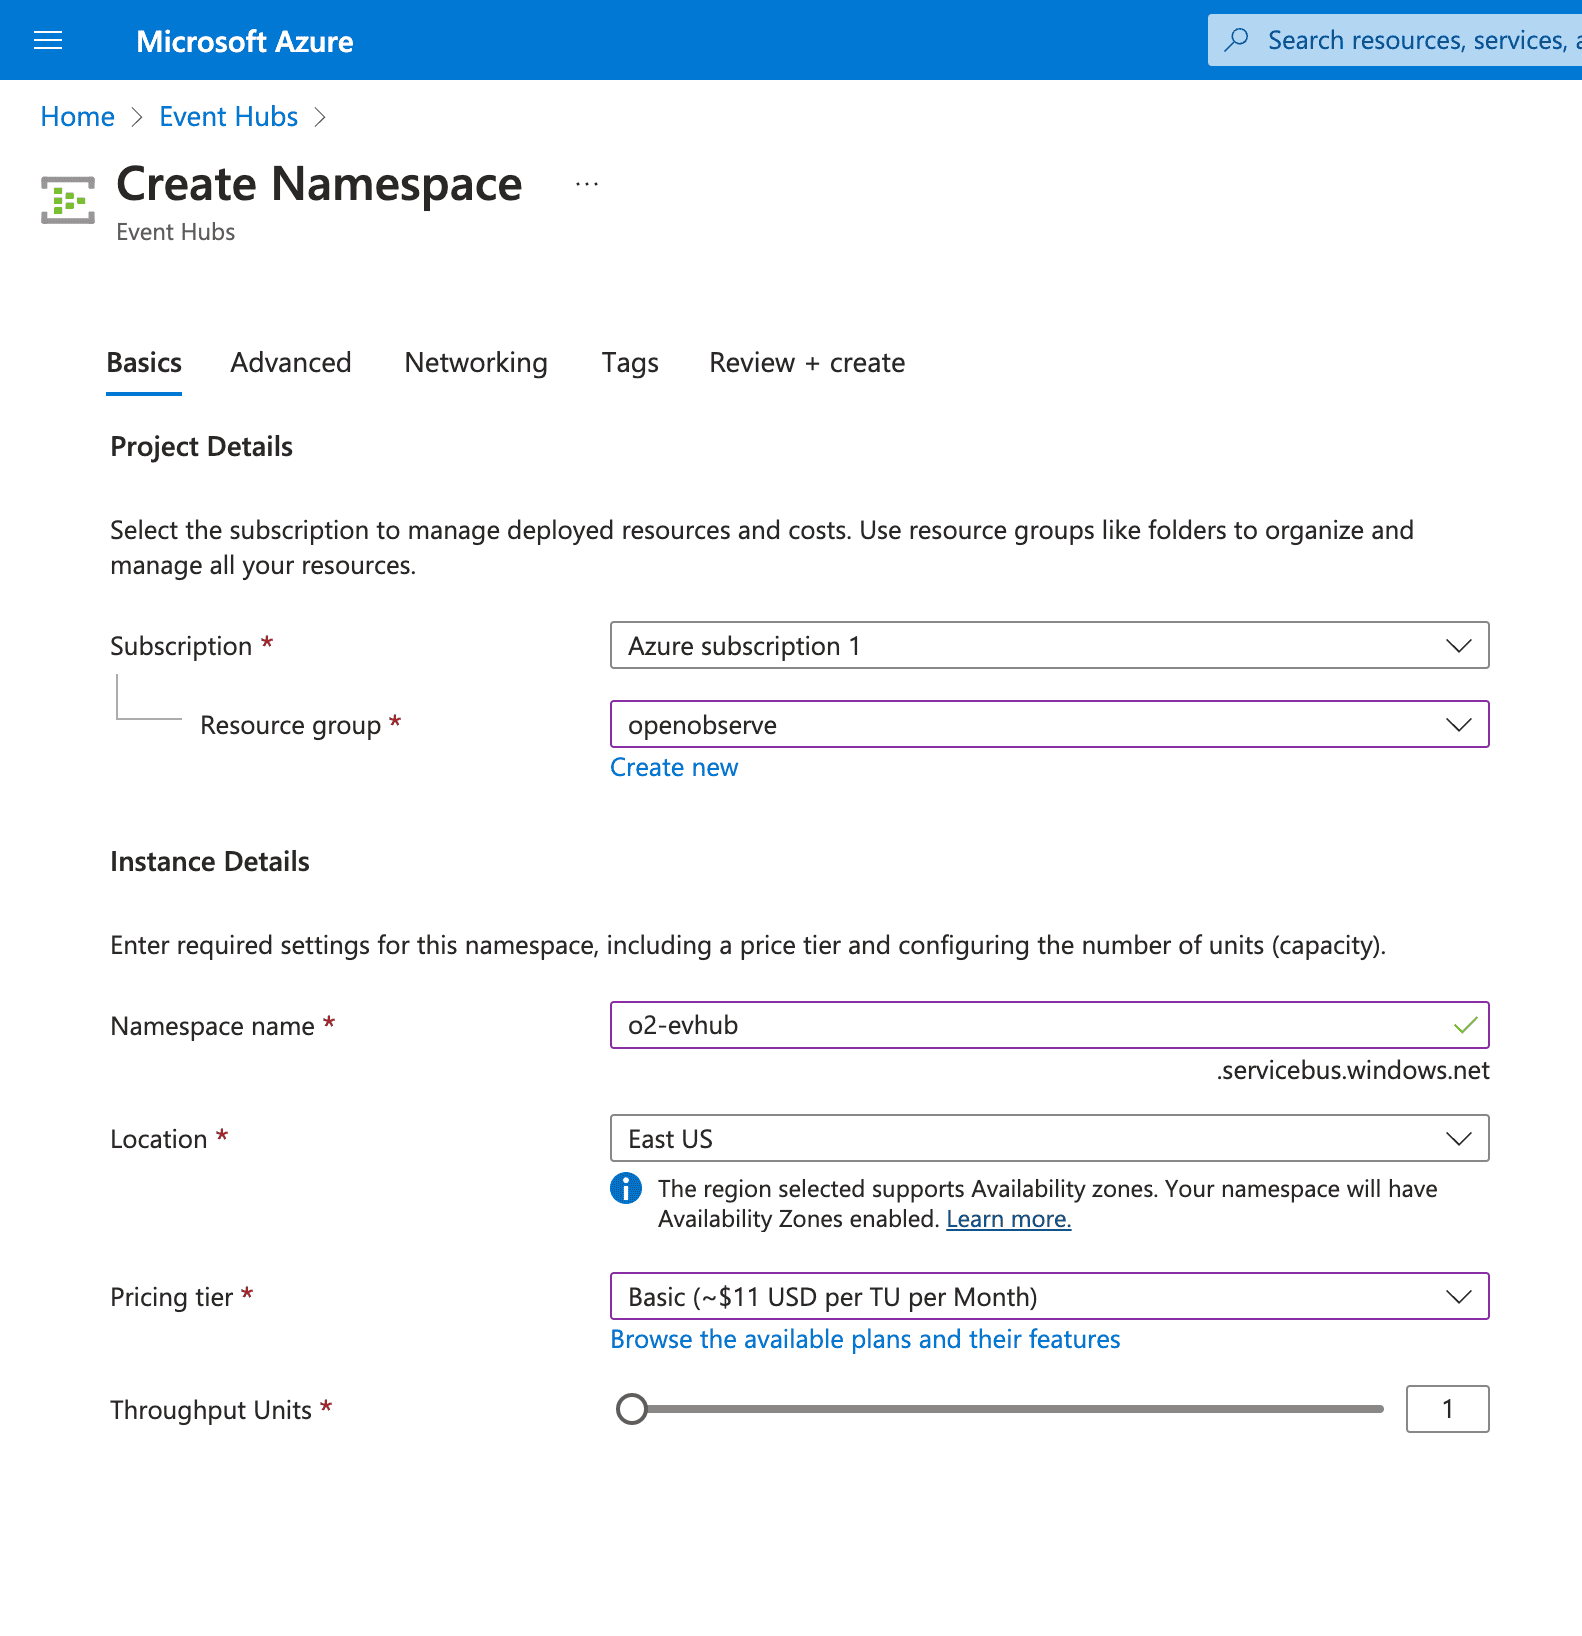
o2) and leave default settings for Partition Count and Message Retention. 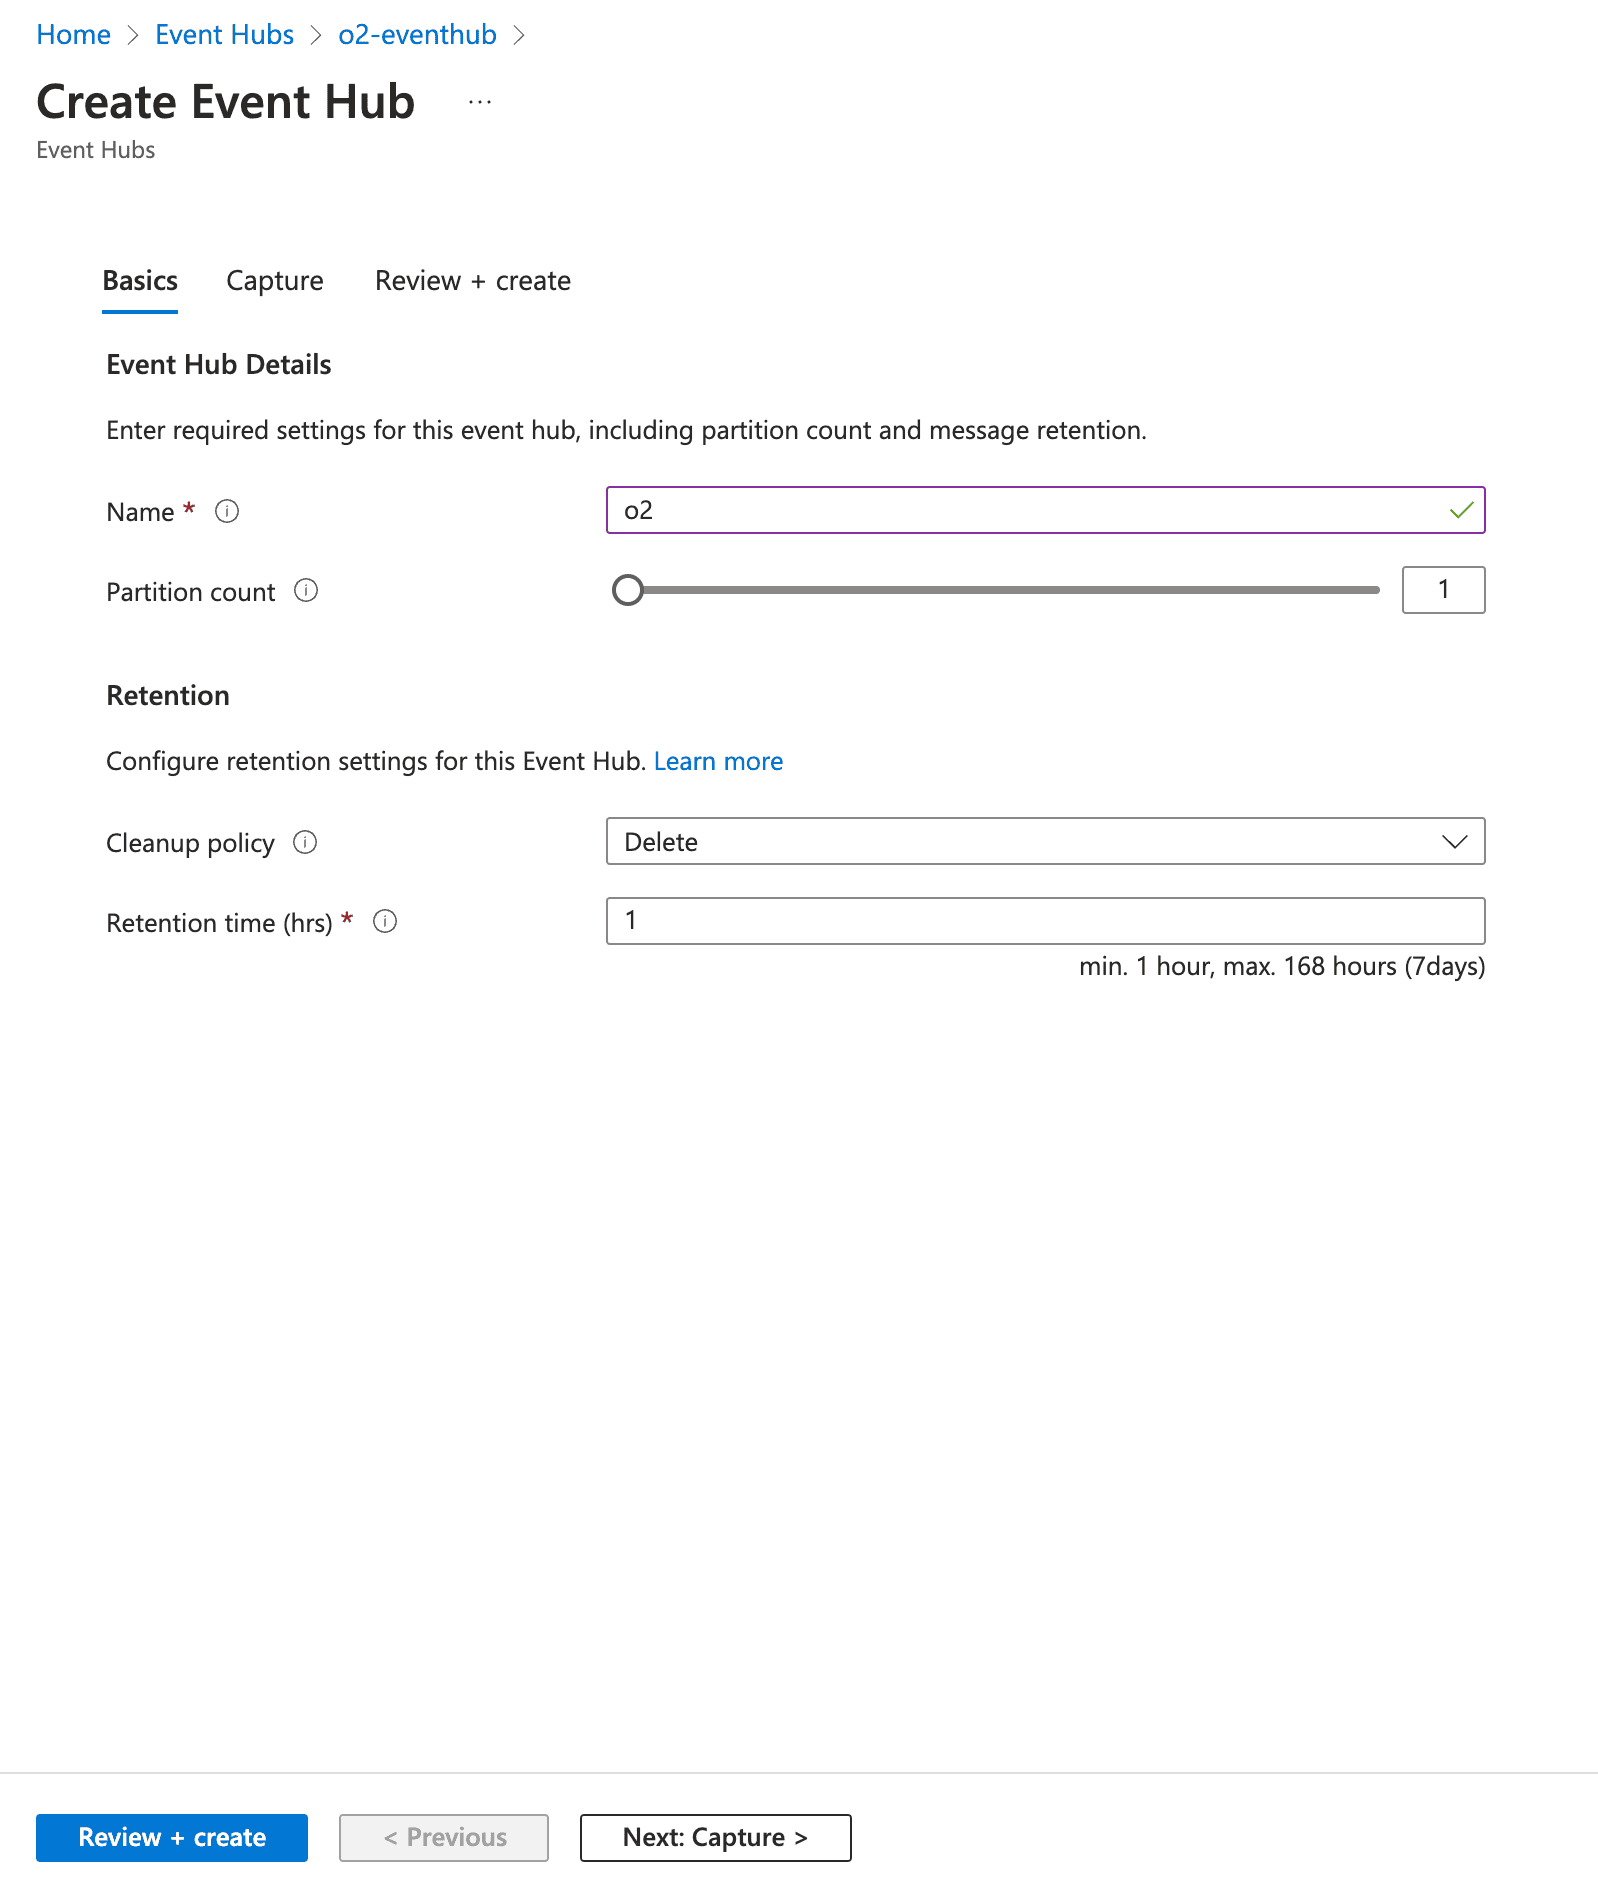
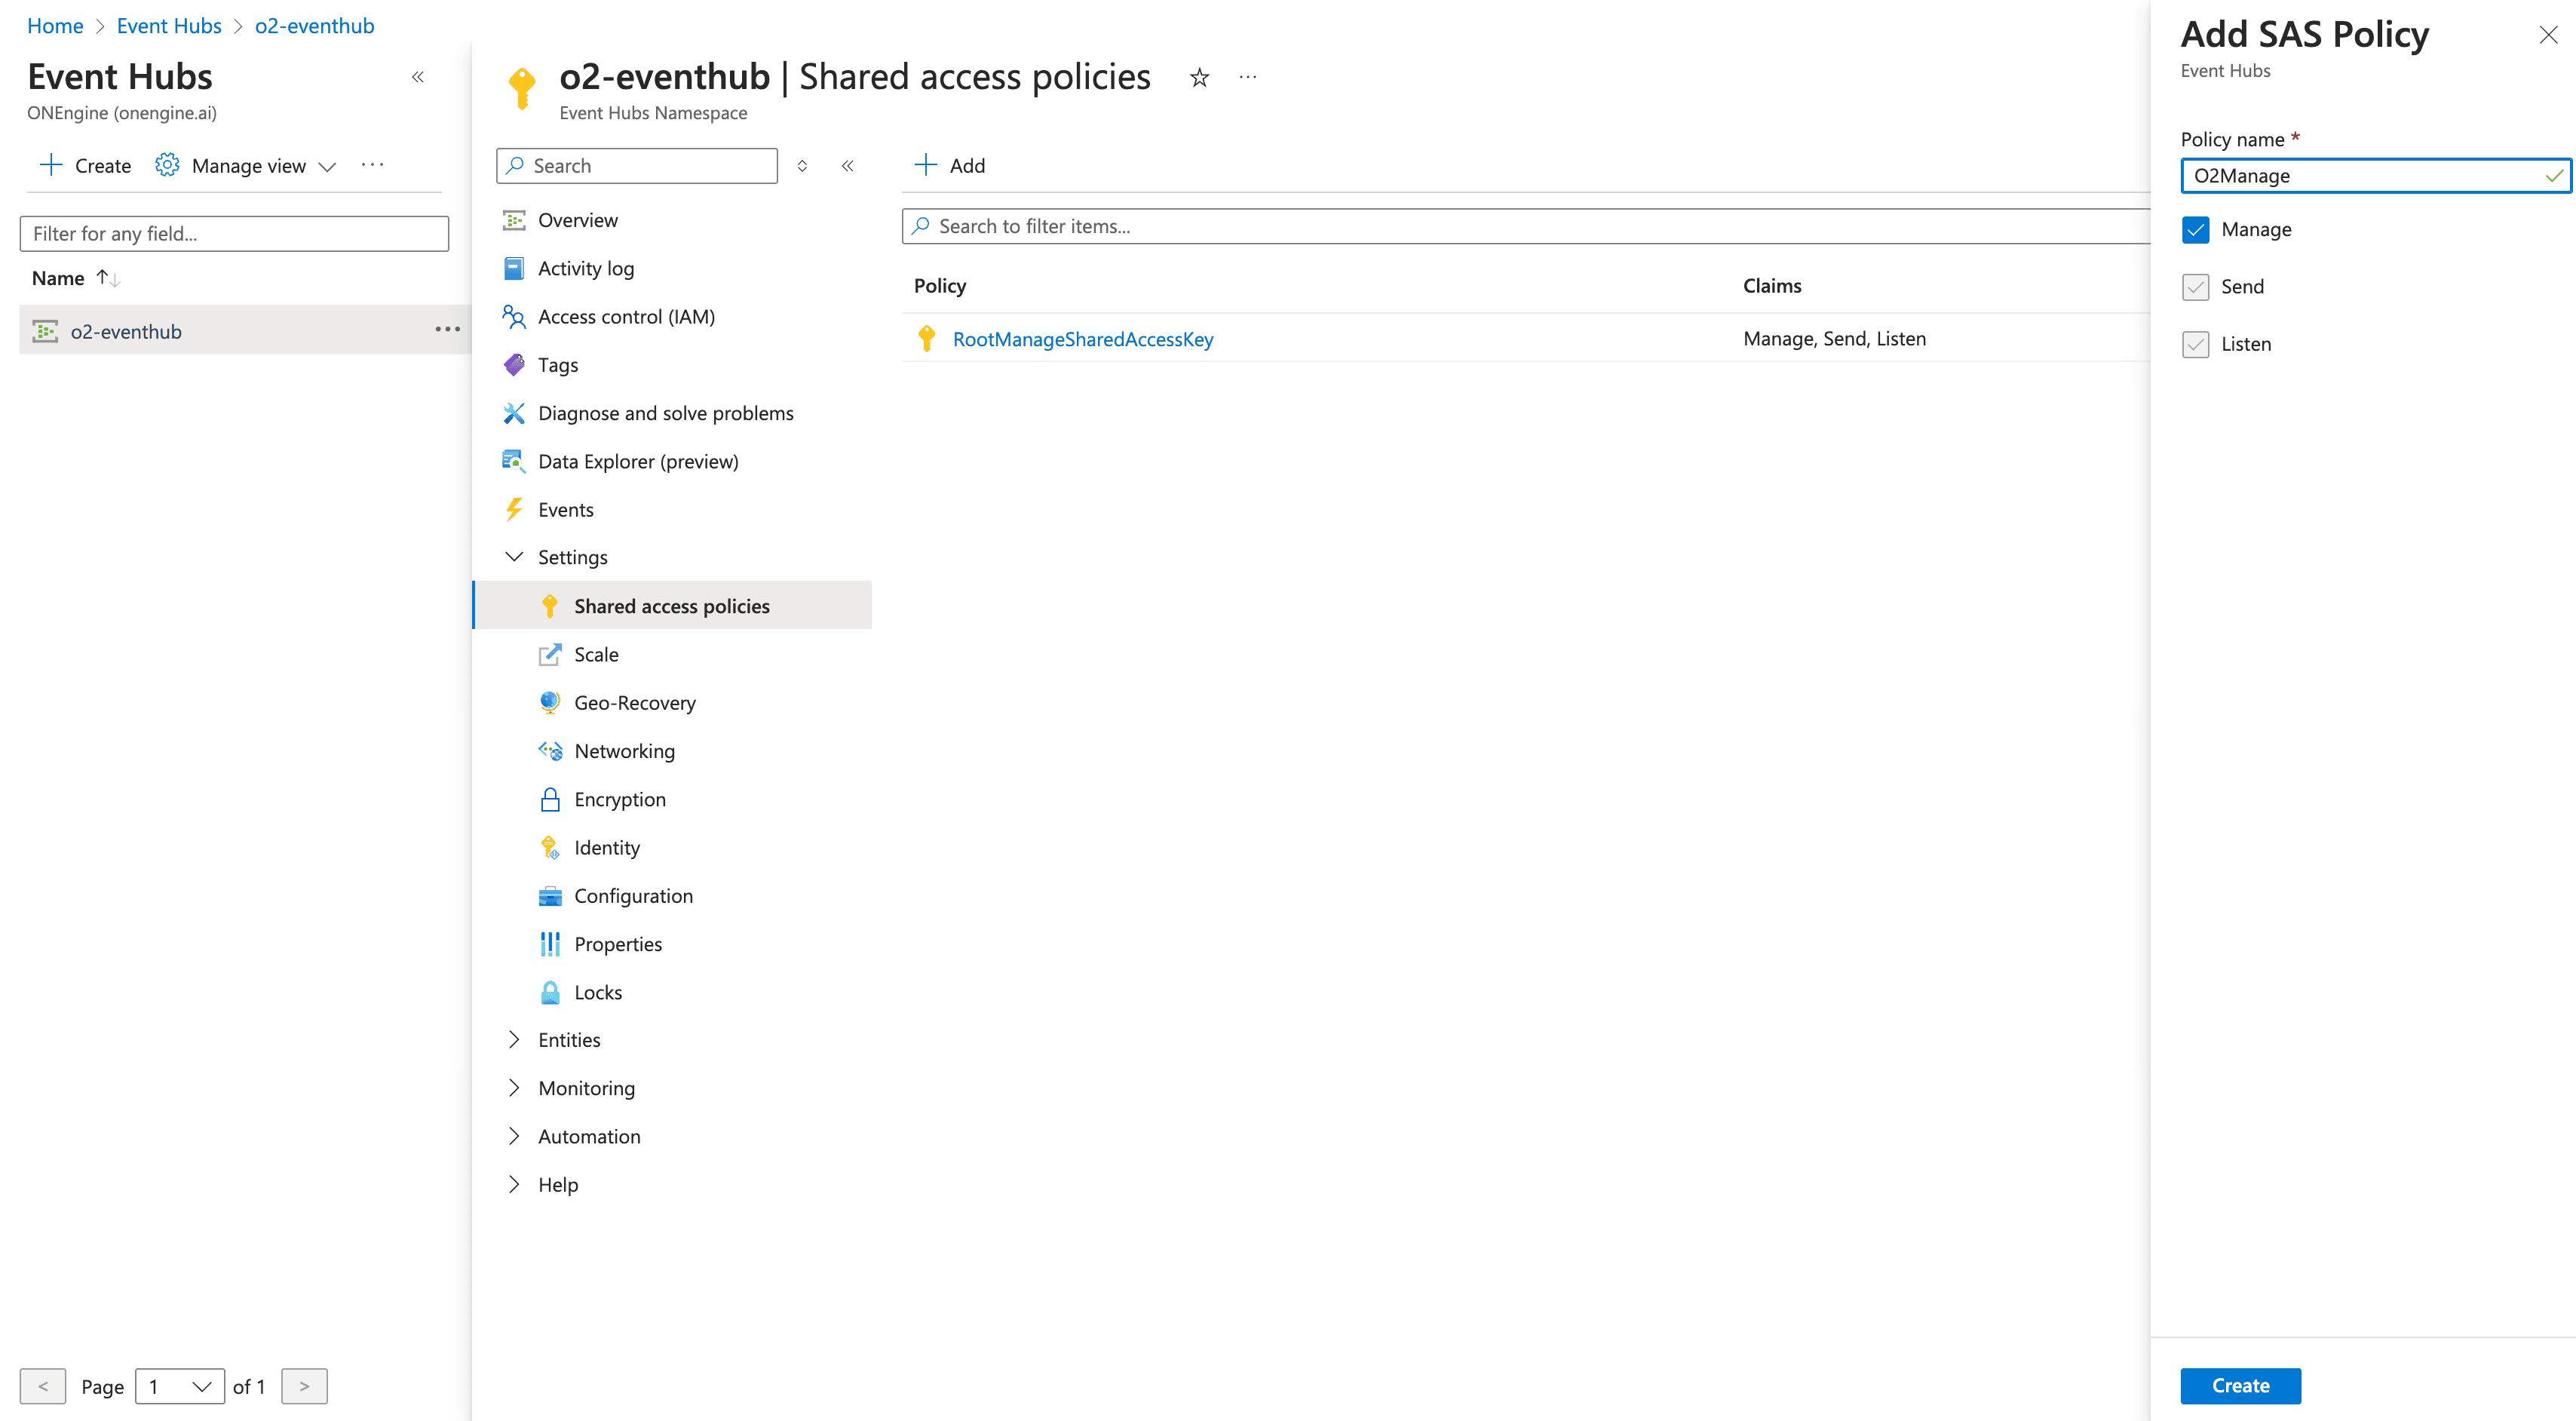
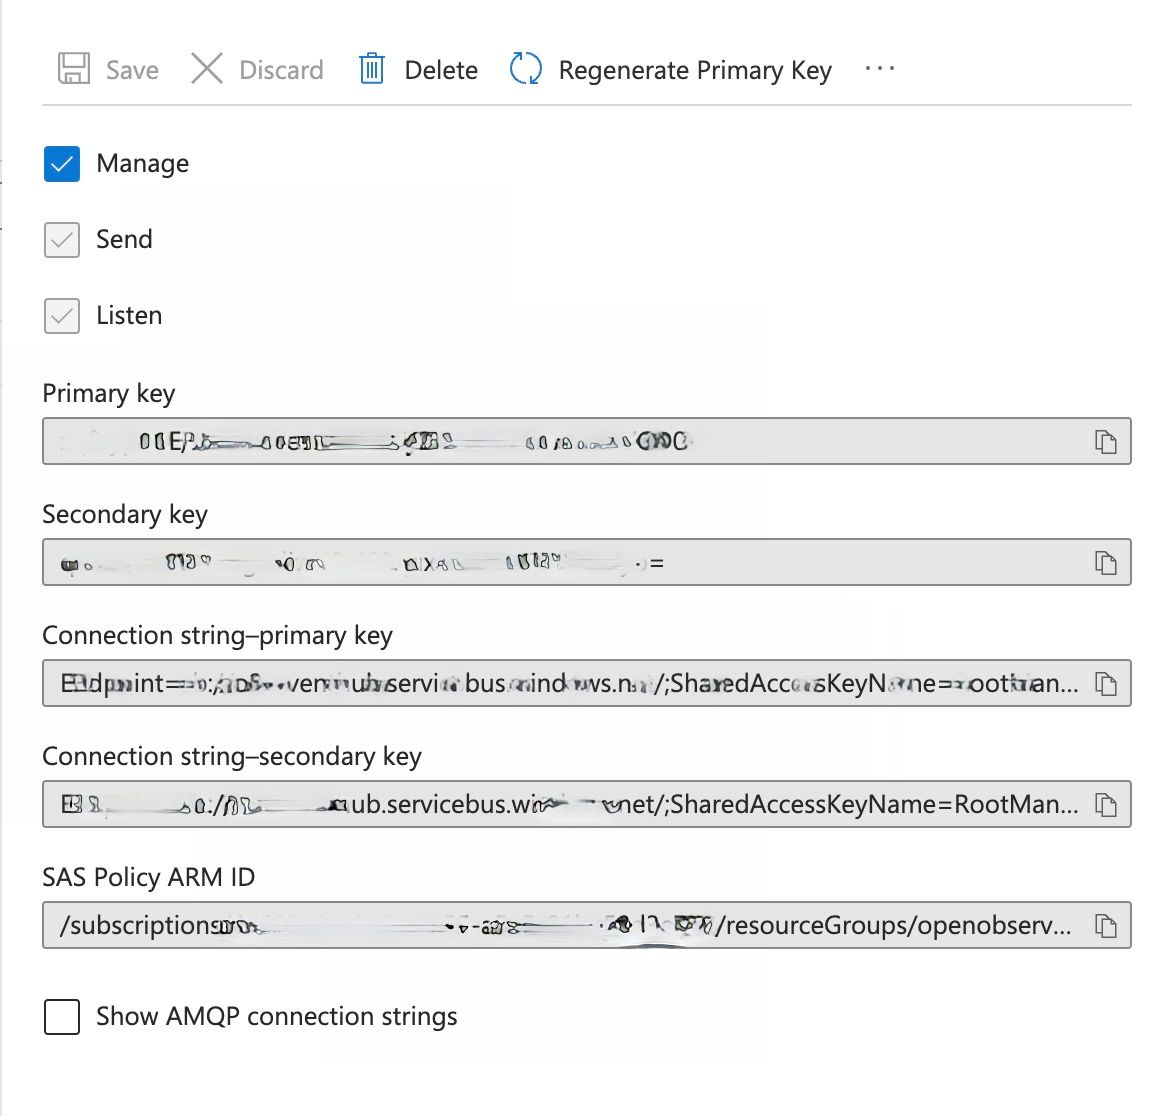
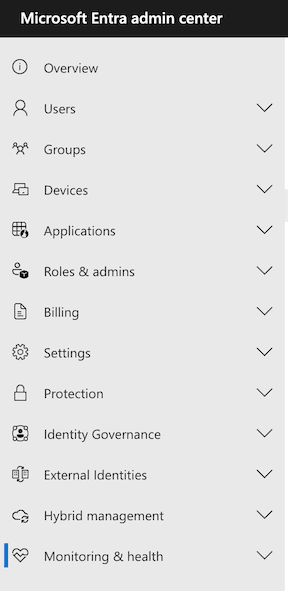
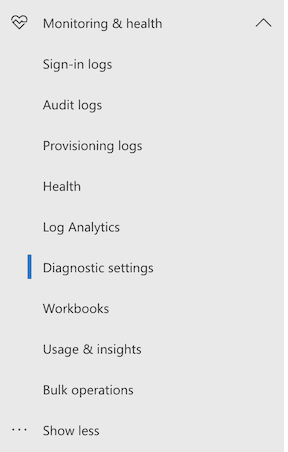
m365-diagnostics). 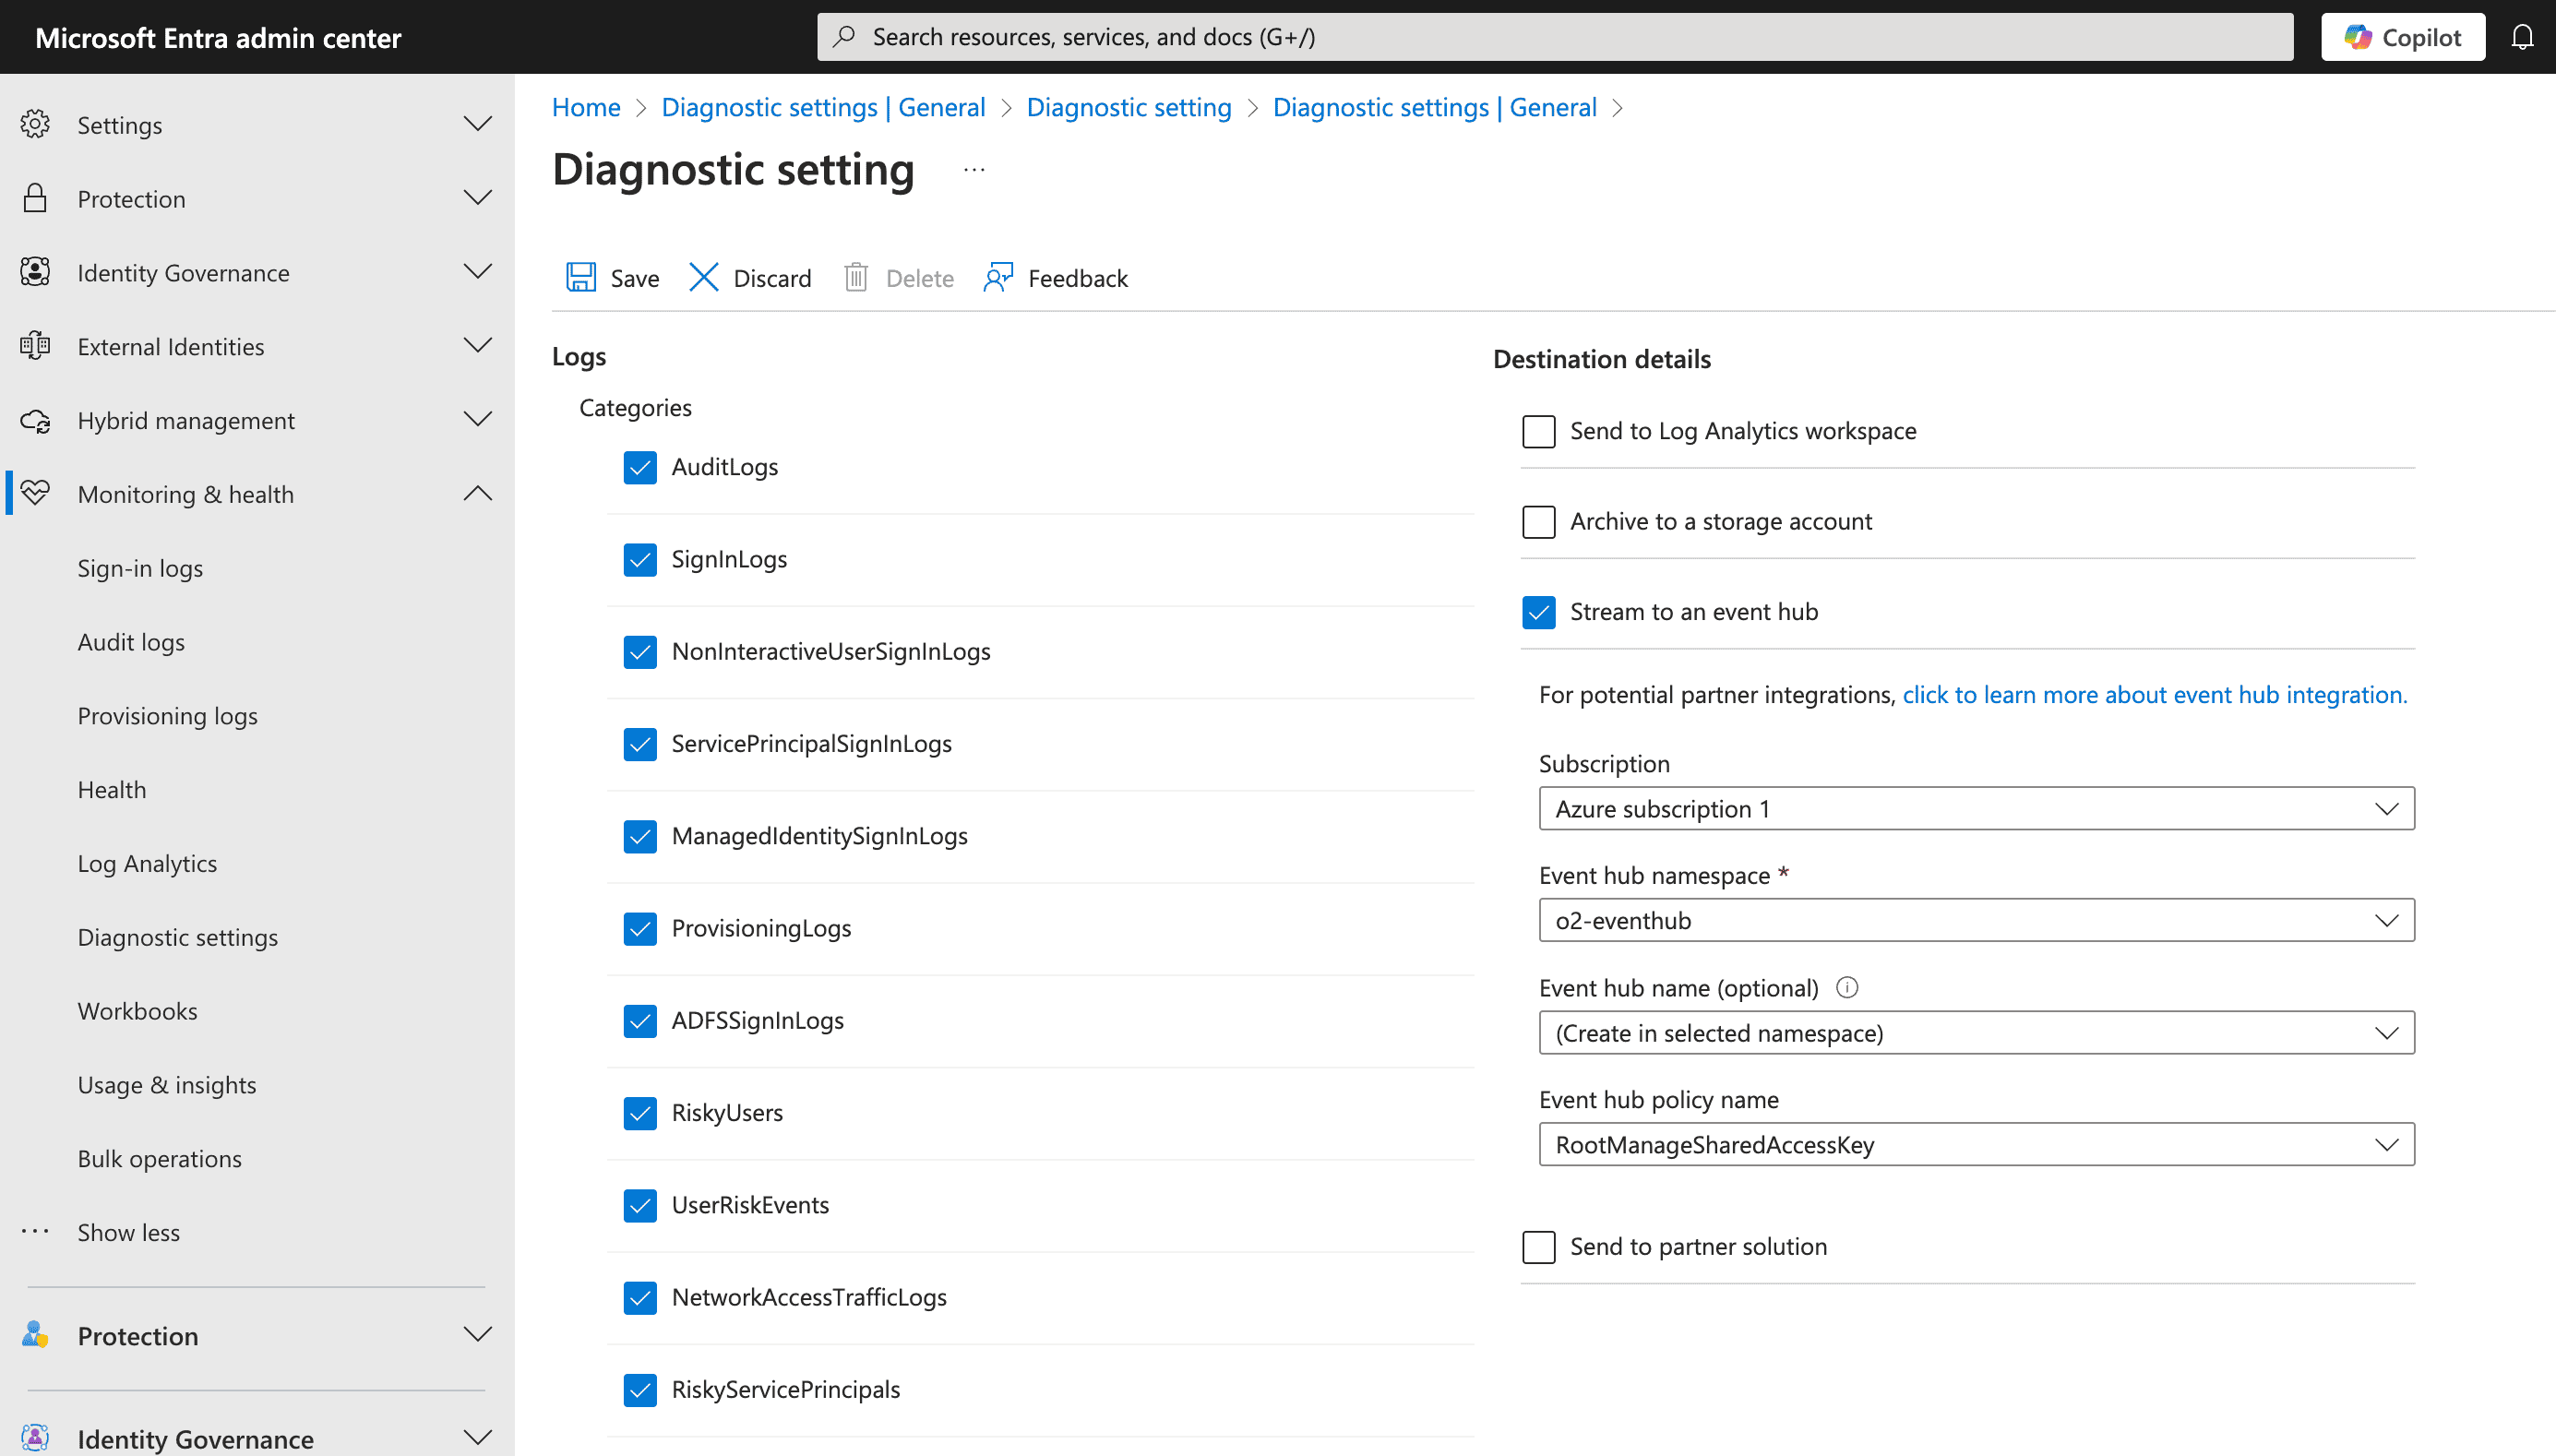
Azure Functions will forward logs from the Event Hub to OpenObserve.
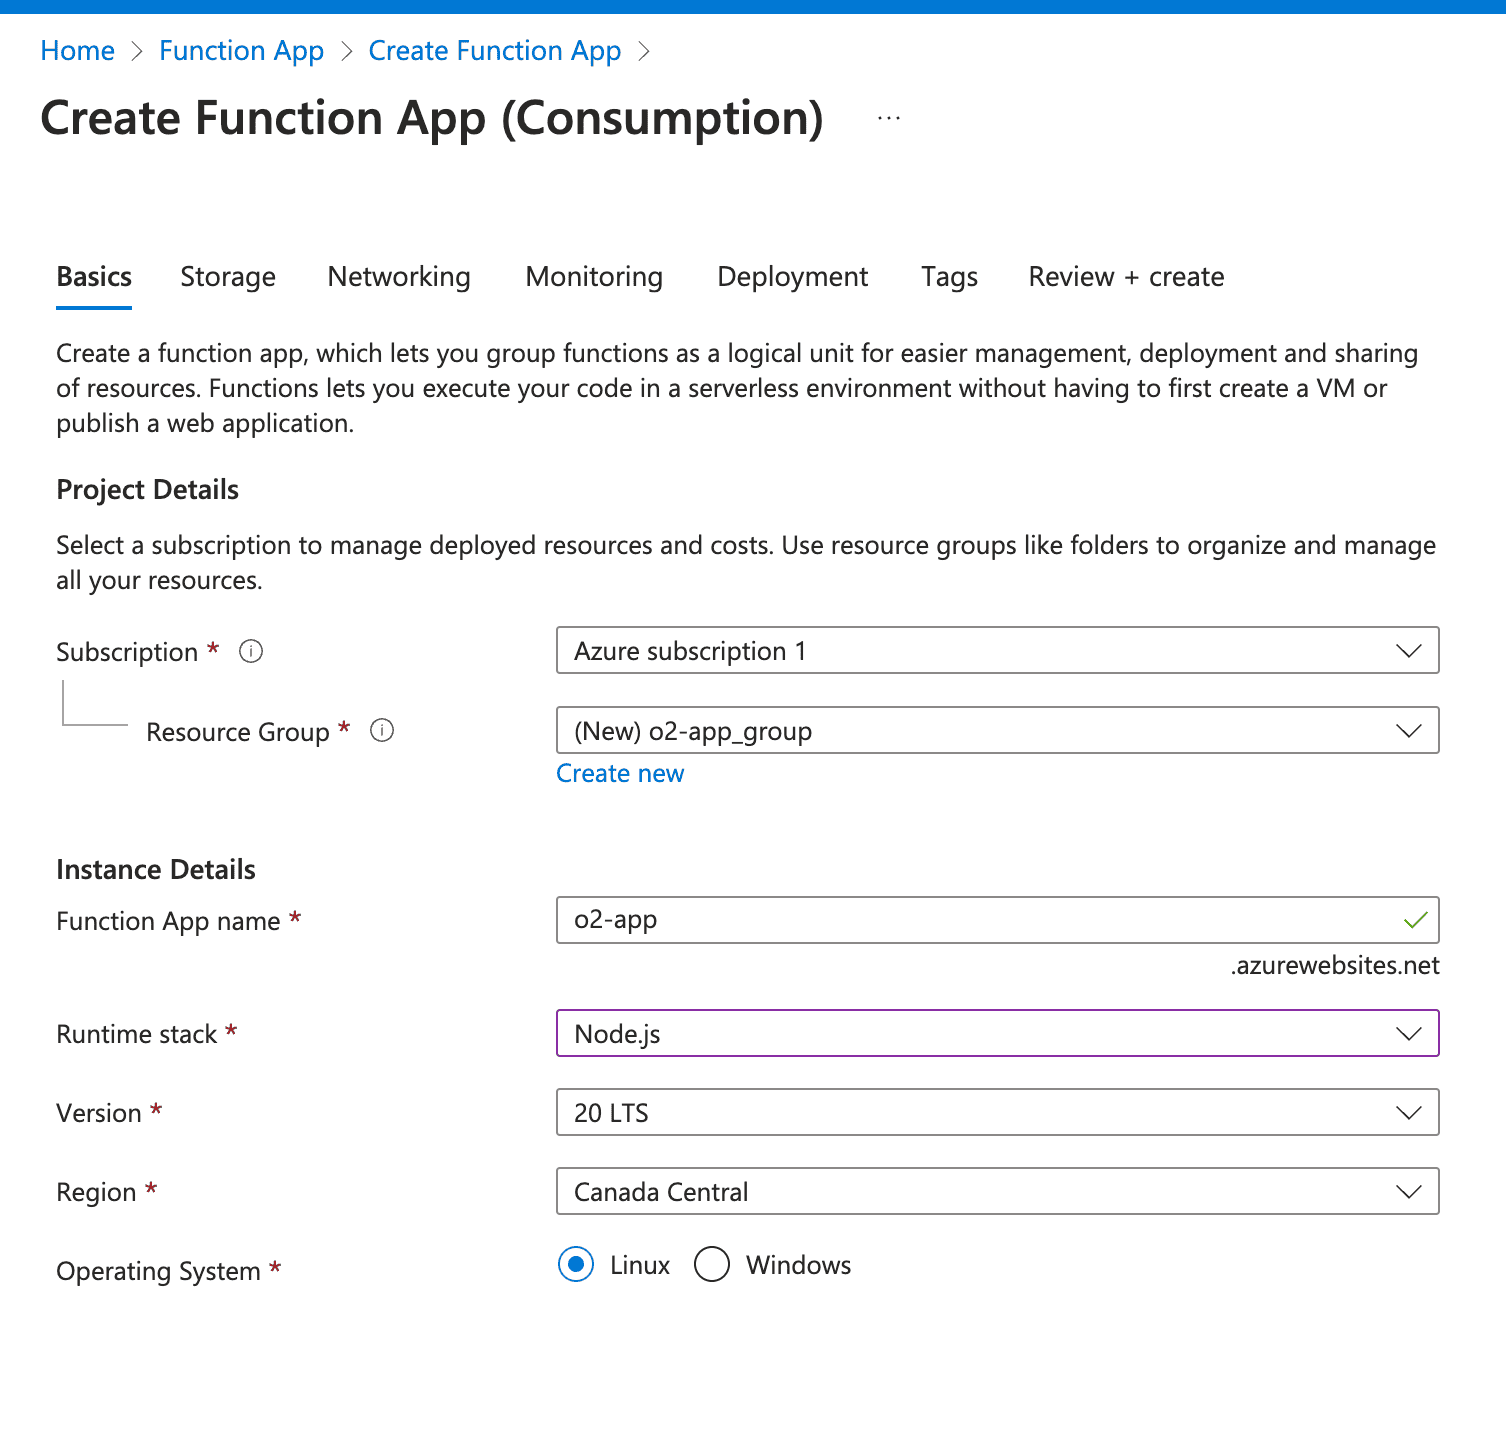
To create an azure function, you will need to first create the Function App by searching for it in your azure portal and select a tier along with your runtime stack.
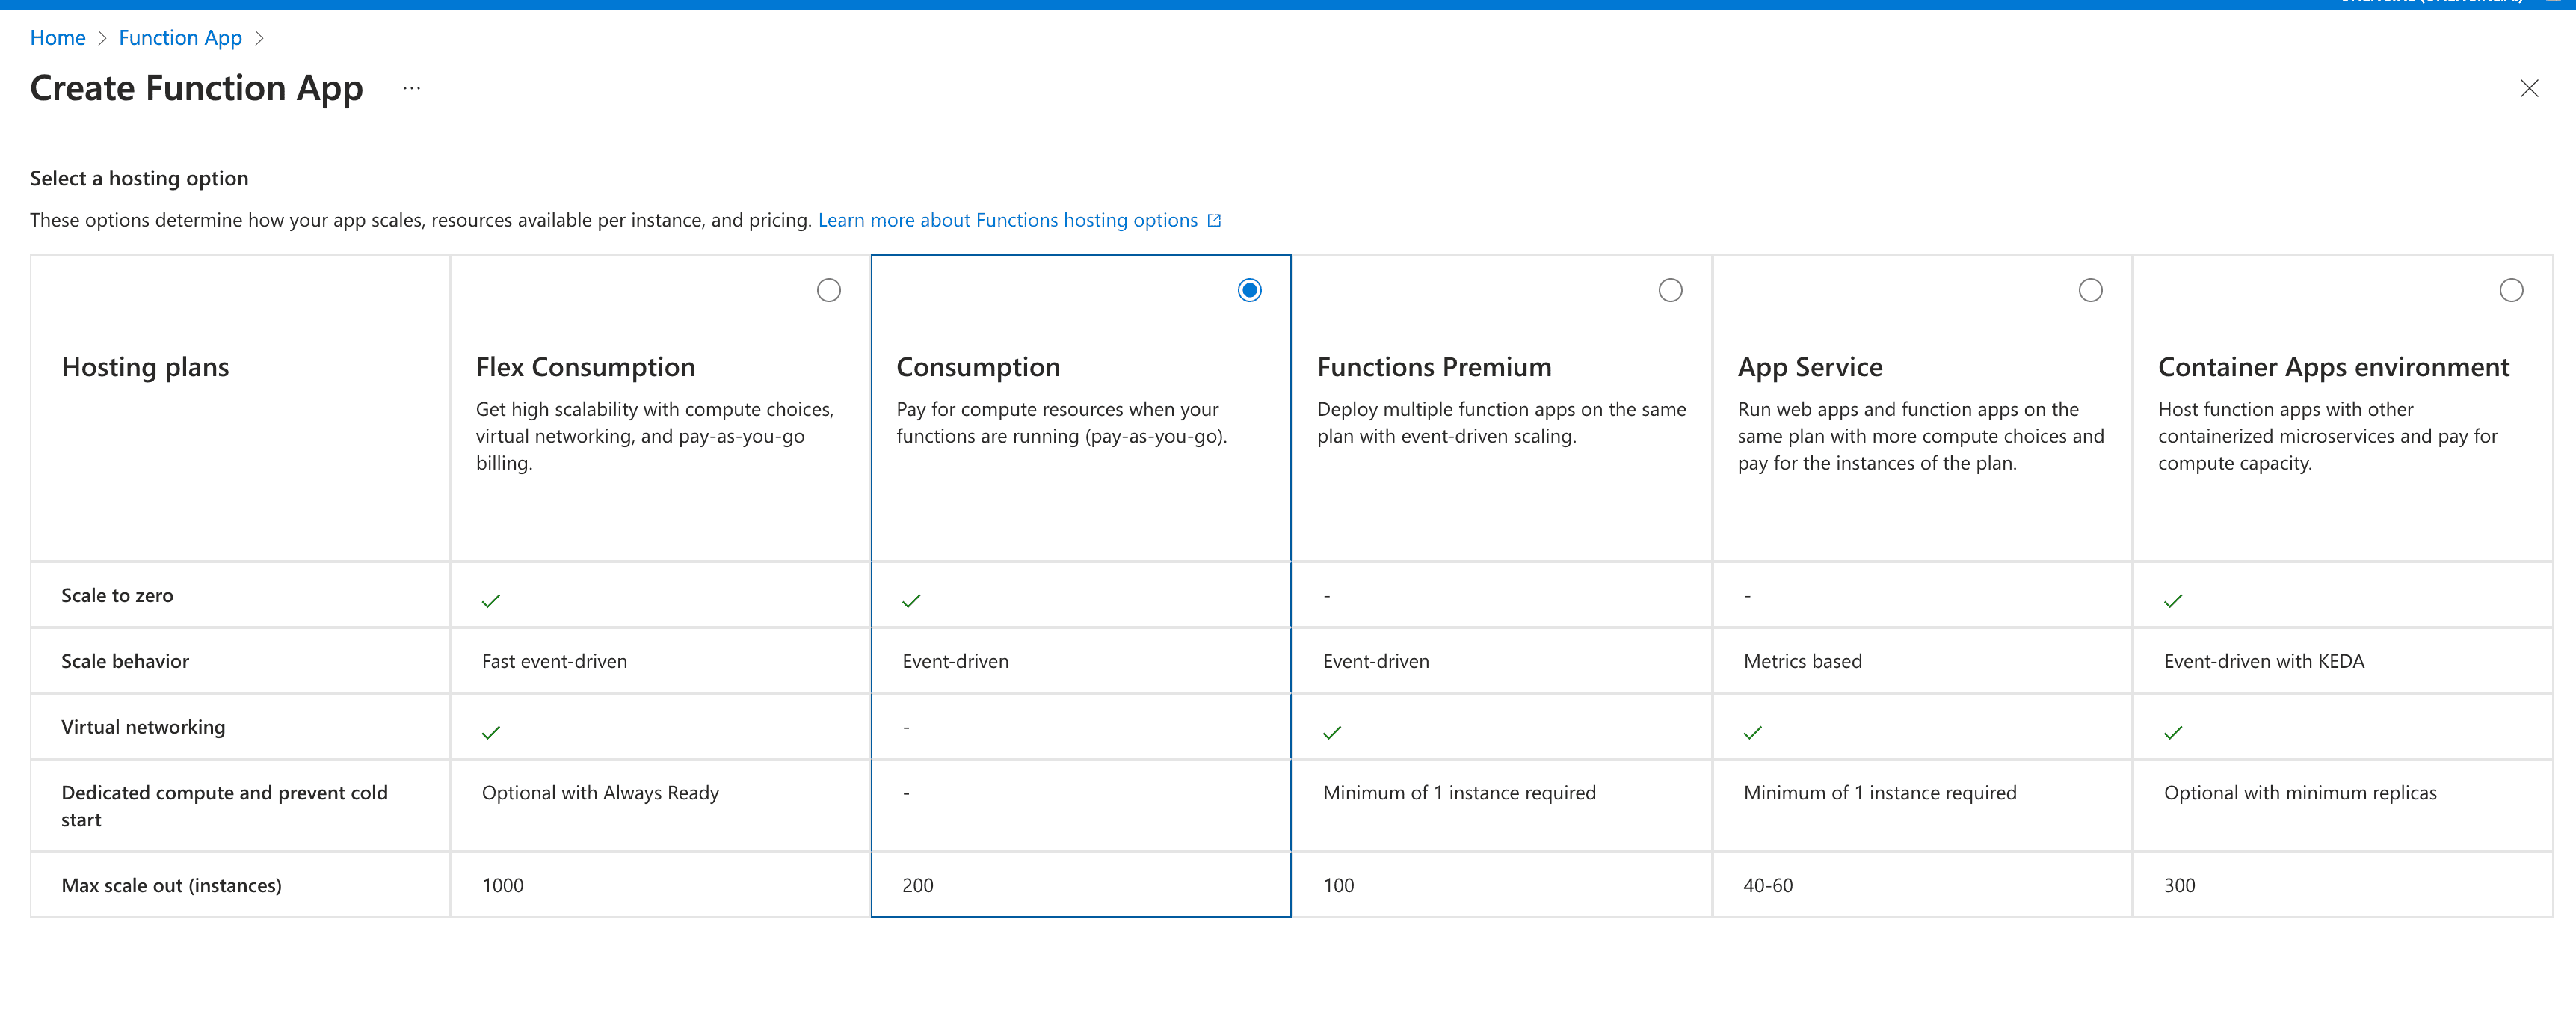
local.settings.json) with: 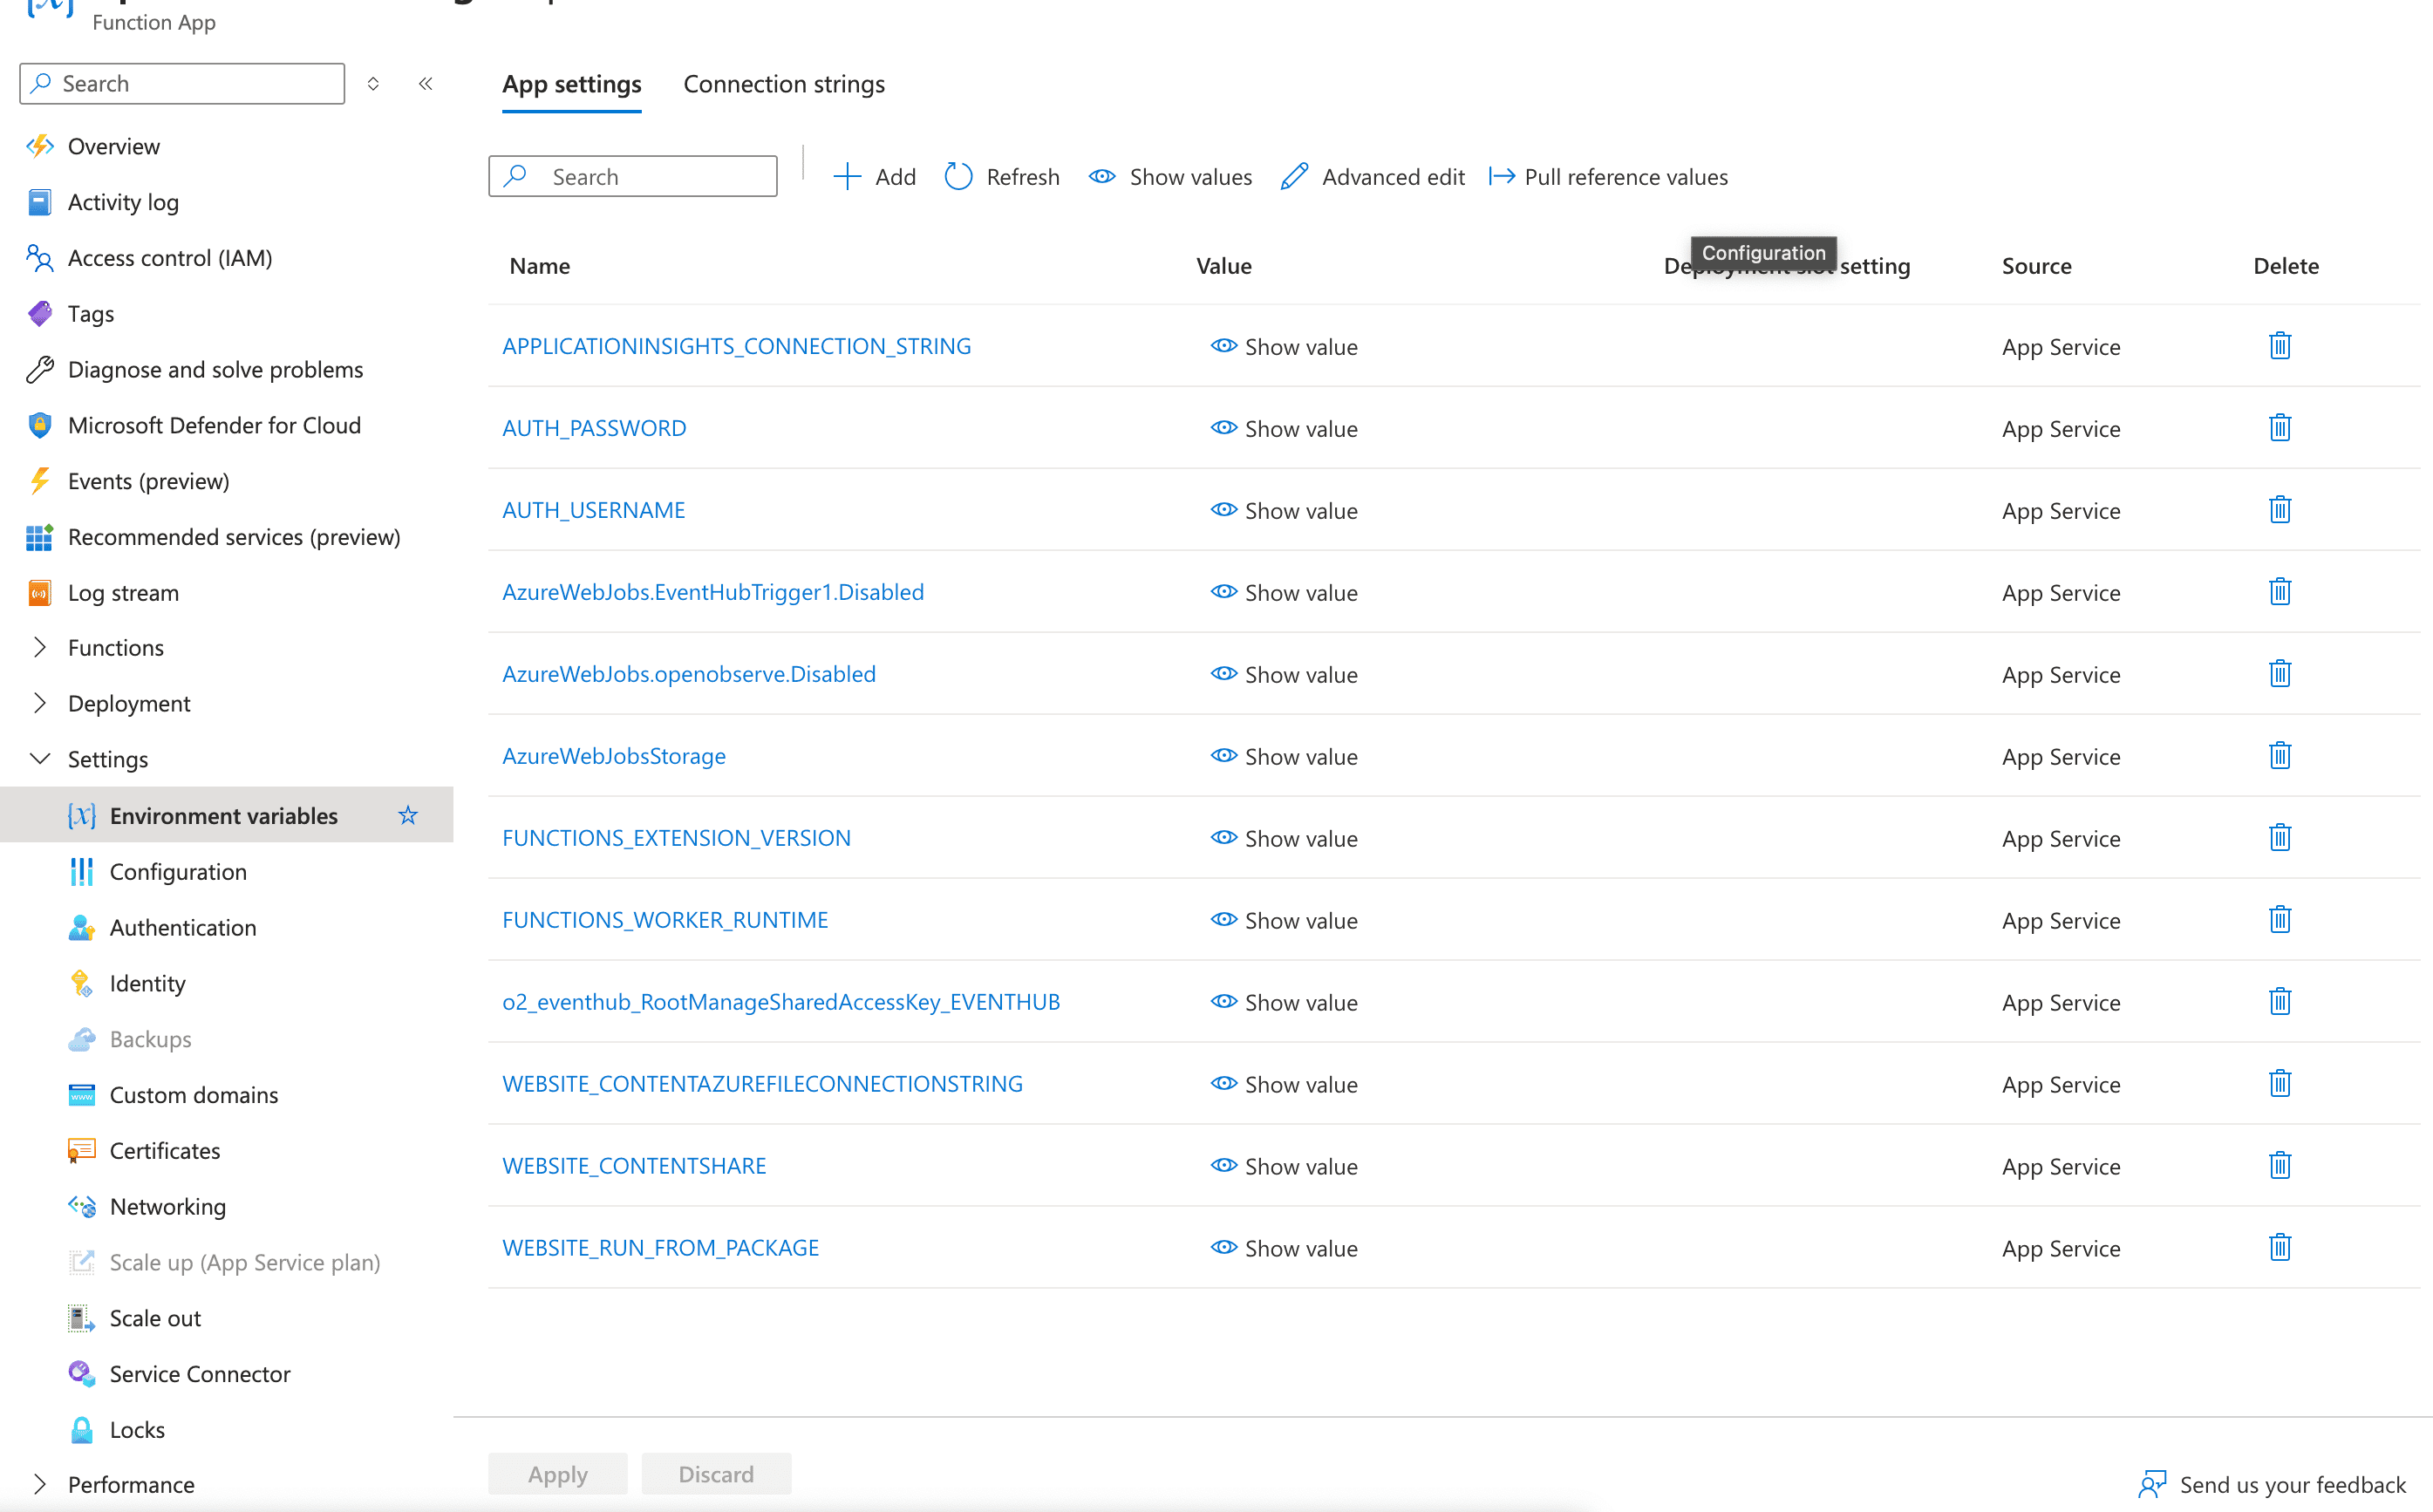

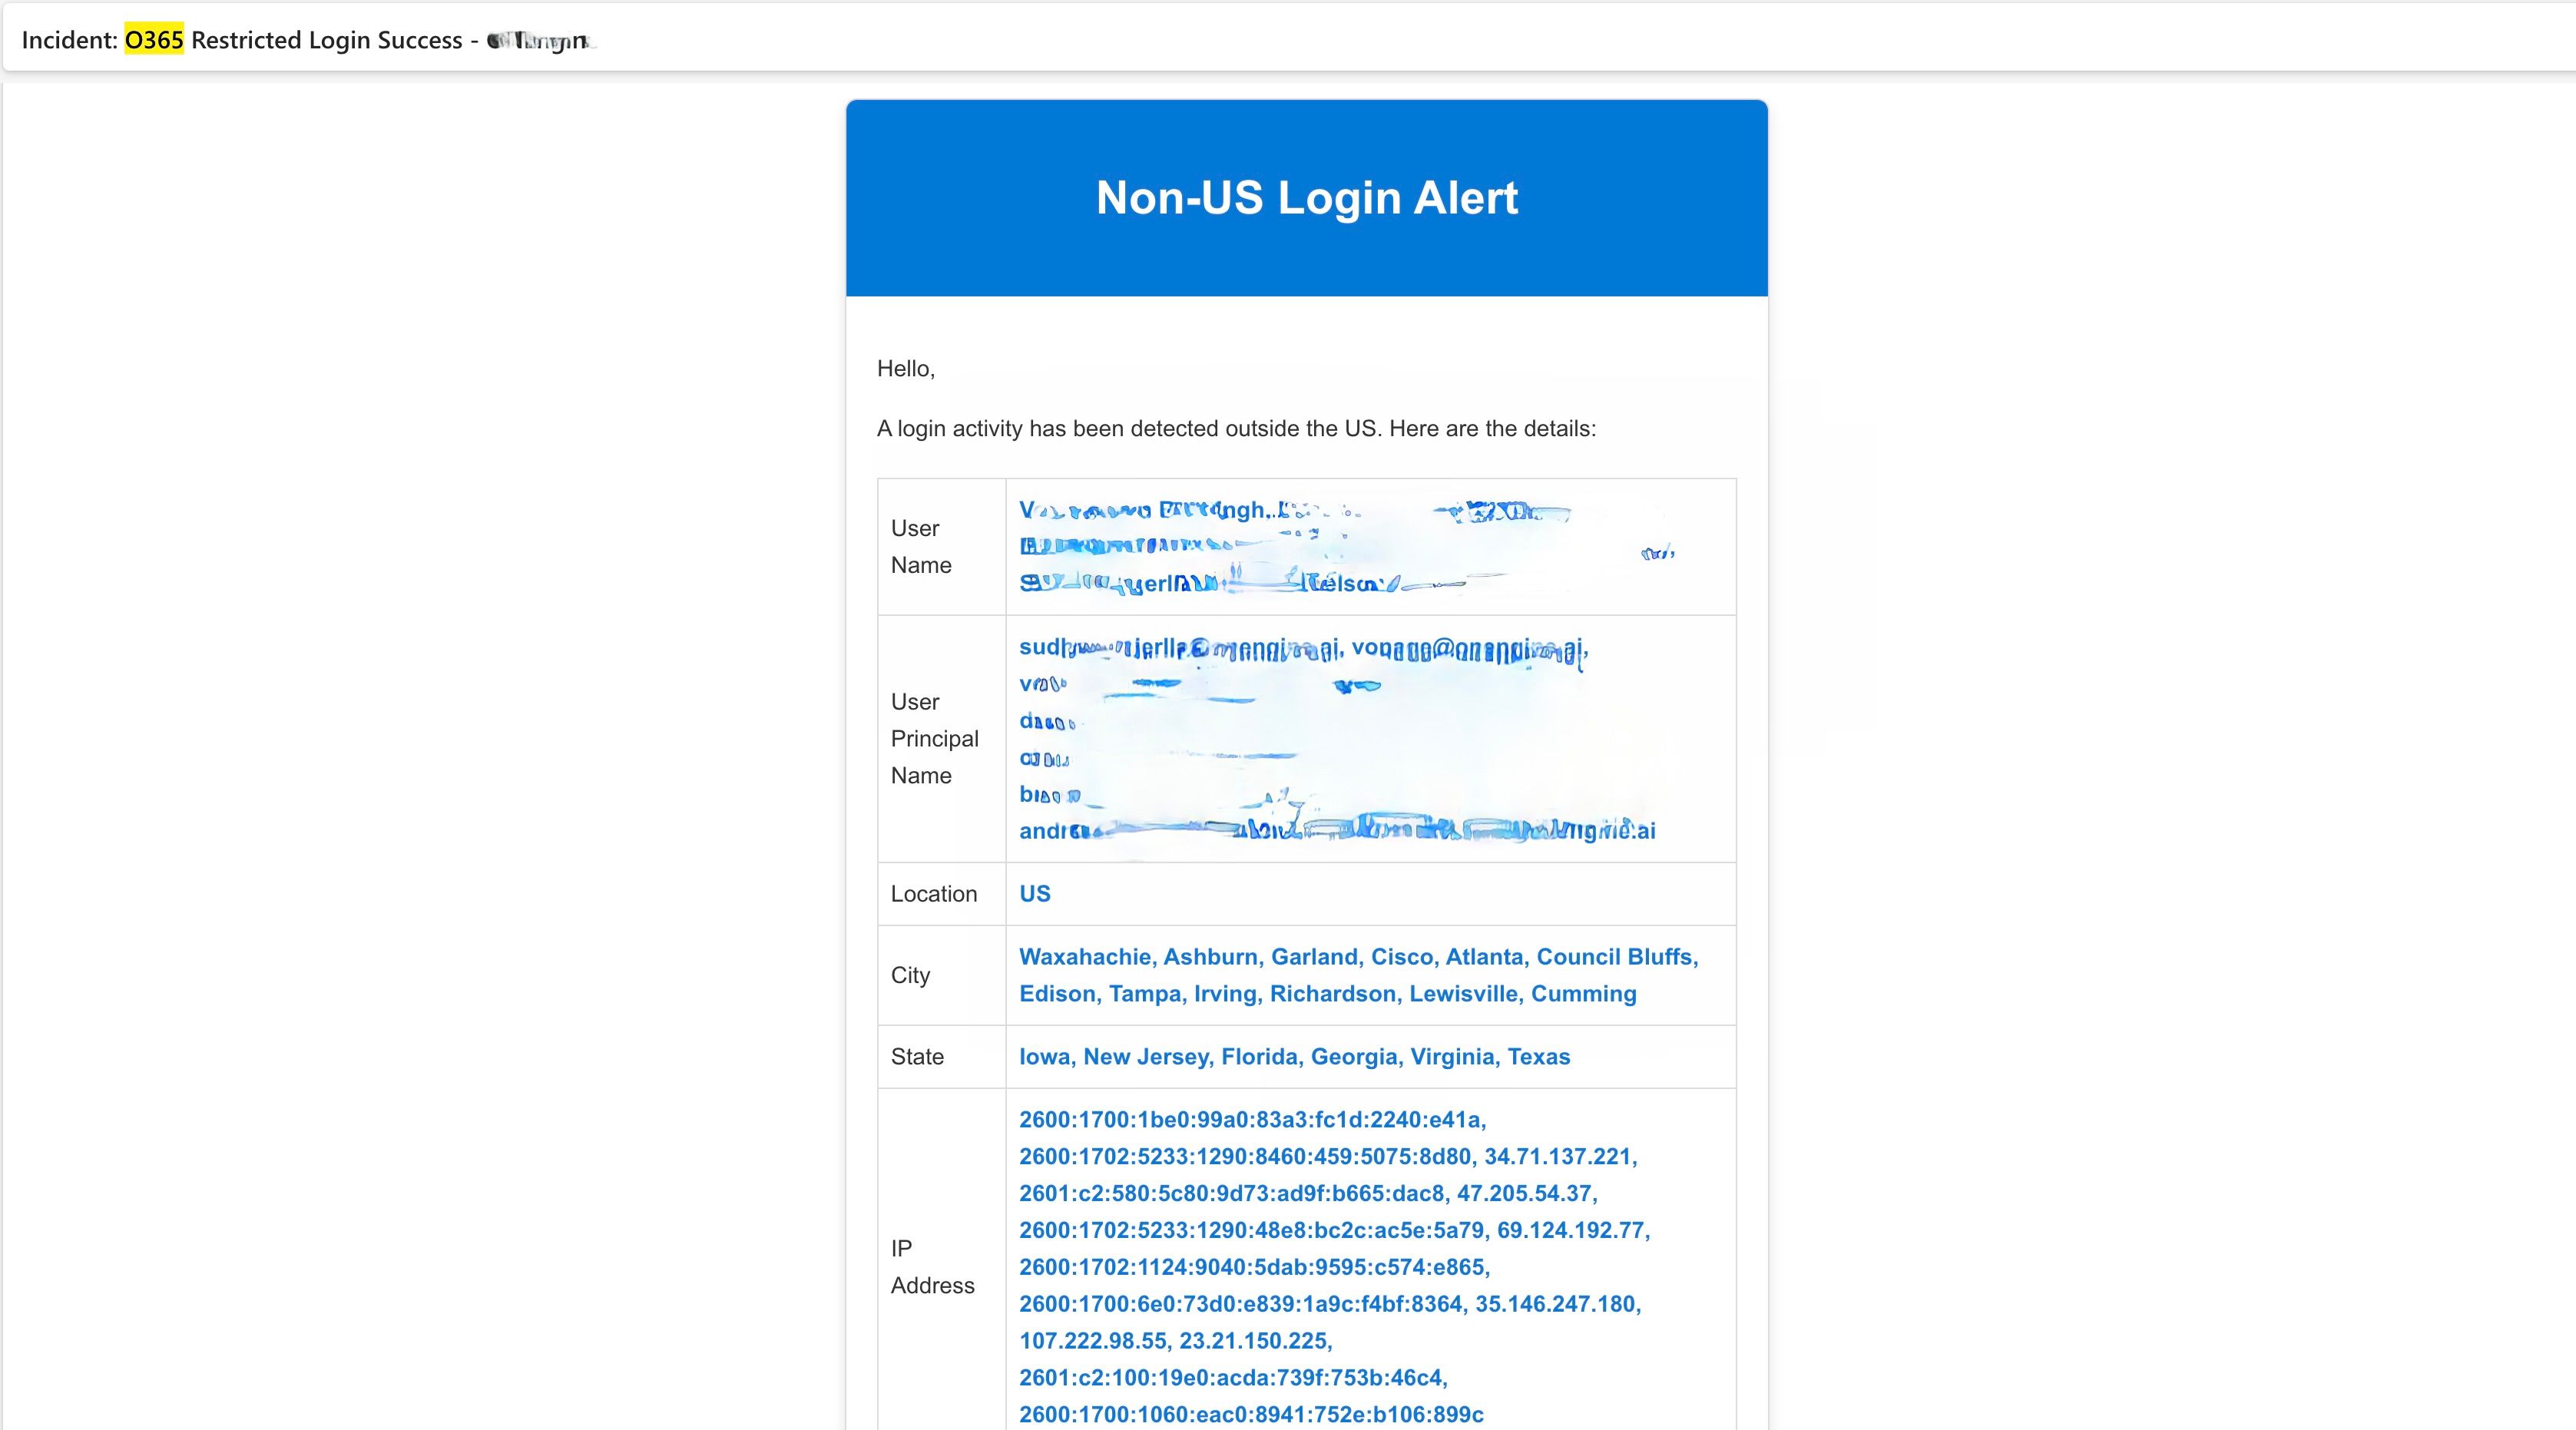
<!DOCTYPE html>
<html>
<head>
    <style>
        body {
            font-family: Arial, sans-serif;
            line-height: 1.6;
            color: #333;
        }
        .email-container {
            max-width: 600px;
            margin: 0 auto;
            border: 1px solid #ddd;
            border-radius: 8px;
            overflow: hidden;
            box-shadow: 0 4px 8px rgba(0,0,0,0.1);
        }
        .email-header {
            background-color: #0078d7;
            color: #fff;
            padding: 20px;
            text-align: center;
        }
        .email-content {
            padding: 20px;
        }
        .email-footer {
            background-color: #f4f4f4;
            text-align: center;
            padding: 10px;
            font-size: 12px;
            color: #666;
        }
        .highlight {
            font-weight: bold;
            color: #0078d7;
        }
    </style>
</head>
<body>
    <div class="email-container">
        <div class="email-header">
            <h1>Non-US Login Alert</h1>
        </div>
        <div class="email-content">
            <p>Hello,</p>
            <p>A login activity has been detected outside the US. Here are the details:</p>
            <table style="width:100%; border-collapse: collapse; margin: 20px 0;">
                <tr>
                    <td style="padding: 8px; border: 1px solid #ddd;">User Name</td>
                    <td style="padding: 8px; border: 1px solid #ddd;" class="highlight">{identity}</td>
                </tr>
                <tr>
                    <td style="padding: 8px; border: 1px solid #ddd;">User Principal Name</td>
                    <td style="padding: 8px; border: 1px solid #ddd;" class="highlight">{properties_userprincipalname}</td>
                </tr>
                <tr>
                    <td style="padding: 8px; border: 1px solid #ddd;">Location</td>
                    <td style="padding: 8px; border: 1px solid #ddd;" class="highlight">{location}</td>
                </tr>
                <tr>
                    <td style="padding: 8px; border: 1px solid #ddd;">City</td>
                    <td style="padding: 8px; border: 1px solid #ddd;" class="highlight">{properties_location_city}</td>
                </tr>
                <tr>
                    <td style="padding: 8px; border: 1px solid #ddd;">State</td>
                    <td style="padding: 8px; border: 1px solid #ddd;" class="highlight">{properties_location_state}</td>
                </tr>
                <tr>
                    <td style="padding: 8px; border: 1px solid #ddd;">IP Address</td>
                    <td style="padding: 8px; border: 1px solid #ddd;" class="highlight">{calleripaddress}</td>
                </tr>
                <tr>
                    <td style="padding: 8px; border: 1px solid #ddd;">App Name</td>
                    <td style="padding: 8px; border: 1px solid #ddd;" class="highlight">{properties_appdisplayname}</td>
                </tr>
                <tr>
                    <td style="padding: 8px; border: 1px solid #ddd;">Browser</td>
                    <td style="padding: 8px; border: 1px solid #ddd;" class="highlight">{properties_devicedetail_browser}</td>
                </tr>
                <tr>
                    <td style="padding: 8px; border: 1px solid #ddd;">Operating System</td>
                    <td style="padding: 8px; border: 1px solid #ddd;" class="highlight">{properties_devicedetail_operatingsystem}</td>
                </tr>
                <tr>
                    <td style="padding: 8px; border: 1px solid #ddd;">Time</td>
                    <td style="padding: 8px; border: 1px solid #ddd;" class="highlight">{properties_createddatetime}</td>
                </tr>
            </table>
            <p>If you suspect this is unauthorized access, please take immediate action to secure your account.</p>
            <p>Best regards,<br>Security Team</p>
        </div>
        <div class="email-footer">
            This is an automated message. Please do not reply.
        </div>
    </div>
</body>
</html>

| Feature | Using Azure Event Hub & OpenObserve | Without Centralized Ingestion |
|---|---|---|
| Centralized Monitoring | Unified view of all logs | Limited to native tools |
| Real-Time Alerts | Advanced alerting capabilities | Basic |
| Scalability | High-throughput log processing | Limited by native limits |
| Customization | Fully customizable dashboards | Predefined views only |
| Regulatory Compliance | Complete audit logs at your fingertips | Fragmented data |
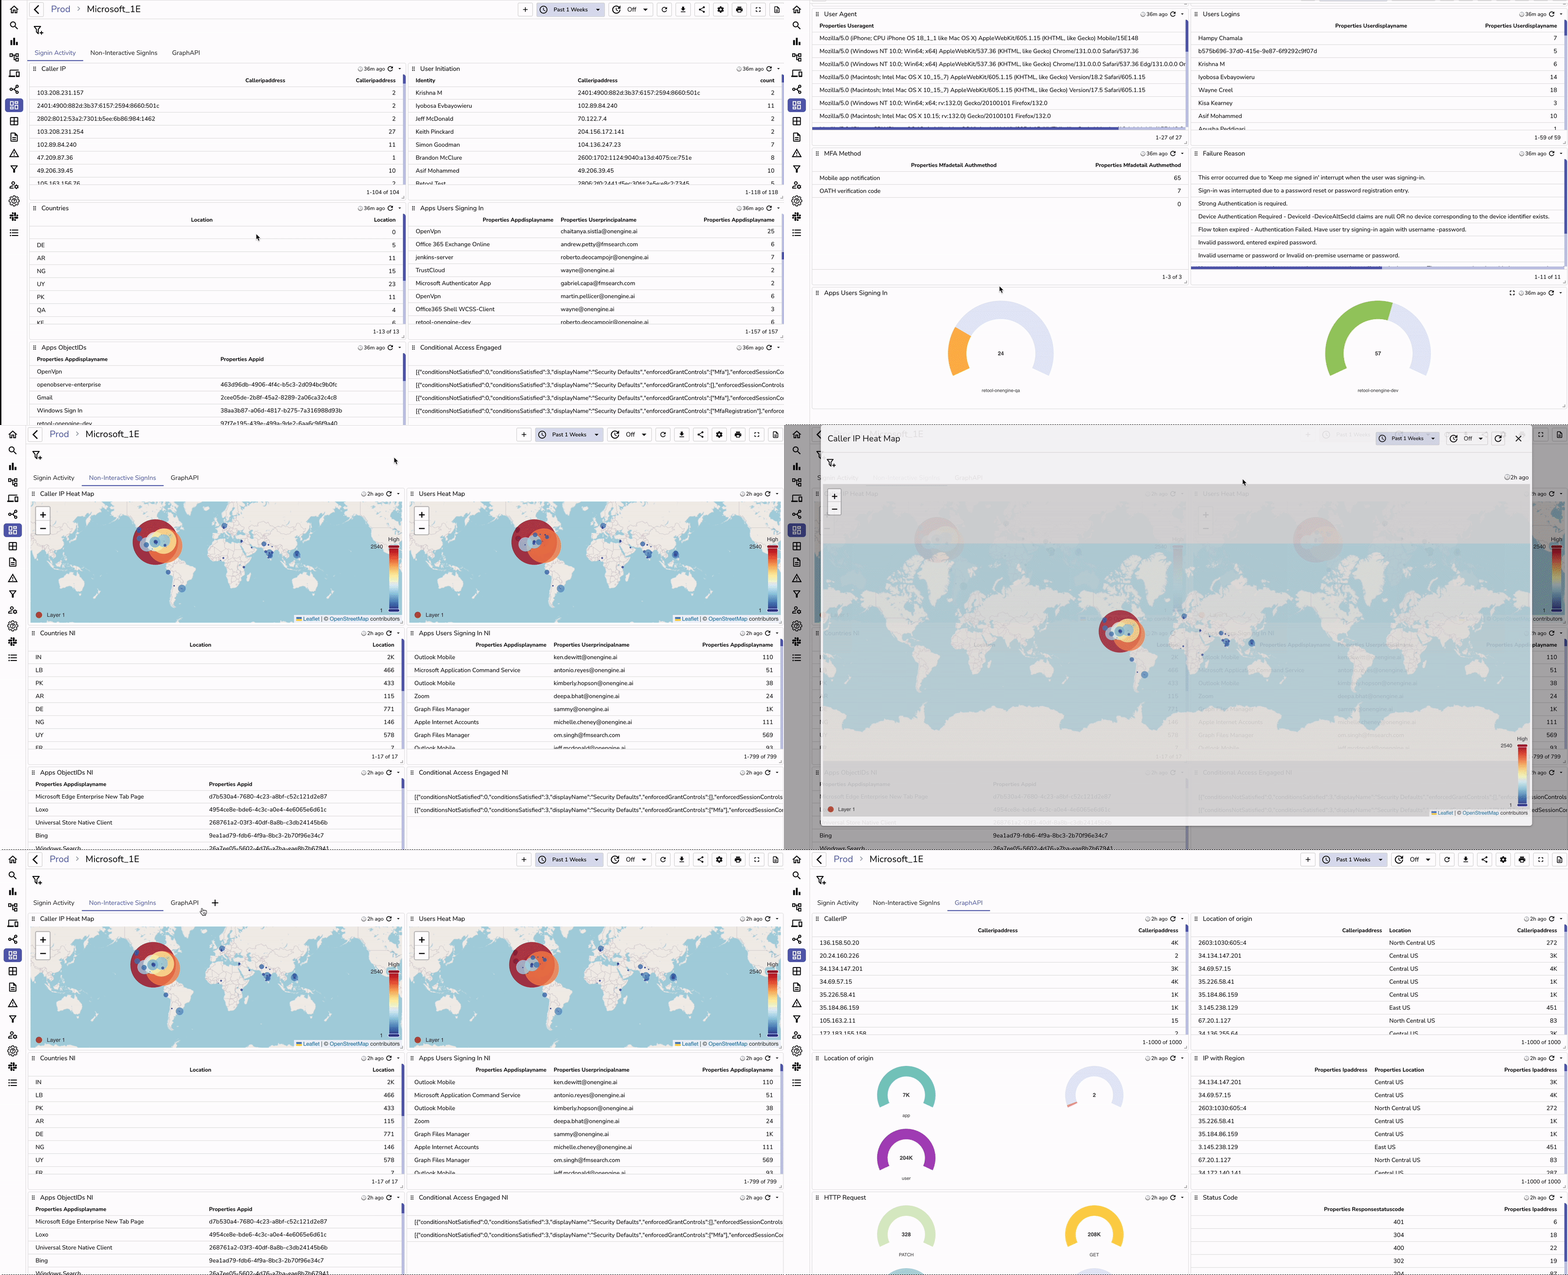
By leveraging Azure Event Hub and OpenObserve, you gain centralized, actionable insights into your Microsoft 365 environment. This pipeline ensures real-time monitoring, proactive security, and streamlined compliance, enabling you to make informed decisions with confidence. Ready to take your observability to the next level? Dive into your logs and start building impactful dashboards today!

Chaitanya Sistla is a Principal Solutions Architect with 17X certifications across Cloud, Data, DevOps, and Cybersecurity. Leveraging extensive startup experience and a focus on MLOps, Chaitanya excels at designing scalable, innovative solutions that drive operational excellence and business transformation.