A Complete Guide on How to Stream and Analyze AWS CloudWatch Logs Using Amazon Kinesis Firehose


Try OpenObserve Cloud today for more efficient and performant observability.

AWS CloudWatch Logs are essential for monitoring your cloud infrastructure, but streaming and analyzing them efficiently can be a challenge. Amazon Kinesis Firehose simplifies the process by allowing you to easily stream CloudWatch logs to various destinations for deeper analysis. In this guide, we'll walk you through how to run a Python script to send dummy logs to AWS CloudWatch, stream them to Amazon Kinesis Firehose using a subscription filter, and then send the logs to OpenObserve with S3 as storage for enhanced log management and actionable insights.
In this blog, we will cover:
AWS CloudWatch Logs is a service that collects and stores logs from AWS resources and applications. It serves as the default destination for logs from many AWS services, helping you monitor, search, and analyze log data to gain insights, troubleshoot issues and maintain visibility into your AWS environment.
Amazon Kinesis Firehose is a fully managed service designed to deliver real-time streaming data to various destinations, such as data lakes, analytics services, and custom HTTP endpoints. By integrating CloudWatch Logs with Firehose, you can stream logs seamlessly to tools like OpenObserve or other destinations, enabling real-time monitoring, analysis, and storage of log data.
Amazon S3 (Simple Storage Service) is an object storage service that provides highly scalable, durable, and low-latency storage for data, such as backups, archives, and application data. It is designed to store and retrieve any amount of data from anywhere on the web.
OpenObserve is an open-source full stack observability platform designed to capture, store, and analyze logs, metrics, and traces for monitoring and troubleshooting applications and infrastructure in real-time. It helps teams improve performance, reliability, and troubleshooting efficiency by providing centralized observability data.
In this section, we will install and configure OpenObserve (O2) to use S3 as its storage backend. Follow these steps:
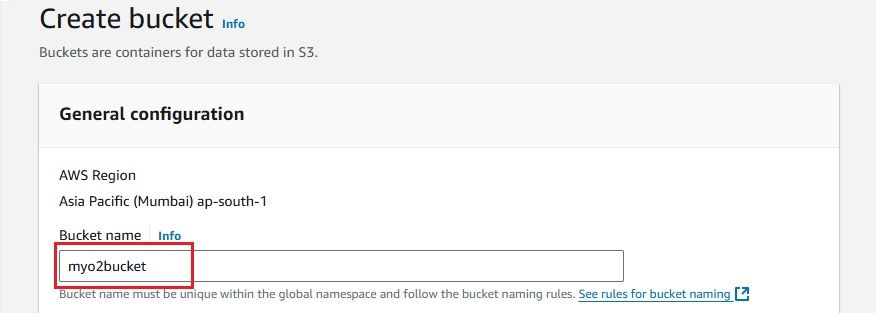
Create an S3 bucket in AWS where OpenObserve will store its logs. Here are the basic steps to create an S3 bucket:



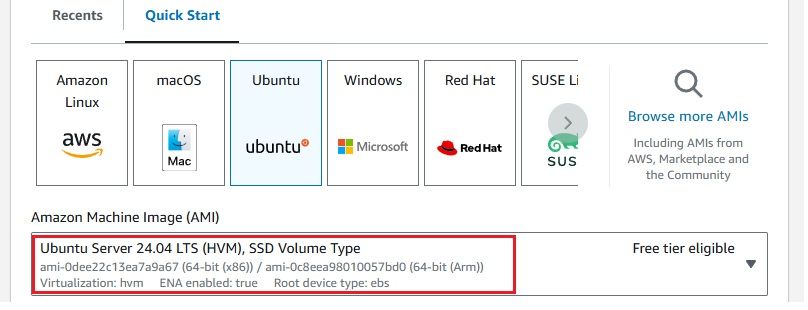
An EC2 instance is required to host OpenObserve for its installation and configuration. To launch an EC2 instance, follow these steps:




 Once the instance is launched, you should see it listed in your EC2 dashboard.

Once your EC2 instance is running, you can connect to it via SSH and execute the command to install and configure OpenObserve. Here are the steps:
ssh -i <your-key-pair.pem> ubuntu@<your-ec2-public-ip>
Replace <your-key-pair.pem> with your SSH key file and
ZO_ROOT_USER_EMAIL="root@example.com" \
ZO_ROOT_USER_PASSWORD="Complexpass#123" \
ZO_LOCAL_MODE_STORAGE="s3" \
ZO_S3_ACCESS_KEY="AWS Access Key ID" \
ZO_S3_SECRET_KEY="Secret Access Key" \
ZO_S3_REGION_NAME="ap-south-1" \
ZO_S3_BUCKET_NAME="myo2bucket" \
ZO_S3_PROVIDER="aws" \
./openobserve
This will start the OpenObserve instance with S3 as the storage backend, using your specified AWS credentials.
Note: If you do not wish to expose your AWS Access Key ID and Secret Access Key, it's recommended to attach an IAM role to your EC2 instance with the necessary permissions (e.g., AmazonS3FullAccess or an admin role). This will allow OpenObserve to access S3 securely without hard-coding credentials.

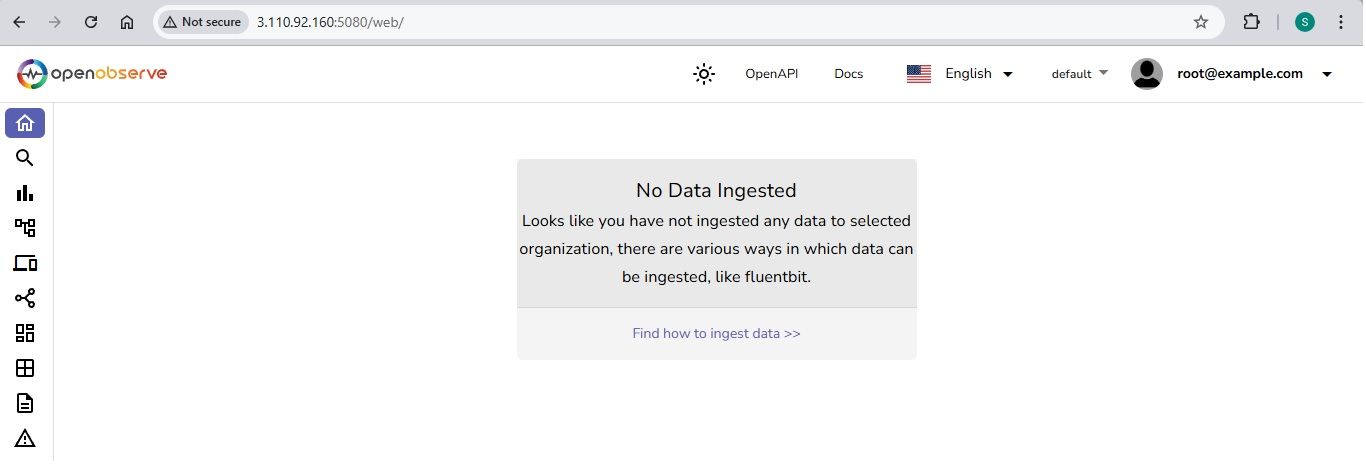
After running the OpenObserve command, you need to verify that the OpenObserve UI is accessible. Follow these steps:

You can test the setup by sending test log data to OpenObserve using a curl command. Follow these steps:
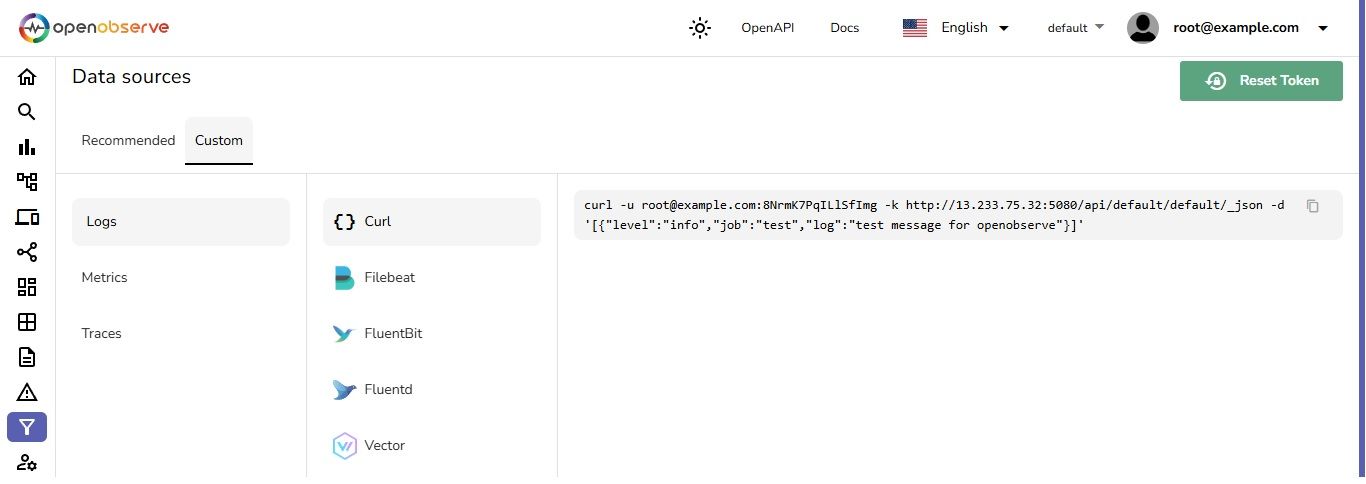


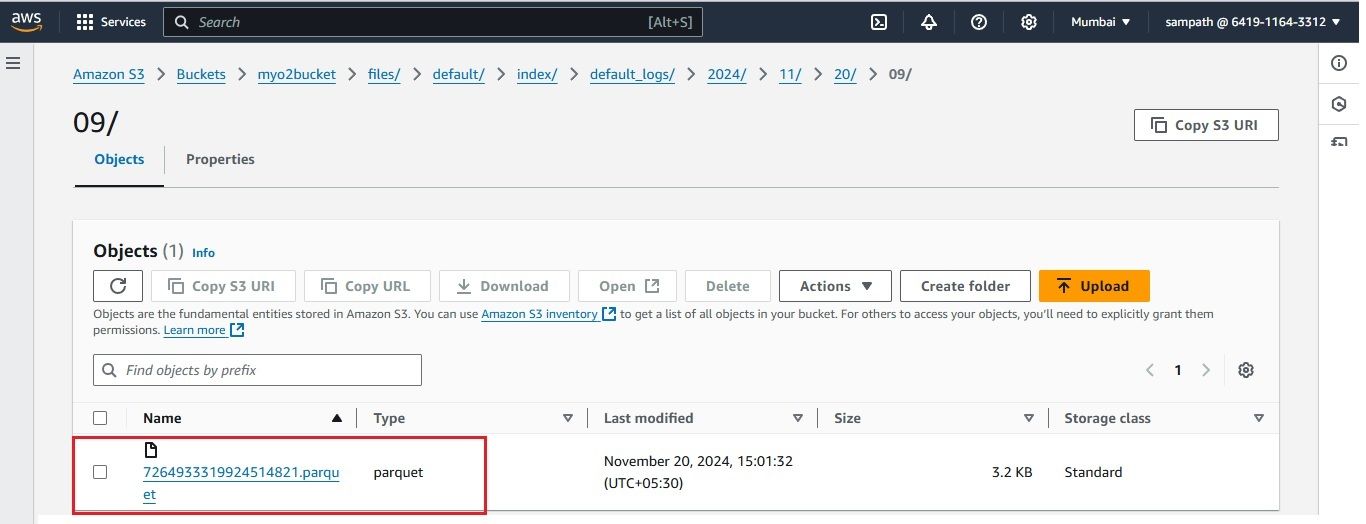
This confirms that OpenObserve is successfully ingesting logs and storing them in the S3 bucket, which it uses as its storage.
As we plan to send log data to OpenObserve using a Kinesis Firehose stream with the Direct PUT method, we need to provide a secure HTTPS endpoint for OpenObserve. Firehose only accepts HTTPS endpoints.
Since our OpenObserve instance is currently running on HTTP, we need to secure it to meet this requirement. To achieve this, we will set up an Application Load Balancer (ALB) in front of OpenObserve and assign it a certificate using AWS Certificate Manager (ACM).
This section will guide you through:
To secure your ALB with HTTPS, you need to request a TLS certificate in AWS ACM. Follow these steps:


To securely forward HTTPS traffic to OpenObserve, we need to set up an Application Load Balancer (ALB) using a self-signed certificate. This will enable OpenObserve to receive data over HTTPS from Kinesis Firehose.
Follow these steps to setup and configure the ALB:

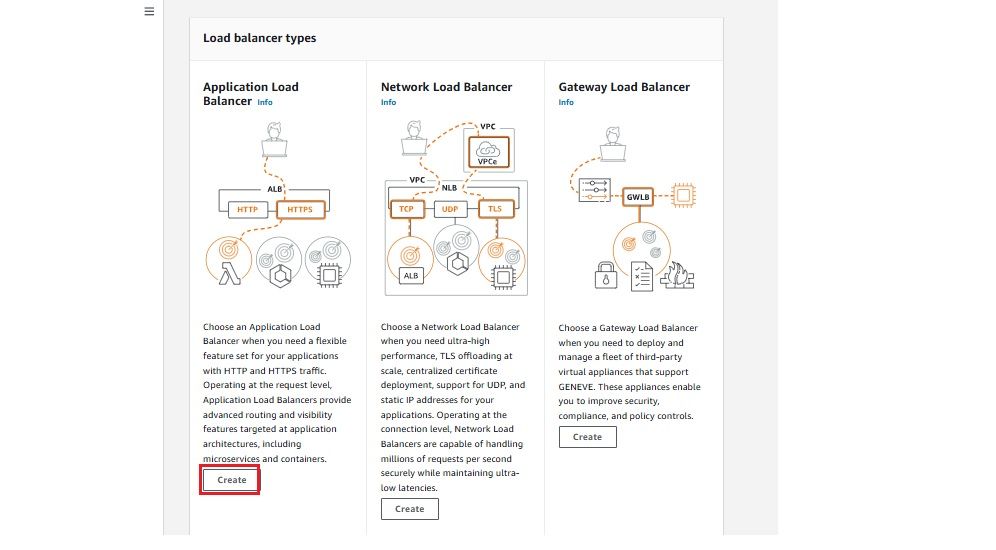
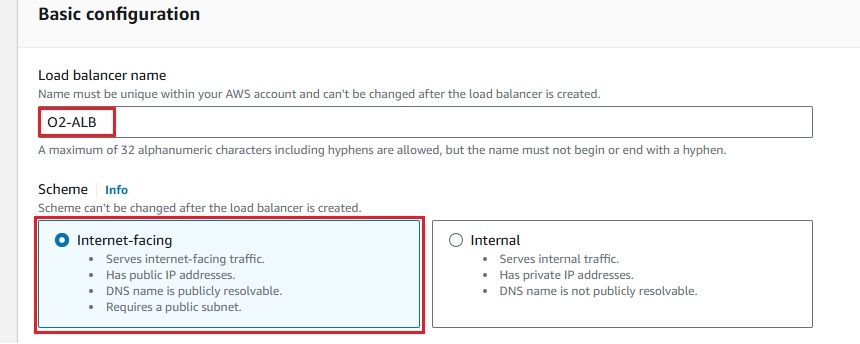

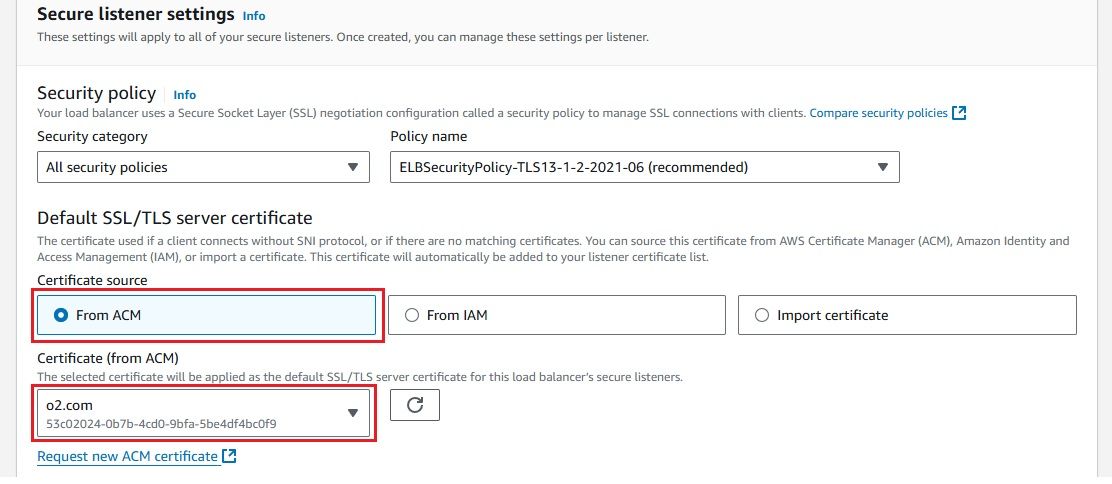


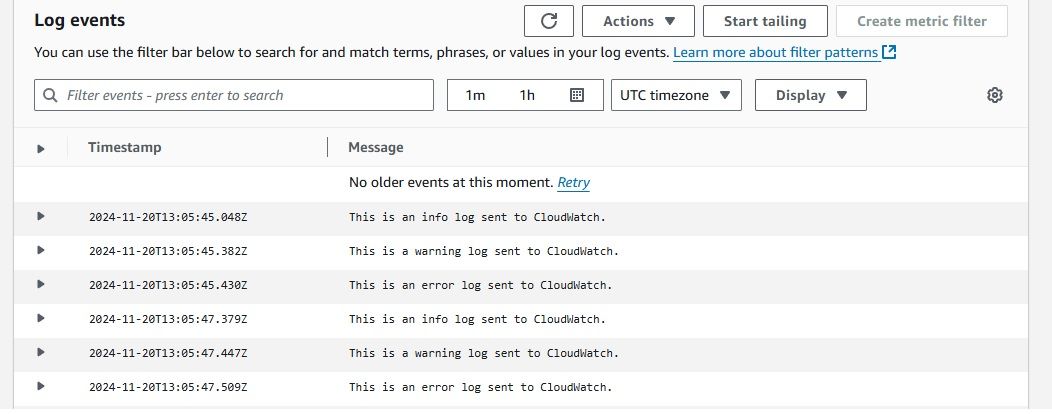
To get started, you need to send logs to CloudWatch. Below is a Python script to push sample logs to CloudWatch log group.
import boto3
import logging
import watchtower

# Replace with your AWS region
region_name = 'ap-south-1'

# Create a CloudWatch client if needed
cloudwatch_client = boto3.client('logs', region_name=region_name)

# Replace with your log group name
log_group = 'my-log-group'

# Configure logging
logging.basicConfig(level=logging.INFO)
logger = logging.getLogger(__name__)

# Add CloudWatch as a logging handler
logger.addHandler(
    watchtower.CloudWatchLogHandler(
        log_group=log_group,
        stream_name='my-log-stream',  # Replace with your log stream name
        use_queues=False  # Optional: helps with immediate log transmission
    )
)

# Log messages to CloudWatch
logger.info("This is an info log sent to CloudWatch.")
logger.warning("This is a warning log sent to CloudWatch.")
logger.error("This is an error log sent to CloudWatch.")
The above script sends Python log messages (INFO, WARNING, ERROR) to AWS CloudWatch by configuring the logging system with a CloudWatch log handler using boto3 and watchtower.
Save the Python script: Save the code to a Python file, e.g., cloudwatch_logging.py.
To run this code, make sure you have the required Python libraries installed and AWS credentials configured. Here's how you can do it: Install the required libraries:
pip install boto3 watchtower
Ensure AWS credentials are set up: Make sure your AWS credentials are configured using the AWS CLI or environment variables (AWS_ACCESS_KEY_ID and AWS_SECRET_ACCESS_KEY).
 Run the script:
python cloudwatch_logging.py
 This will execute the script and send the log messages to AWS CloudWatch.

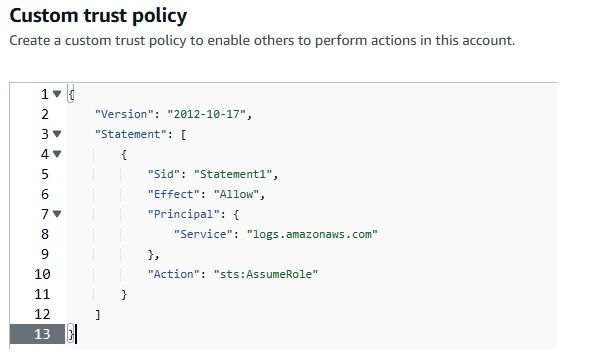
A Kinesis Firehose Delivery Stream is needed to stream real-time data from CloudWatch Logs to destinations like OpenObserve. It ensures reliable data delivery and backup. Here's how to create one:


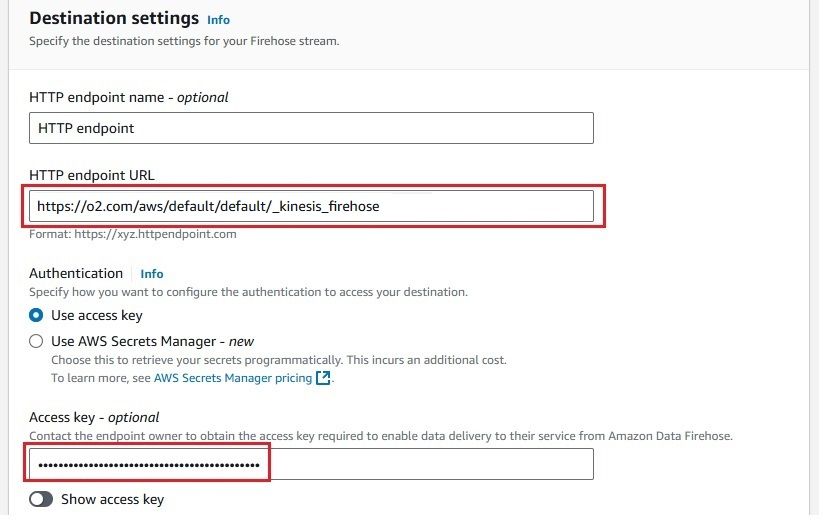


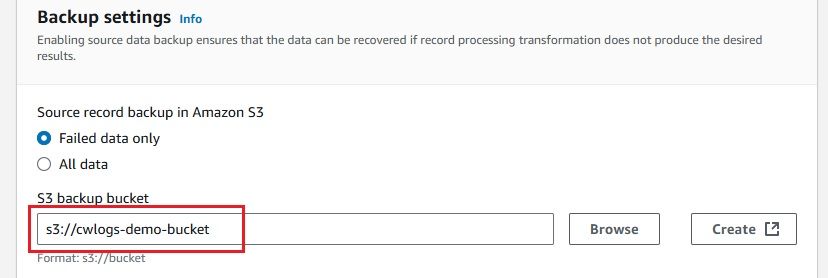
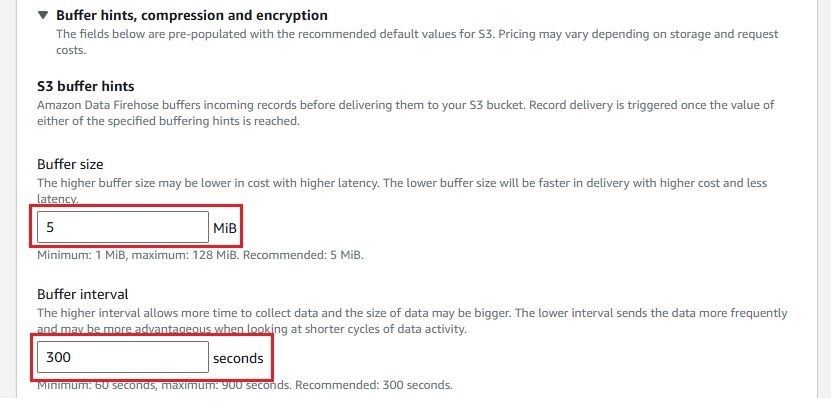
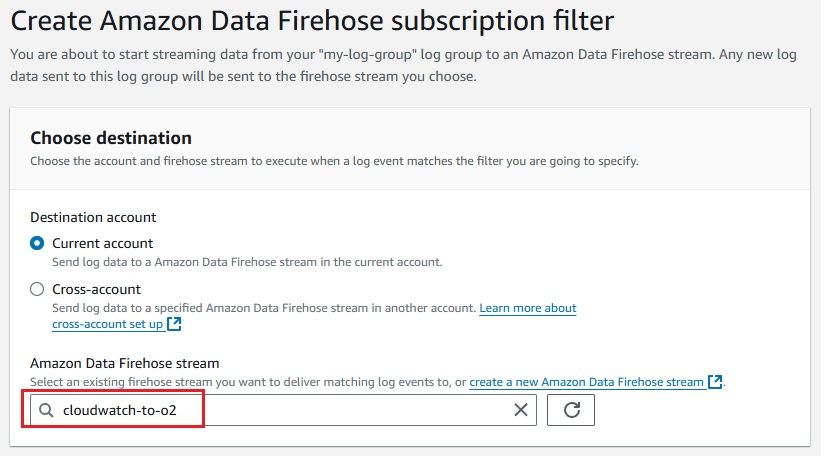
 Once completed, you will see a Firehose stream named cloudwatch-to-o2 created.

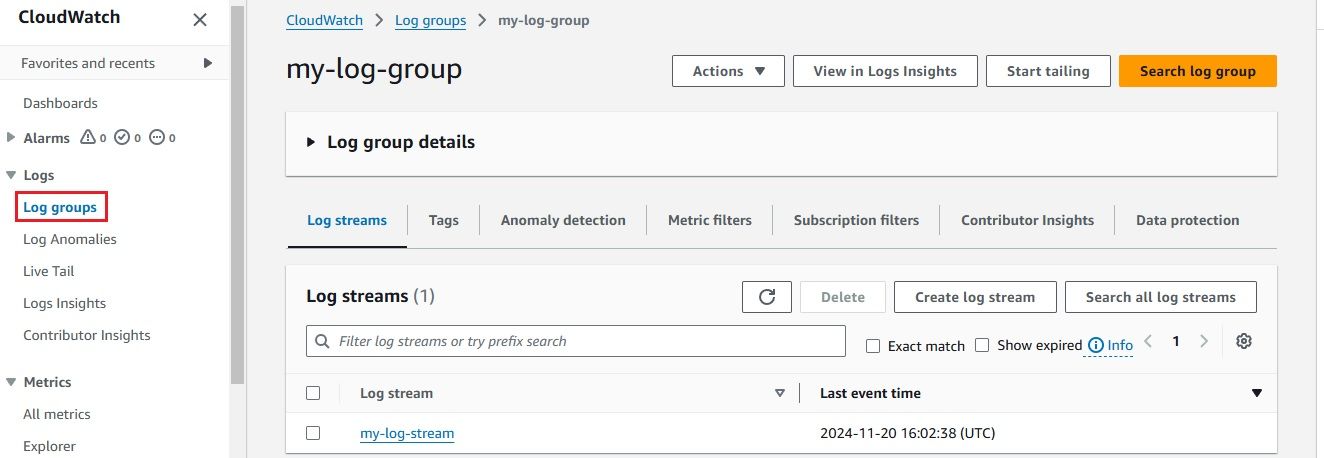
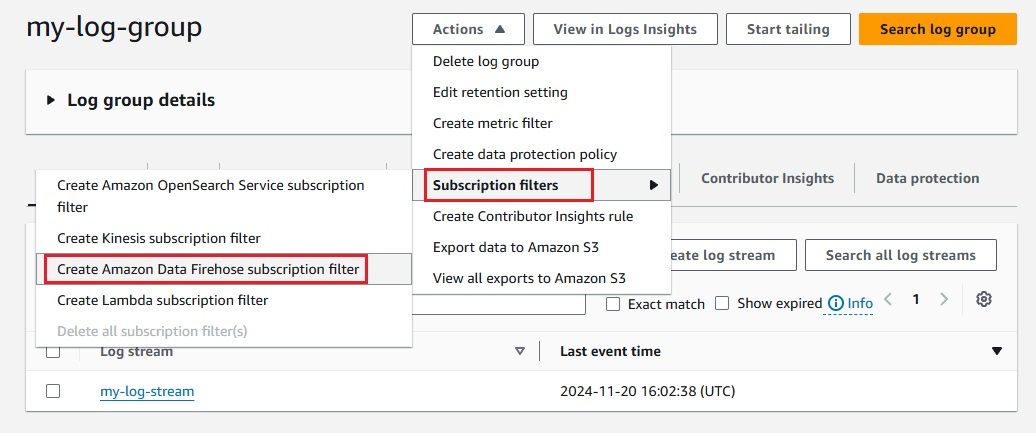
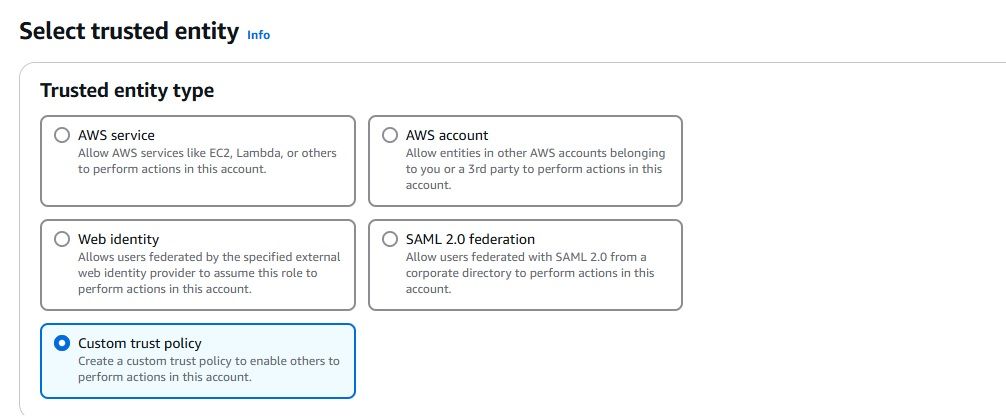
To stream logs from AWS CloudWatch to Amazon Kinesis Firehose efficiently, you need to set up a subscription filter. A subscription filter allows you to define which logs are streamed and how they are delivered to the Kinesis Firehose delivery stream. Here's a detailed guide to setting up an AWS Kinesis Firehose subscription filter:




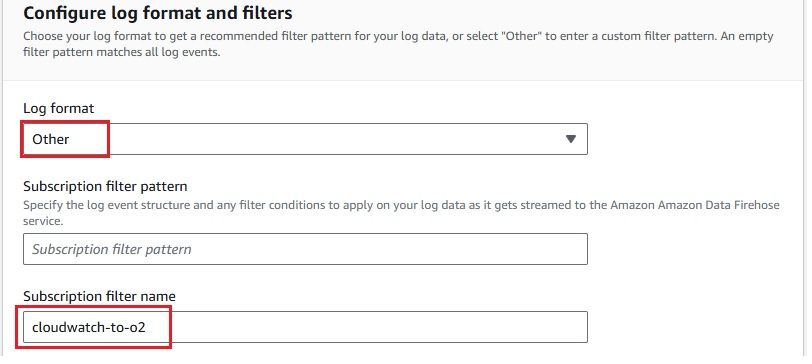
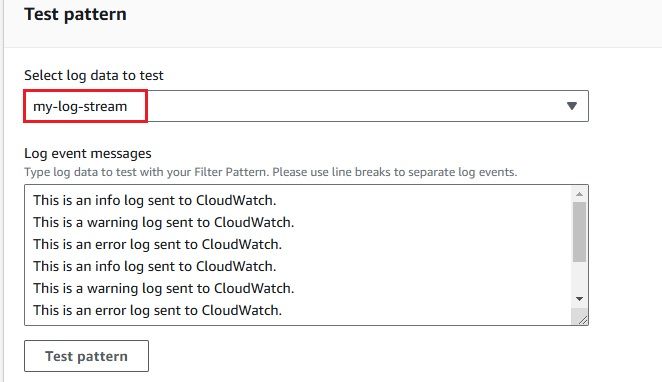


As we have set up the integration between AWS CloudWatch Logs and Kinesis Firehose, it’s time to check whether the logs are successfully flowing into OpenObserve.This step is crucial to ensure that your log data is being ingested and processed correctly.
From the OpenObserve home page, we can see that logs in one stream has been ingested
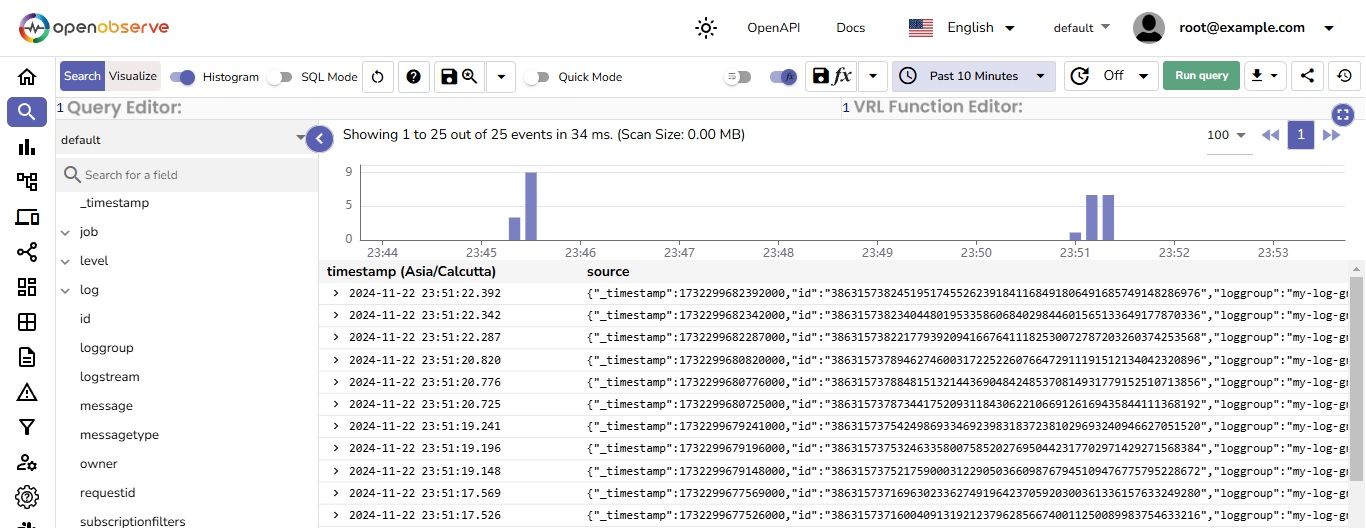 Click on any record to see the details of that specific log

Now that your logs are flowing into OpenObserve, it’s time to visualize the data and make it actionable.
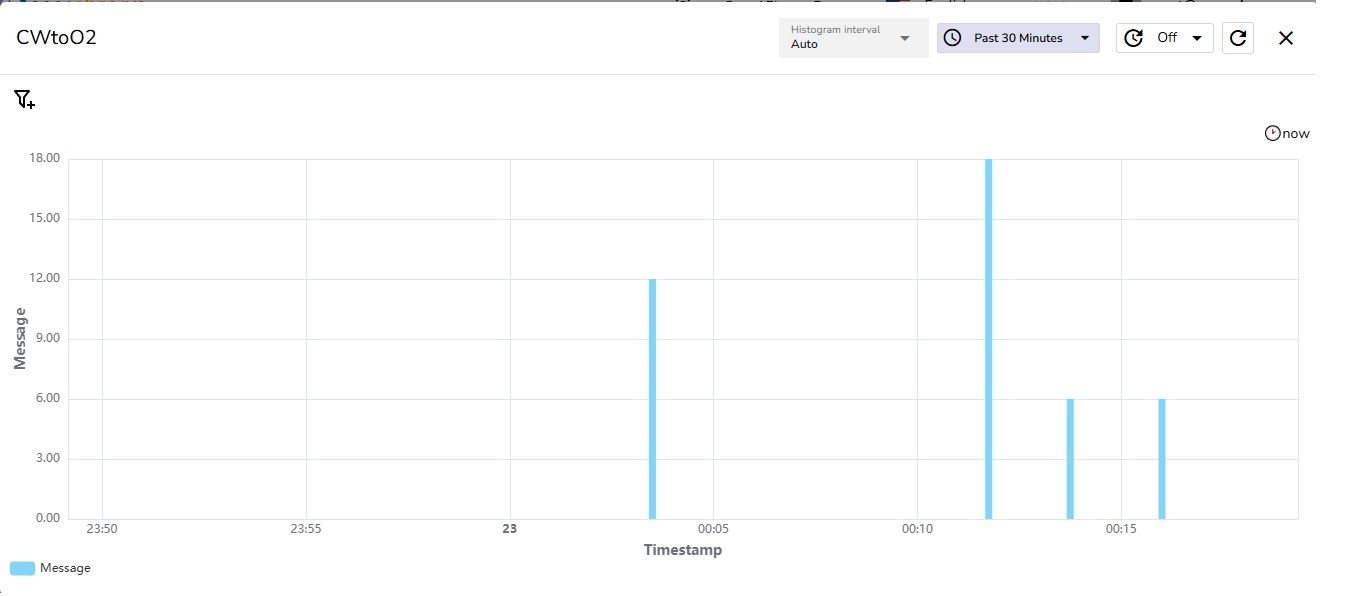
This dashboard visualizes log data streamed from CloudWatch to OpenObserve (CWtoO2). The histogram shows the number of log messages over the past 30 minutes, with timestamps on the X-axis and message count on the Y-axis. It helps monitor real-time log activity, detect spikes, and analyze trends for troubleshooting and performance insights.
| Feature | OpenObserve (O2) | AWS CloudWatch |
|---|---|---|
| Deployment Flexibility | Self-hosted on-prem, edge, or cloud for low-latency | cloud-based, AWS-centric |
| Customization & Control | Full control and customization available | Limited customization, AWS-bound |
| Cost Efficiency | Open-source, cost-effective, scalable | Costs scale quickly with data volume |
| Edge Support | Supports true edge deployments | Limited to AWS-specific edge services |
| Open-Source Ecosystem | Integrates with open-source tools (e.g., Prometheus) | Constrained to AWS integrations |
| Data Ownership | Full data control in self-hosted setups | Data stored in AWS, potential privacy concerns |
| UI & Querying Capabilities | Much better UI and querying capabilities | Standard UI and querying capabilities |
Integrating AWS CloudWatch Logs with Kinesis Firehose and OpenObserve streamlines log management by centralizing log data, enabling real-time monitoring, and providing powerful log analysis. This setup ensures quick issue detection and efficient troubleshooting. With OpenObserve, you can visualize trends, monitor performance, and scale as your log volume grows. It makes managing logs more efficient, improving overall application health and operational insights.