Understanding JSON Logging and Analysis

Manas Sharma
November 18, 2024
8 min read
Don’t forget to share!
Try OpenObserve Cloud today for more efficient and performant observability.
Logs are crucial for understanding application performance, debugging, and system health. Traditional log formats often lack structure, making data extraction challenging.
JSON logging solves this by providing a structured, machine-readable, and human-friendly format. Its simplicity and language-agnostic nature make it ideal for logging.
Many teams have switched to JSON logging for its clarity. Let's dive into what makes JSON logging stand out, its benefits and how to implement and analyze JSON logs effectively.
JSON logging refers to the practice of recording log entries in the structured format of JavaScript Object Notation (JSON). This approach contrasts sharply with traditional logging methods, which often produce plain text logs that can be difficult to interpret and analyze. By organizing log data into key-value pairs, JSON logging enhances both human readability and machine parsability, making it a preferred choice for modern applications that require real-time analysis and observability.
JSON is a lightweight data interchange format designed for simplicity and flexibility. It was originally derived from JavaScript but has since become a universal standard across various programming languages. The format represents data as structured objects, using curly braces to encapsulate key-value pairs. A typical JSON object look like this:
{
  "level": "info",
  "timestamp": "2024-09-25T15:34:56Z",
  "message": "User accessed the dashboard",
  "user": "Liam",
  "action": "access_dashboard"
}
To understand the difference between traditional log formats and JSON logging, let's compare log entries from an NGINX server.
In a traditional NGINX access log, an entry might look like this:
172.17.0.1 - - [06/Aug/2024:16:37:59 +0000] "GET /index.html HTTP/1.1" 200 615 "-" "Mozilla/5.0 (X11; Linux x86_64; rv:128.0) Gecko/20100101 Firefox/128.0"
While this log contains useful information such as the client IP address, request method, URI, response status code, and user agent, it is unstructured and can be challenging to parse or filter programmatically. Each piece of information is separated by spaces, making automated analysis cumbersome.
Now, let's convert this traditional log entry into a structured JSON format:
{
  "remote_addr": "172.17.0.1",
  "timestamp": "2024-08-06T16:37:59Z",
  "request": {
    "method": "GET",
    "uri": "/index.html",
    "protocol": "HTTP/1.1"
  },
  "status": 200,
  "bytes_sent": 615,
  "http_referer": "-",
  "http_user_agent": "Mozilla/5.0 (X11; Linux x86_64; rv:128.0) Gecko/20100101 Firefox/128.0"
}
With the JSON format, it’s easy for someone unfamiliar with web server logs to understand what the message contains, as each field is labeled. With a common log format, you need to know what you’re looking at.
The transition to JSON logging offers several significant advantages over traditional logging formats:
Human and Machine Readability: The structured nature of JSON logs makes them easy to read and interpret. Each log entry can convey complex information clearly, allowing engineers to quickly grasp the context without extensive parsing logic.
Flexibility in Data Representation: JSON supports various data types, including strings, numbers, arrays, and nested objects. This versatility allows developers to capture detailed contextual information in their logs without compromising the structure.
Ease of Integration with Tools: Many modern log management and analysis tools are designed to work seamlessly with JSON-formatted logs. This compatibility facilitates automated processing, querying, and visualization of log data.
Resilience to Schema Changes: As applications evolve, the ability to add or modify fields in JSON logs without disrupting existing processes is invaluable. This adaptability ensures that logging systems remain effective even as requirements change.
When it comes to JSON logging, following best practices can make a world of difference in how effectively you can analyze and utilize your logs.
Consistency is key! Just like you wouldn’t wear mismatched socks to a formal event, your logs shouldn’t be mismatched either. Ensure that your JSON logs follow a uniform schema across different services or components. This makes querying and processing a breeze.
Example: If you log user actions, stick to a structure like this:
{
  "timestamp": "2024-11-10T12:00:00Z",
  "user_id": "1234",
  "action": "login",
  "status": "success"
}
A consistent schema helps avoid confusion when analyzing logs later.
When logging numerical data, specify the units in the field names. This practice eliminates ambiguity and speeds up interpretation. Example: Instead of logging just response_time, use:
{
  "response_time_ms": 250
}
Logs should provide context beyond just the event details. Include information like user IDs, session IDs, or request sources. Example:
{
  "event": "purchase",
  "user_id": "5678",
  "session_id": "abcd1234",
  "item_id": "9876",
  "amount": 29.99
}
Contextual information makes troubleshooting faster and more efficient.
While it’s tempting to log every detail, too many fields can create unnecessary noise. Focus on the most relevant data points. Example: Instead of logging everything under the sun:
{
  "timestamp": "2024-11-10T12:00:00Z",
  "user_id": "1234",
  // other unnecessary fields...
}
Stick to essential fields:
{
  "timestamp": "2024-11-10T12:00:00Z",
  "user_id": "1234",
  "action": "logout"
}
Streamlined logs are easier to process and analyze, leading to quicker insights.
When you find yourself dealing with an existing unstructured log format, the most effective solution is to parse those logs into JSON format retroactively. This process involves identifying individual values within each log message—often utilizing techniques like regular expressions—and mapping them to specific keys in a structured format. This transformation not only enhances the readability of the logs but also facilitates easier analysis and troubleshooting.
To convert logs from plain text to JSON, we can employ the VRL (Vector Remapping Language) function. Here’s how it works:
In this example, the source log line is a traditional NGINX access log entry in plain text format. Source Log Line:
body: "172.17.0.1 - - [06/Aug/2024:16:37:59 +0000] \"GET /index.html HTTP/1.1\" 200 615 \"-\" \"Mozilla/5.0\""
To parse unstructured logs, we can use the following VRL function:
.body, _ = parse_json(.body)
.
This function allows us to parse the log entries efficiently, extracting relevant information and structuring it as JSON. For more details on the parse_json function, you can refer to the Vector documentation.
Output Log Line (Parsed JSON):
{
  "remote_addr": "172.17.0.1",
  "timestamp": "2024-08-06T16:37:59Z",
  "request": {
    "method": "GET",
    "uri": "/index.html",
    "protocol": "HTTP/1.1"
  },
  "status": 200,
  "bytes_sent": 615,
  "http_user_agent": "Mozilla/5.0"
}
By leveraging VRL functions like parse_json`, you can streamline your logging processes and gain valuable insights from your data.
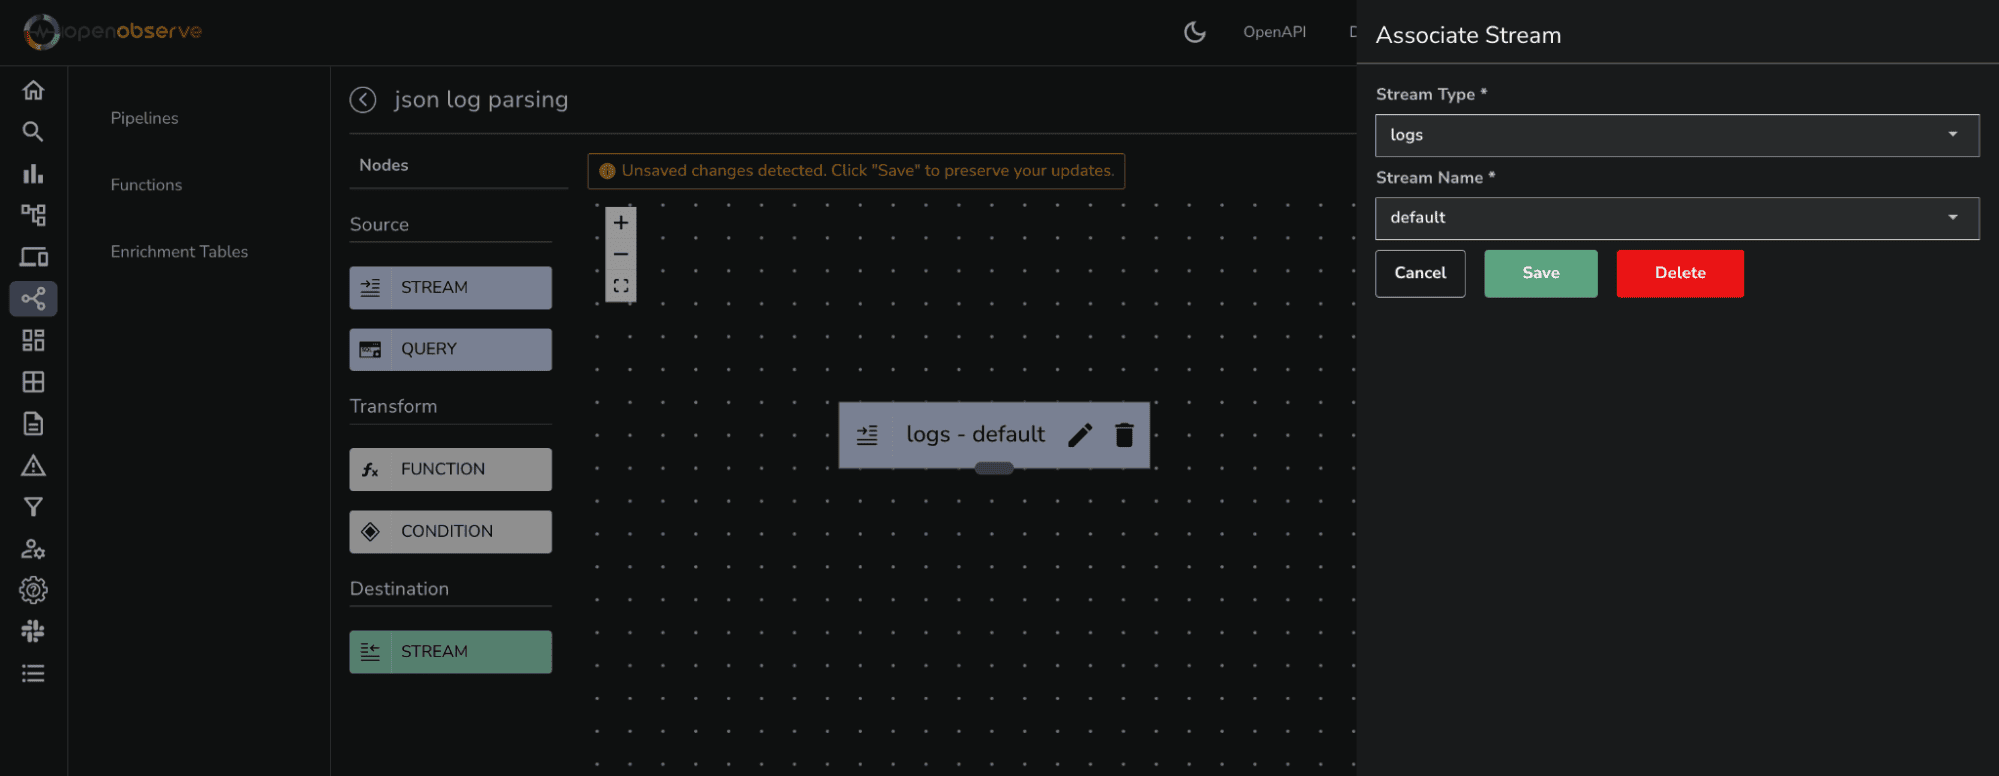
Once we have successfully transformed our logs into JSON format, we can harness the power of OpenObserve for in-depth log analysis. By integrating the parse_json function into our pipelines, we can apply it to a log stream, ensuring that all incoming logs are consistently structured.
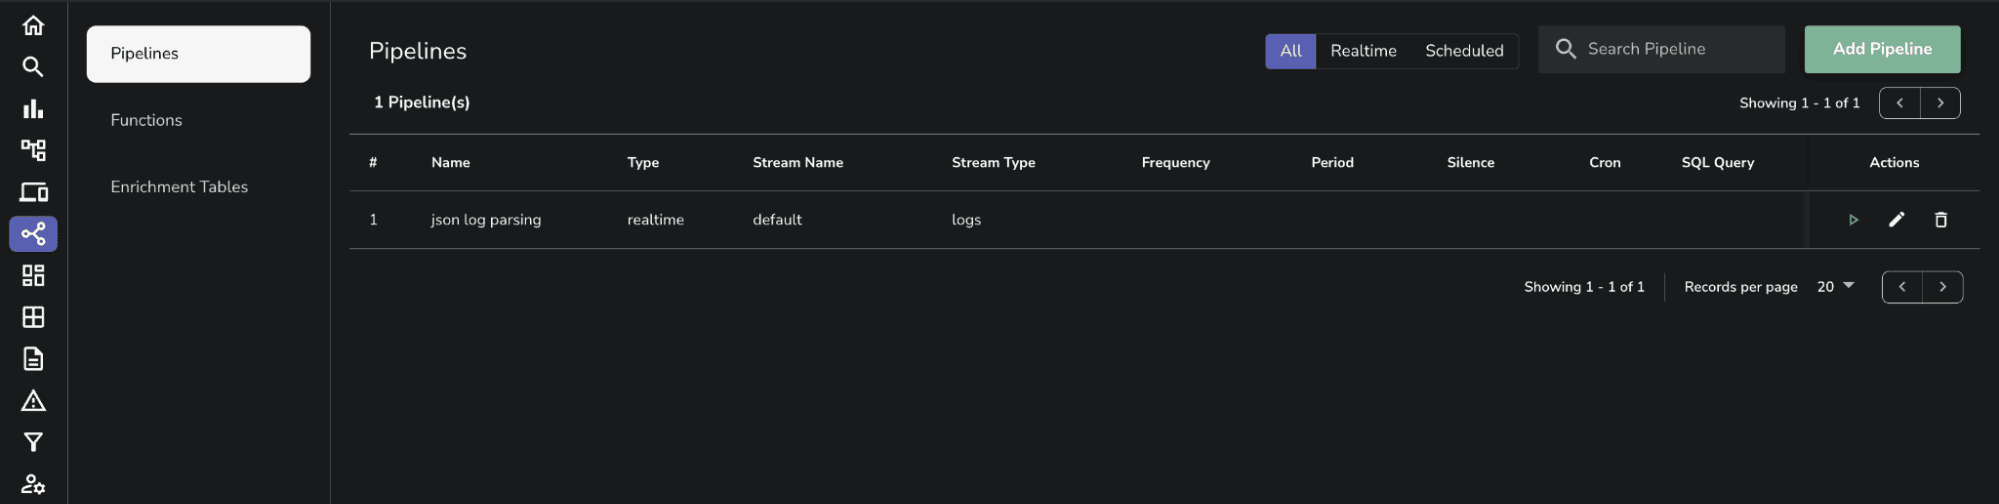
After ingesting the log stream into OpenObserve, you can navigate to the Pipelines section to parse unstructured logs as text and convert them into JSON format. Here’s a step-by-step guide on how to achieve this using the parse_json VRL function.
.body, _ = parse_json(.body)
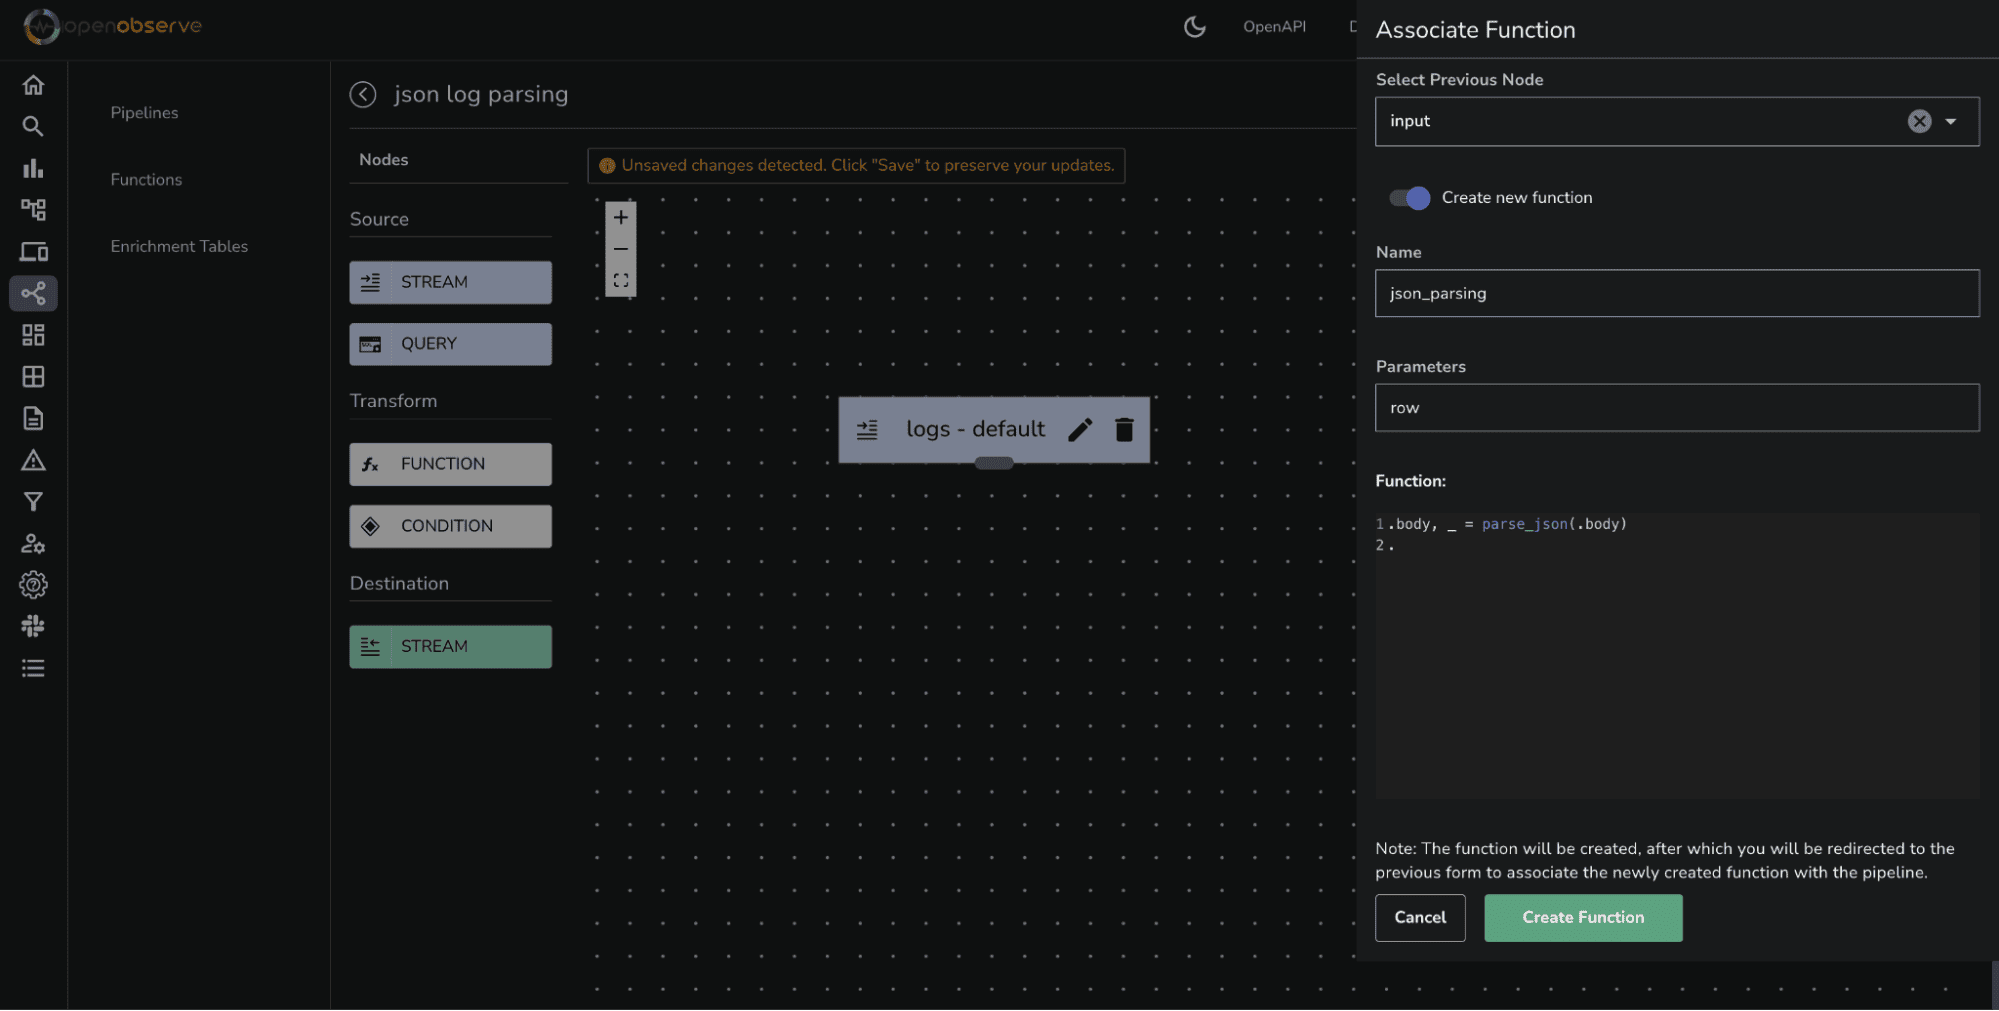
Click Create Function. The function will be created with name json_parse, and you will be redirected back to the previous form to associate the newly created function with the pipeline.
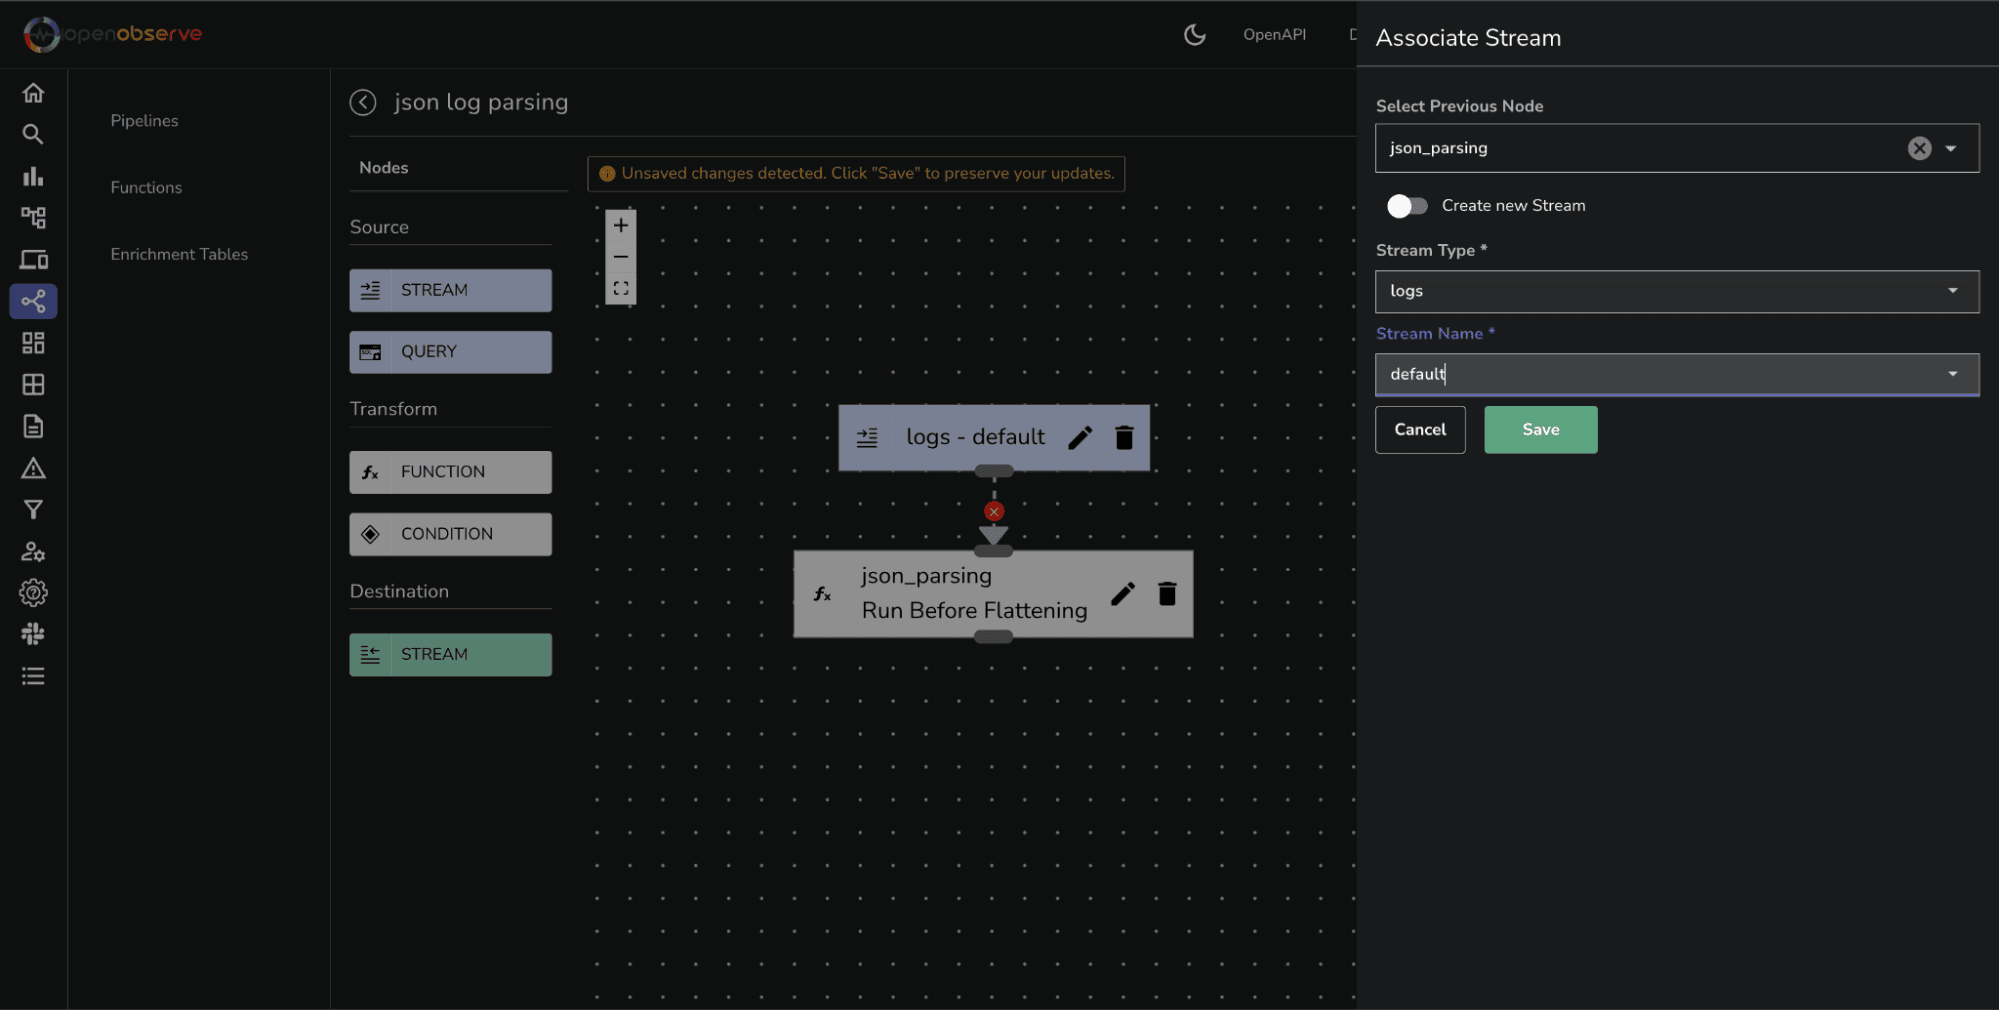
Enter a descriptive name for your pipeline (e.g., "Parse NGINX Logs").
Click Save to store your new pipeline configuration.
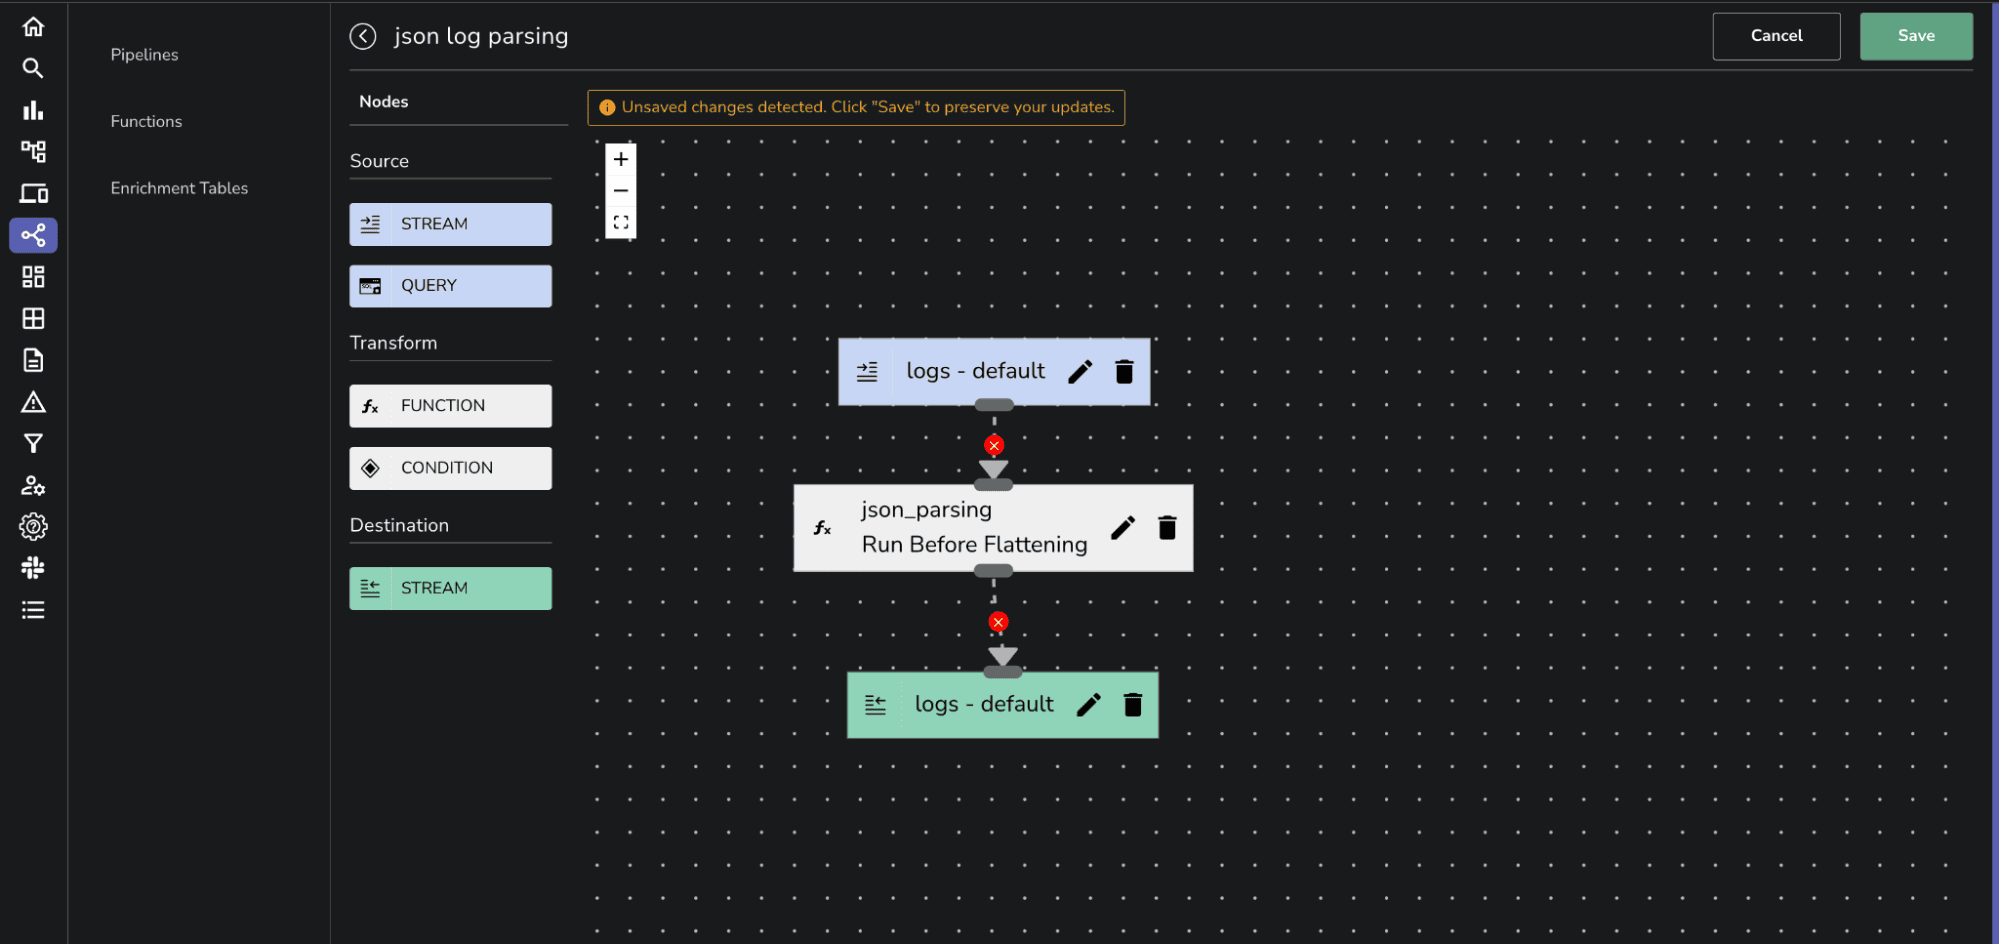
By following these steps, you can successfully apply the parse_json VRL function to transform incoming unstructured logs into structured JSON format within OpenObserve.
Here’s an example of a typical NGINX access log entry:
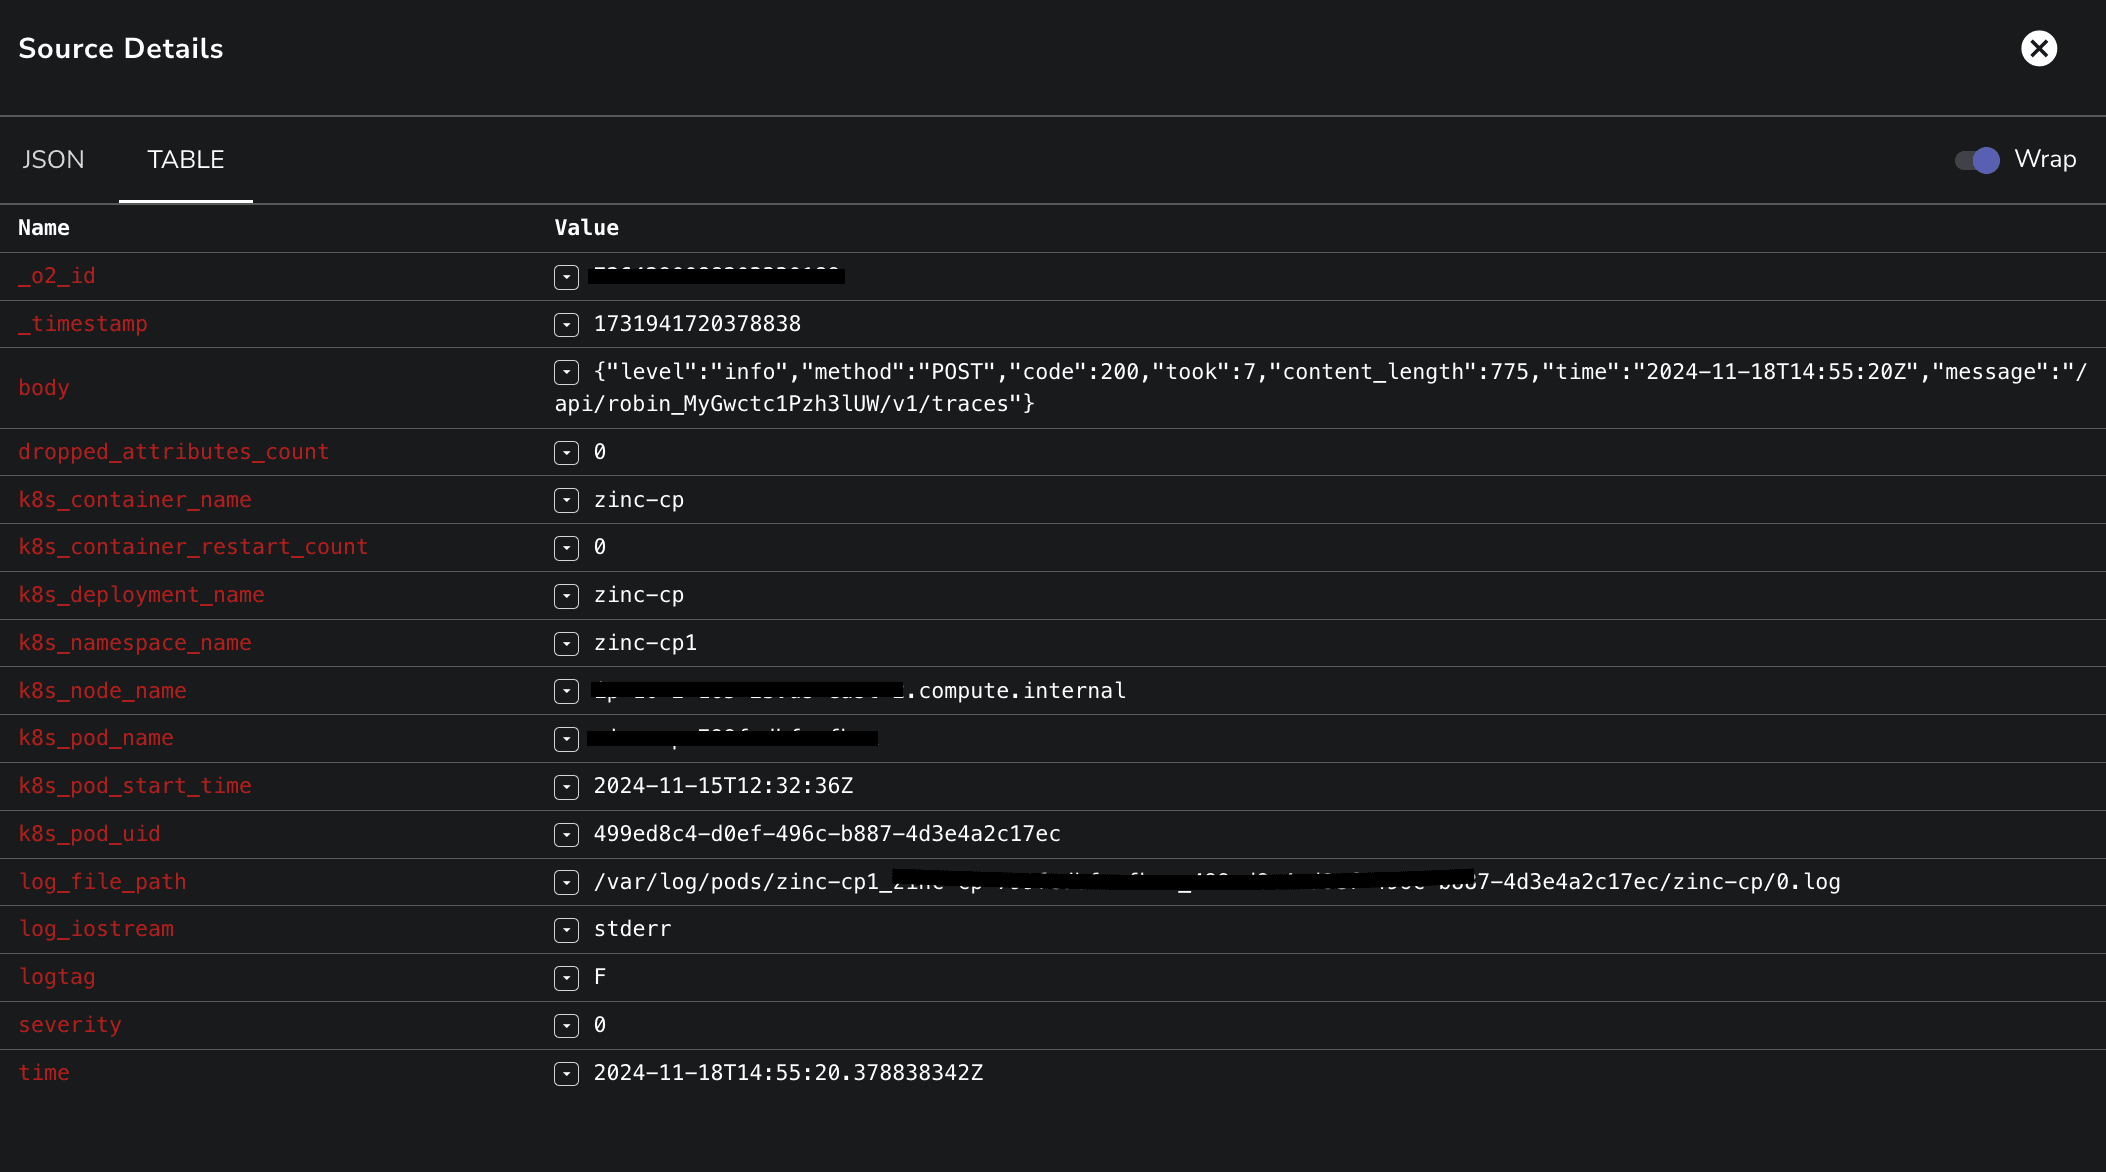
Encapsulated in a JSON string, the body field contains all relevant details about the request, including timestamps, user information, response sizes, and HTTP status codes.
By analyzing these structured log entries, teams can quickly pinpoint issues such as performance bottlenecks or unauthorized access attempts. The ability to parse and interpret these logs effectively enables proactive monitoring and troubleshooting, ensuring that applications remain responsive and secure. With tools like OpenObserve, you can visualize and filter these logs to derive actionable insights that enhance overall system performance.
Happy Monitoring! 🚀
Manas is a passionate Dev and Cloud Advocate with a strong focus on cloud-native technologies, including observability, cloud, kubernetes, and opensource. building bridges between tech and community.