Best Open Source LLM Observability Tools in 2026: Complete Guide

Simran Kumari
March 24, 2026
21 min read
Don’t forget to share!
Try OpenObserve Cloud today for more efficient and performant observability.

LLM observability is the practice of monitoring, tracing, and analyzing every layer of an AI application from the prompt you send to the final response your model returns. As AI systems grow more complex, with multi-step agent workflows, retrieval-augmented generation (RAG) pipelines, and tool calls chained together, traditional logging falls short.
The four core components of LLM observability are:
Without these, teams are blind to quality regressions, prompt drift, hallucinations, and runaway API costs in production.
Traditional observability tools like Grafana and Prometheus are excellent for infrastructure-level signals CPU, memory, request rates, latency percentiles. But LLMs introduce an entirely new class of failure that metrics alone cannot detect:
| Traditional Monitoring | LLM Observability |
|---|---|
| Tracks uptime, latency, error rates | Tracks hallucinations, prompt quality, output relevance |
| Alerts on crashes or timeouts | Alerts on silent quality regressions |
| Measures infrastructure health | Measures model behavior and output correctness |
| Query languages: PromQL, SQL | Evaluation frameworks: LLM-as-judge, semantic similarity |
| Dashboards for SREs | Dashboards for ML engineers and product teams |
This is not to say the two are mutually exclusive. OpenObserve is the standout open source platform that bridges both worlds delivering unified infrastructure telemetry (logs, metrics, traces) while natively supporting LLM-specific monitoring, all in a single deployment. For teams that want one tool to cover the entire observability stack, it is the strongest option available today.
A CHI 2025 study with 30 developers identified four core design principles every solid LLM observability tool should satisfy:
| Principle | What It Means |
|---|---|
| Awareness | Makes model behavior visible you understand what is happening inside the system |
| Monitoring | Real-time feedback during training and evaluation to catch issues early |
| Intervention | Enables you to act on problems as they surface, not after users report them |
| Operability | Supports long-term maintainability as models and requirements evolve |
Beyond those principles, evaluate tools on:
License: AGPL-3.0 (open source) | Website: openobserve.ai | Cloud: cloud.openobserve.ai
OpenObserve is our top pick for 2026. While most tools on this list specialize in LLM-specific concerns, OpenObserve unifies LLM observability with full infrastructure monitoring logs, metrics, traces, and frontend (RUM) monitoring in a single deployment. For teams tired of managing a separate DevOps telemetry stack alongside a dedicated LLM tool, OpenObserve eliminates that overhead entirely.
Built on OpenTelemetry standards and using a Parquet/Vertex columnar format with aggressive compression, OpenObserve delivers 140x lower storage costs compared to traditional stacks like Prometheus + Loki + Tempo. Its SQL-based query interface means teams can correlate LLM trace data with infrastructure metrics without learning multiple proprietary query languages. And with single binary deployment, you can be up and running in under 2 minutes.
Read detailed list of features here.
Key Features:
Pros:
Cons:
Pricing:
Best for: Teams that want a single open source platform covering both LLM observability and infrastructure monitoring, organizations with high data volumes where storage cost is a real concern, and teams with strict self-hosting or data residency requirements.
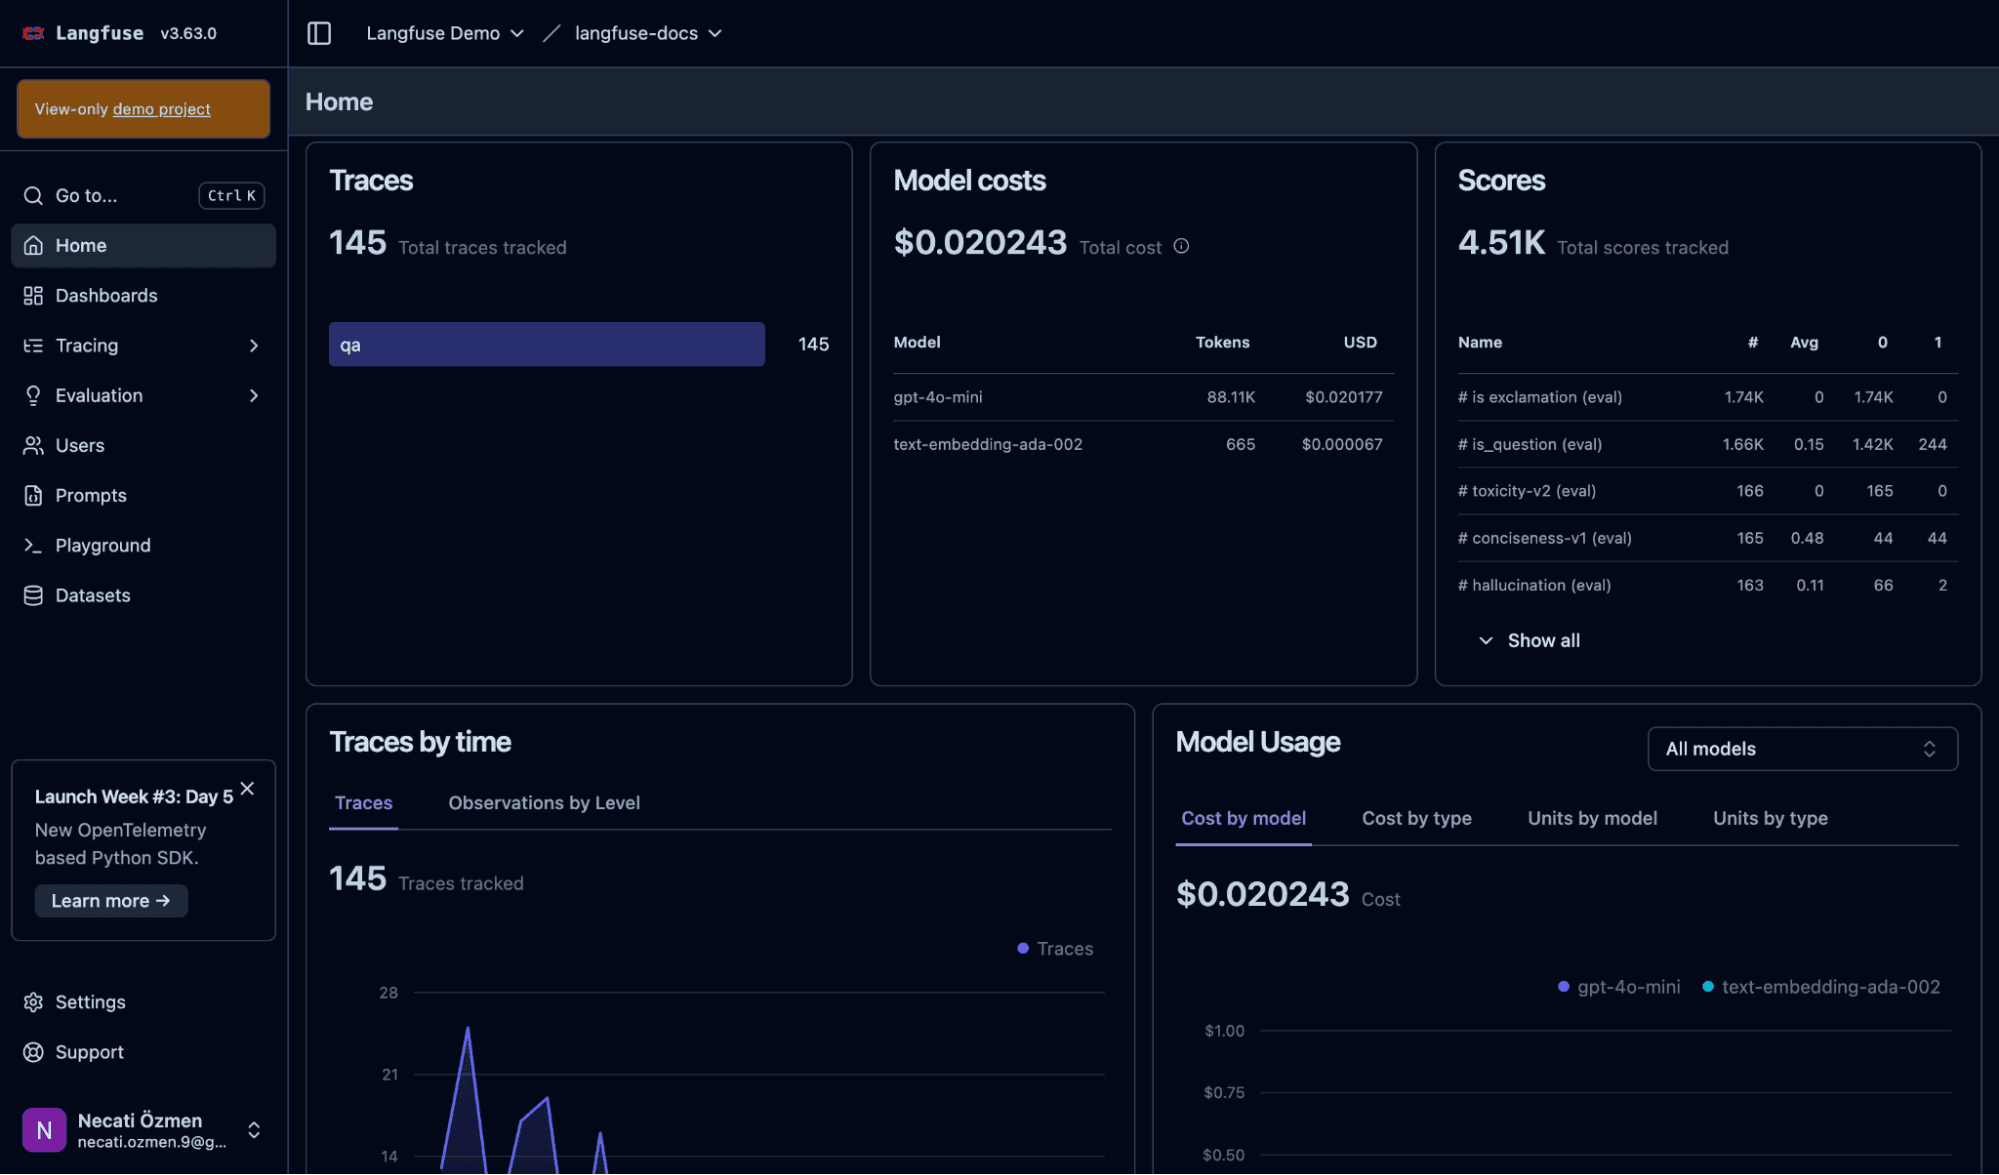
GitHub Stars: 21,000+ (as of February 2026) | License: MIT (core) | Website: langfuse.com
Langfuse is the most widely adopted open source LLM-specific observability platform. Originally from YCombinator W23, it was recently acquired by ClickHouse, signalling a strong long-term investment in its data infrastructure. Its MIT-licensed core covers end-to-end tracing, prompt management, evaluation, and datasets everything a production LLM team needs on the application layer.
Key Features:
Pros:
Cons:
Pricing:
Best for: Engineering teams that want the deepest open source LLM-specific observability with prompt management and evaluation built in.
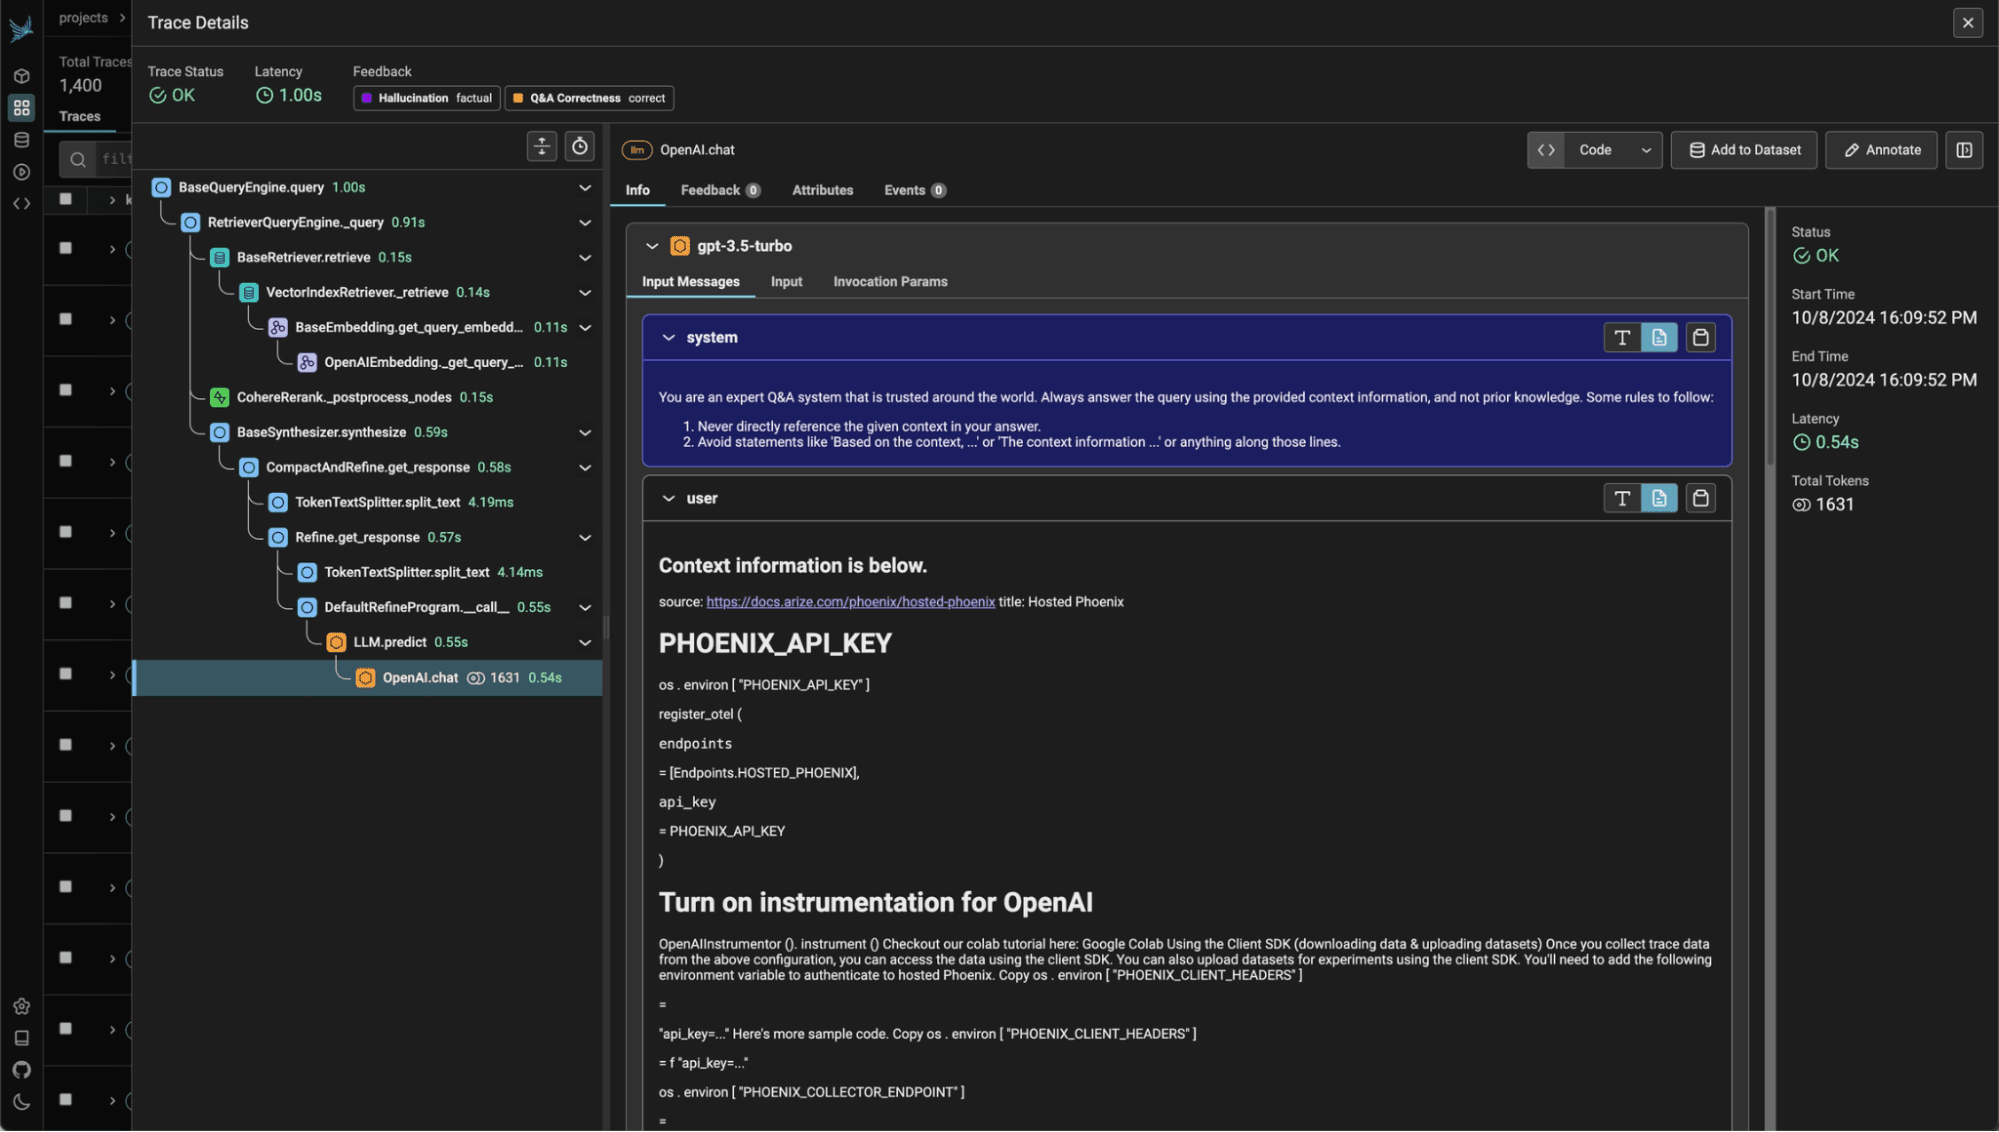
License: Elastic License 2.0 (source-available) | Website: phoenix.arize.com
Arize Phoenix is a source-available observability platform built specifically for LLM applications, RAG pipelines, and agent workflows. Built on OpenTelemetry standards, it includes built-in hallucination detection and embedding drift visualisation, making it particularly powerful for teams iterating on retrieval pipelines.
Key Features:
Pros:
Cons:
Pricing:
Best for: AI engineering teams building RAG-based systems and agent workflows where deep retrieval pipeline visibility is critical.
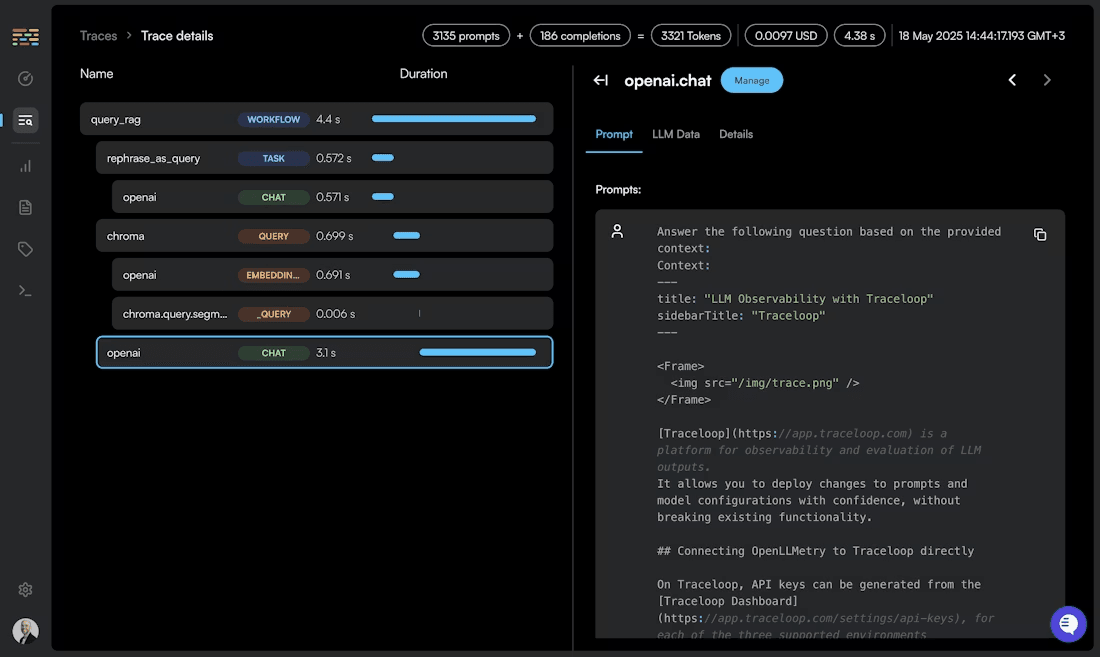
License: Apache 2.0 | Website: openllmetry.com
OpenLLMetry is the most vendor-neutral option on this list. An open source observability framework built purely on OpenTelemetry standards, it provides LLM instrumentation for Python and TypeScript with a single line of setup code. It then ships traces to any OTEL-compatible backend making OpenObserve a natural pairing as the storage and visualization layer.
Key Features:
Pros:
Cons:
Pricing: Completely free
Best for: Teams that want vendor-neutral LLM instrumentation and already have an observability backend like OpenObserve, or teams building a custom OpenTelemetry-native stack.
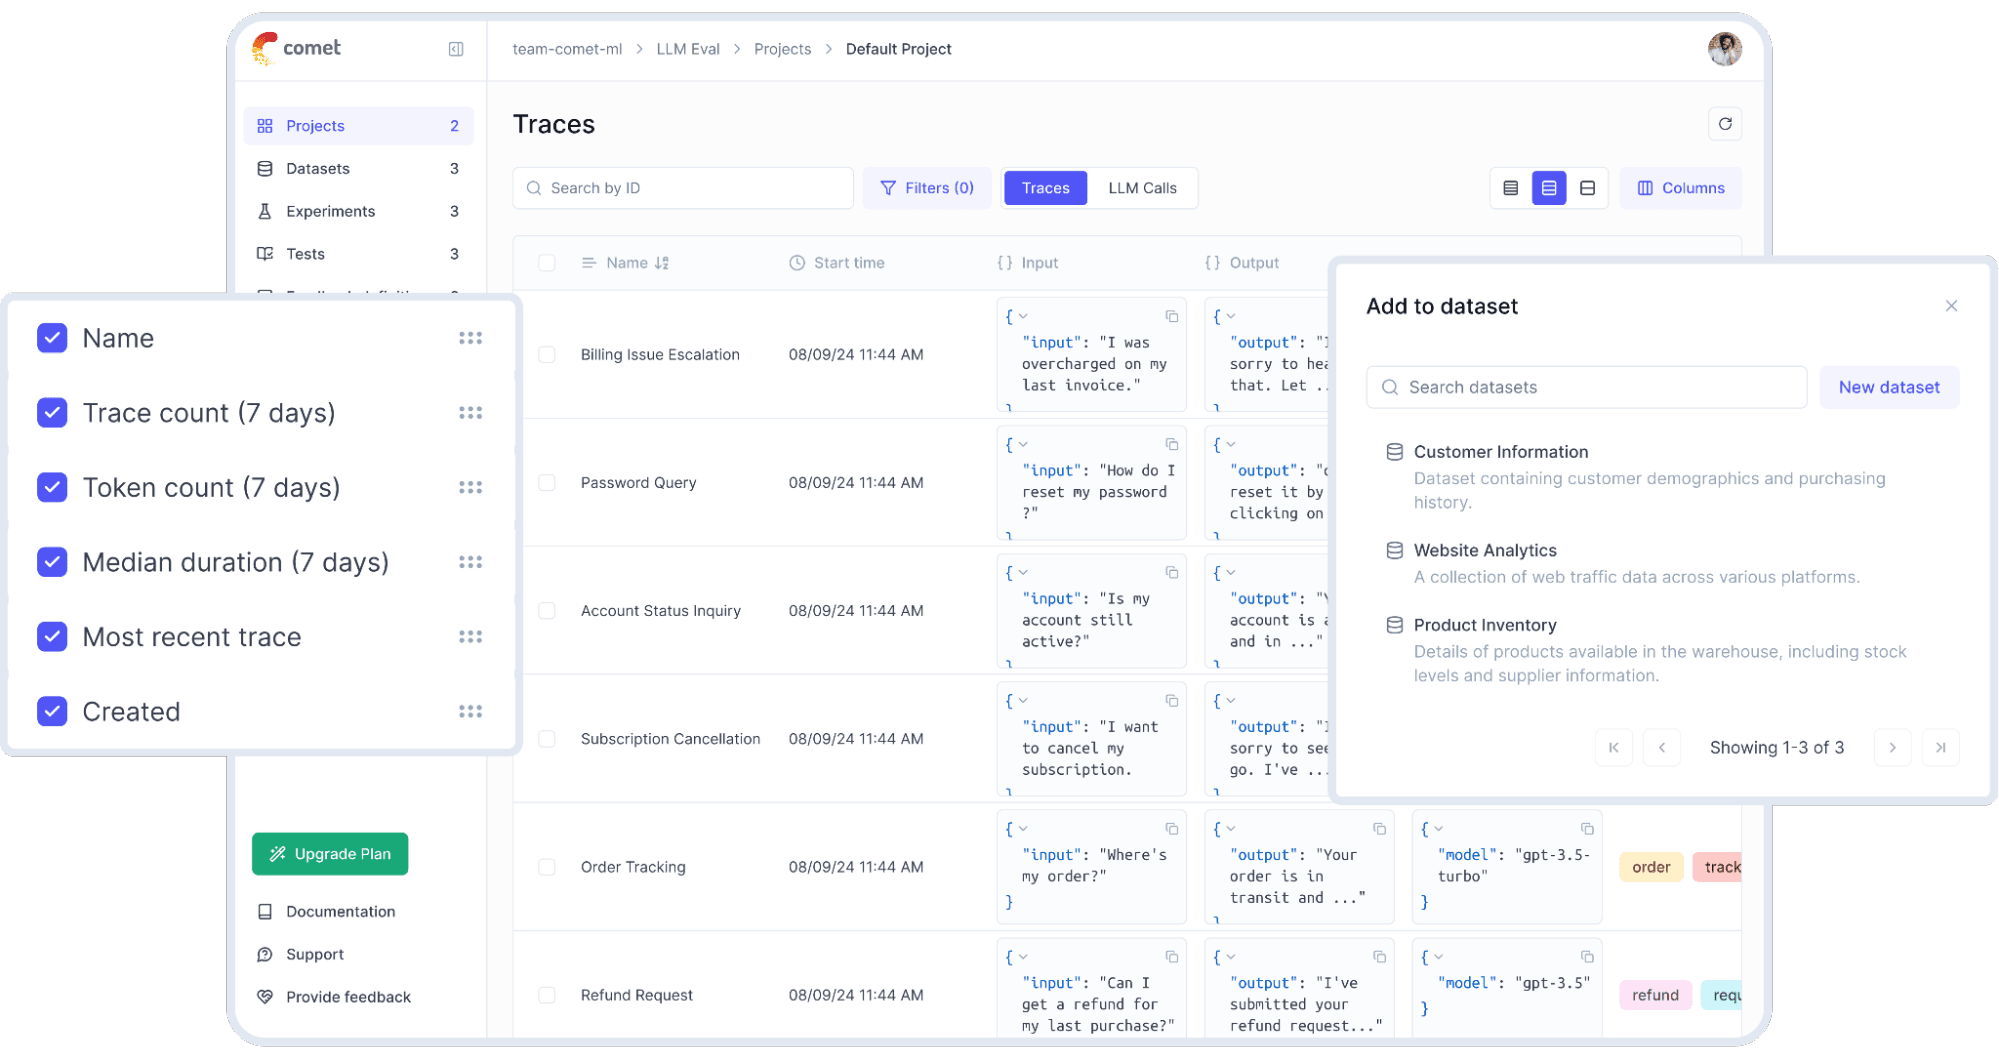
License: Apache 2.0 | Website: comet.com/site/products/opik
Opik is an open source LLM observability and evaluation platform from Comet ML, focused on systematic testing, optimization, and production monitoring. It stands out for its automated prompt optimization six algorithms including Few-shot Bayesian, evolutionary, and LLM-powered MetaPrompt approaches which is rare in open source tooling.
 Key Features:
Pros:
Cons:
Pricing:
Best for: Teams that want comprehensive observability with automated prompt optimization and guardrails built in.
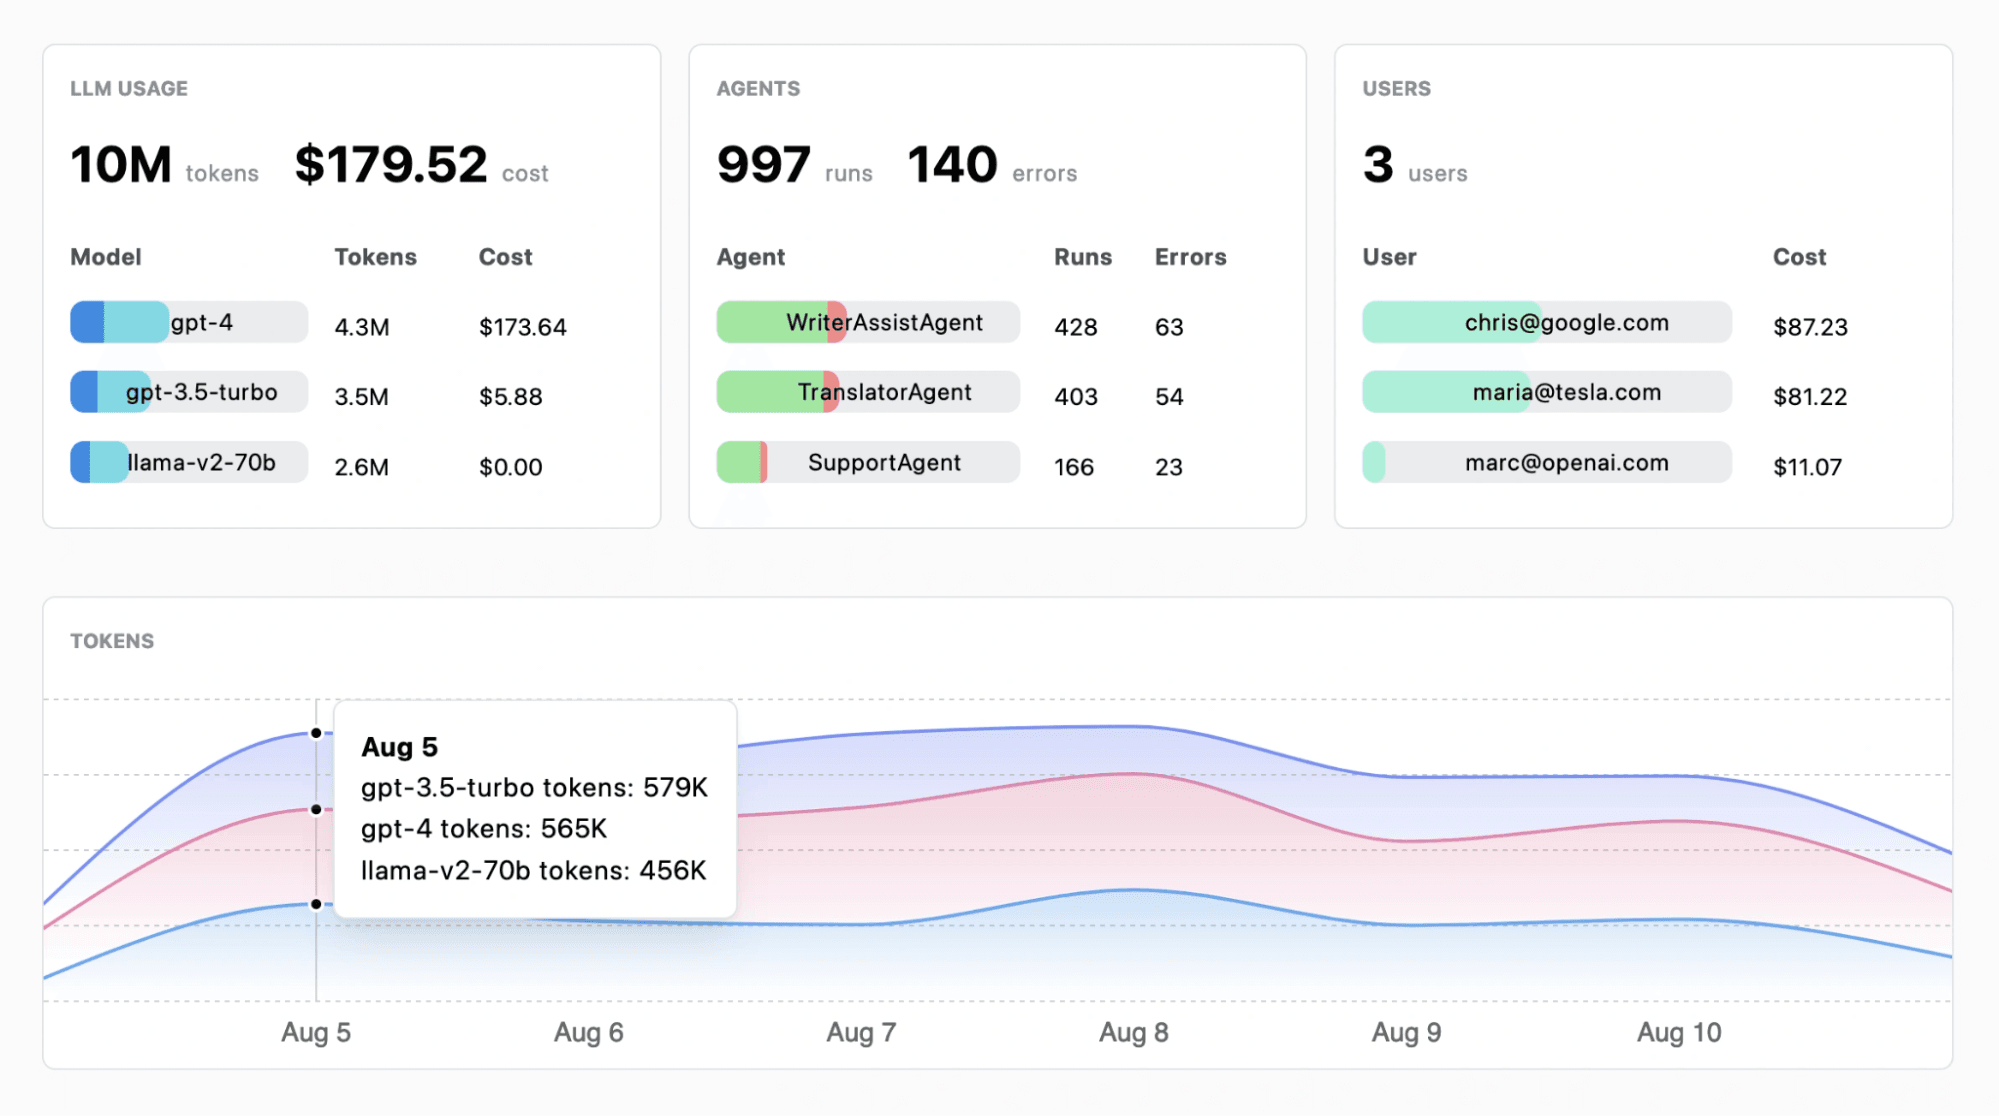
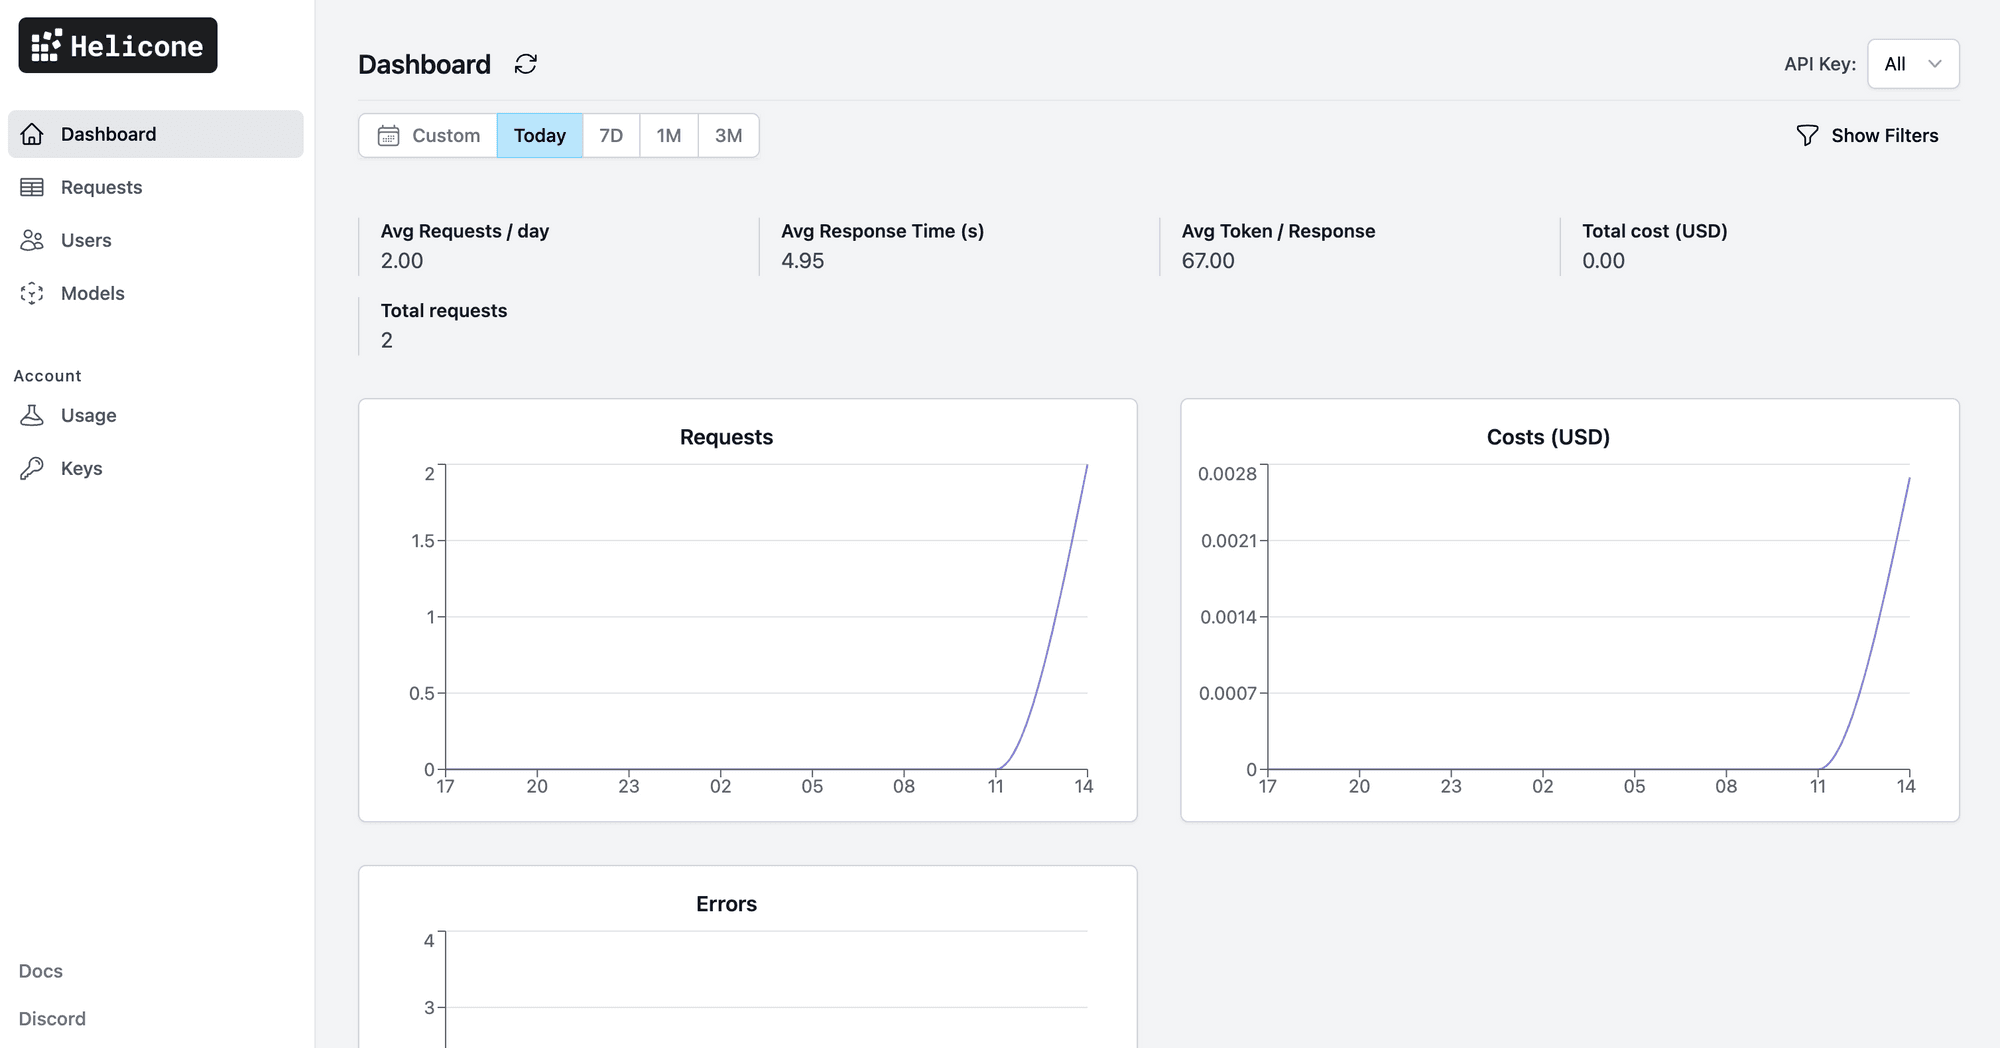
License: MIT | Website: helicone.ai
Helicone takes a fundamentally different approach: it is a proxy-first observability platform. Rather than adding an SDK, you simply change your base URL to route traffic through Helicone and it immediately logs every request, response, token count, cost, and error with zero code changes.
 Key Features:
Pros:
Cons:
Pricing:
Best for: Teams that need lightweight model-level observability and cost control with the absolute minimum setup friction.
License: Apache 2.0 | Website: lunary.ai
Lunary is a lightweight open source observability platform optimized for RAG pipelines and chatbot applications. It offers SDKs for JavaScript (Node.js, Deno, Vercel Edge, Cloudflare Workers) and Python, with a setup time of roughly two minutes. Its Radar feature automatically categorizes LLM responses based on pre-defined criteria, making it easy to audit outputs at scale.
 Key Features:
Pros:
Cons:
Pricing:
Best for: JavaScript-first teams building RAG pipelines or chatbot applications who need quick observability setup.
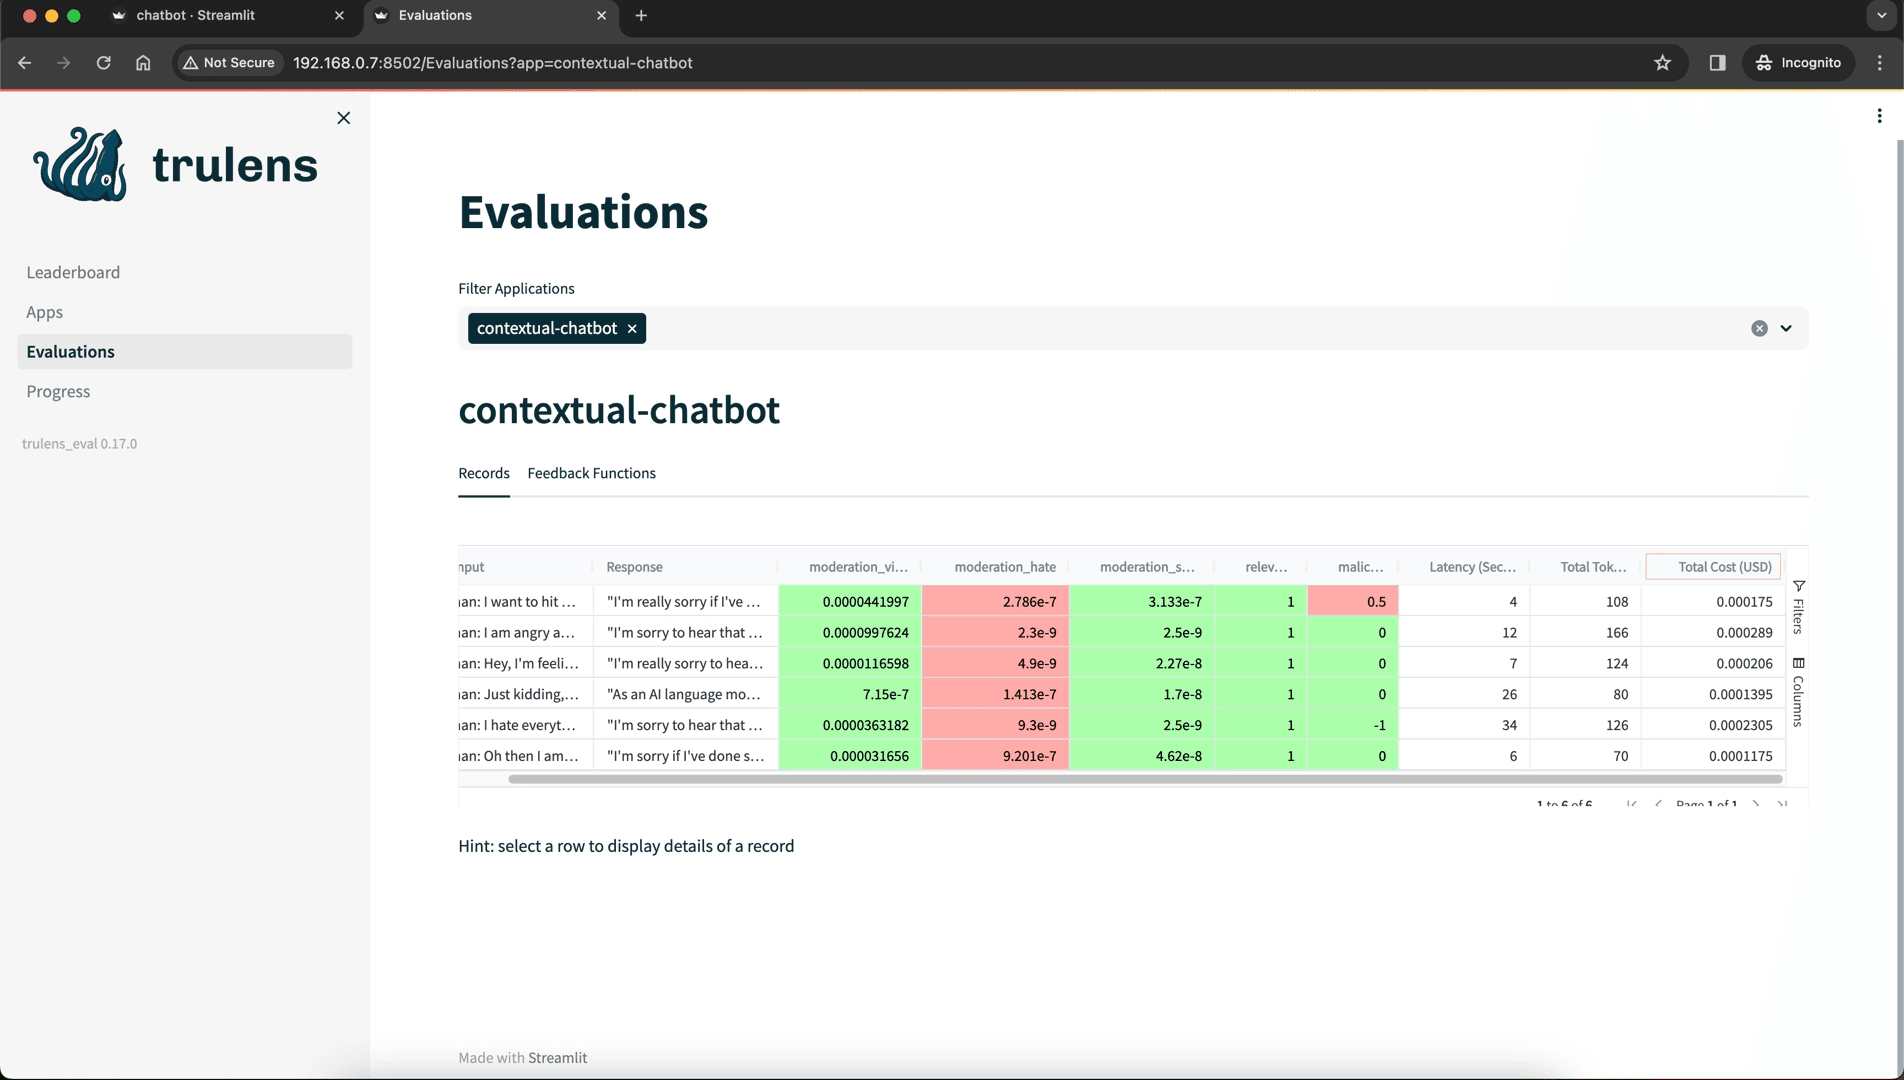
License: MIT | Website: trulens.org
TruLens takes a qualitative-first approach to LLM observability, built around structured feedback functions that evaluate LLM responses after each call. It is particularly strong for teams using LlamaIndex and LangChain who want systematic evaluation pipelines rather than traditional tracing.
 Key Features:
Pros:
Cons:
Pricing: Free (MIT licensed)
Best for: Research teams and ML engineers who need rigorous, automated evaluation pipelines for RAG systems with Python-native tooling.
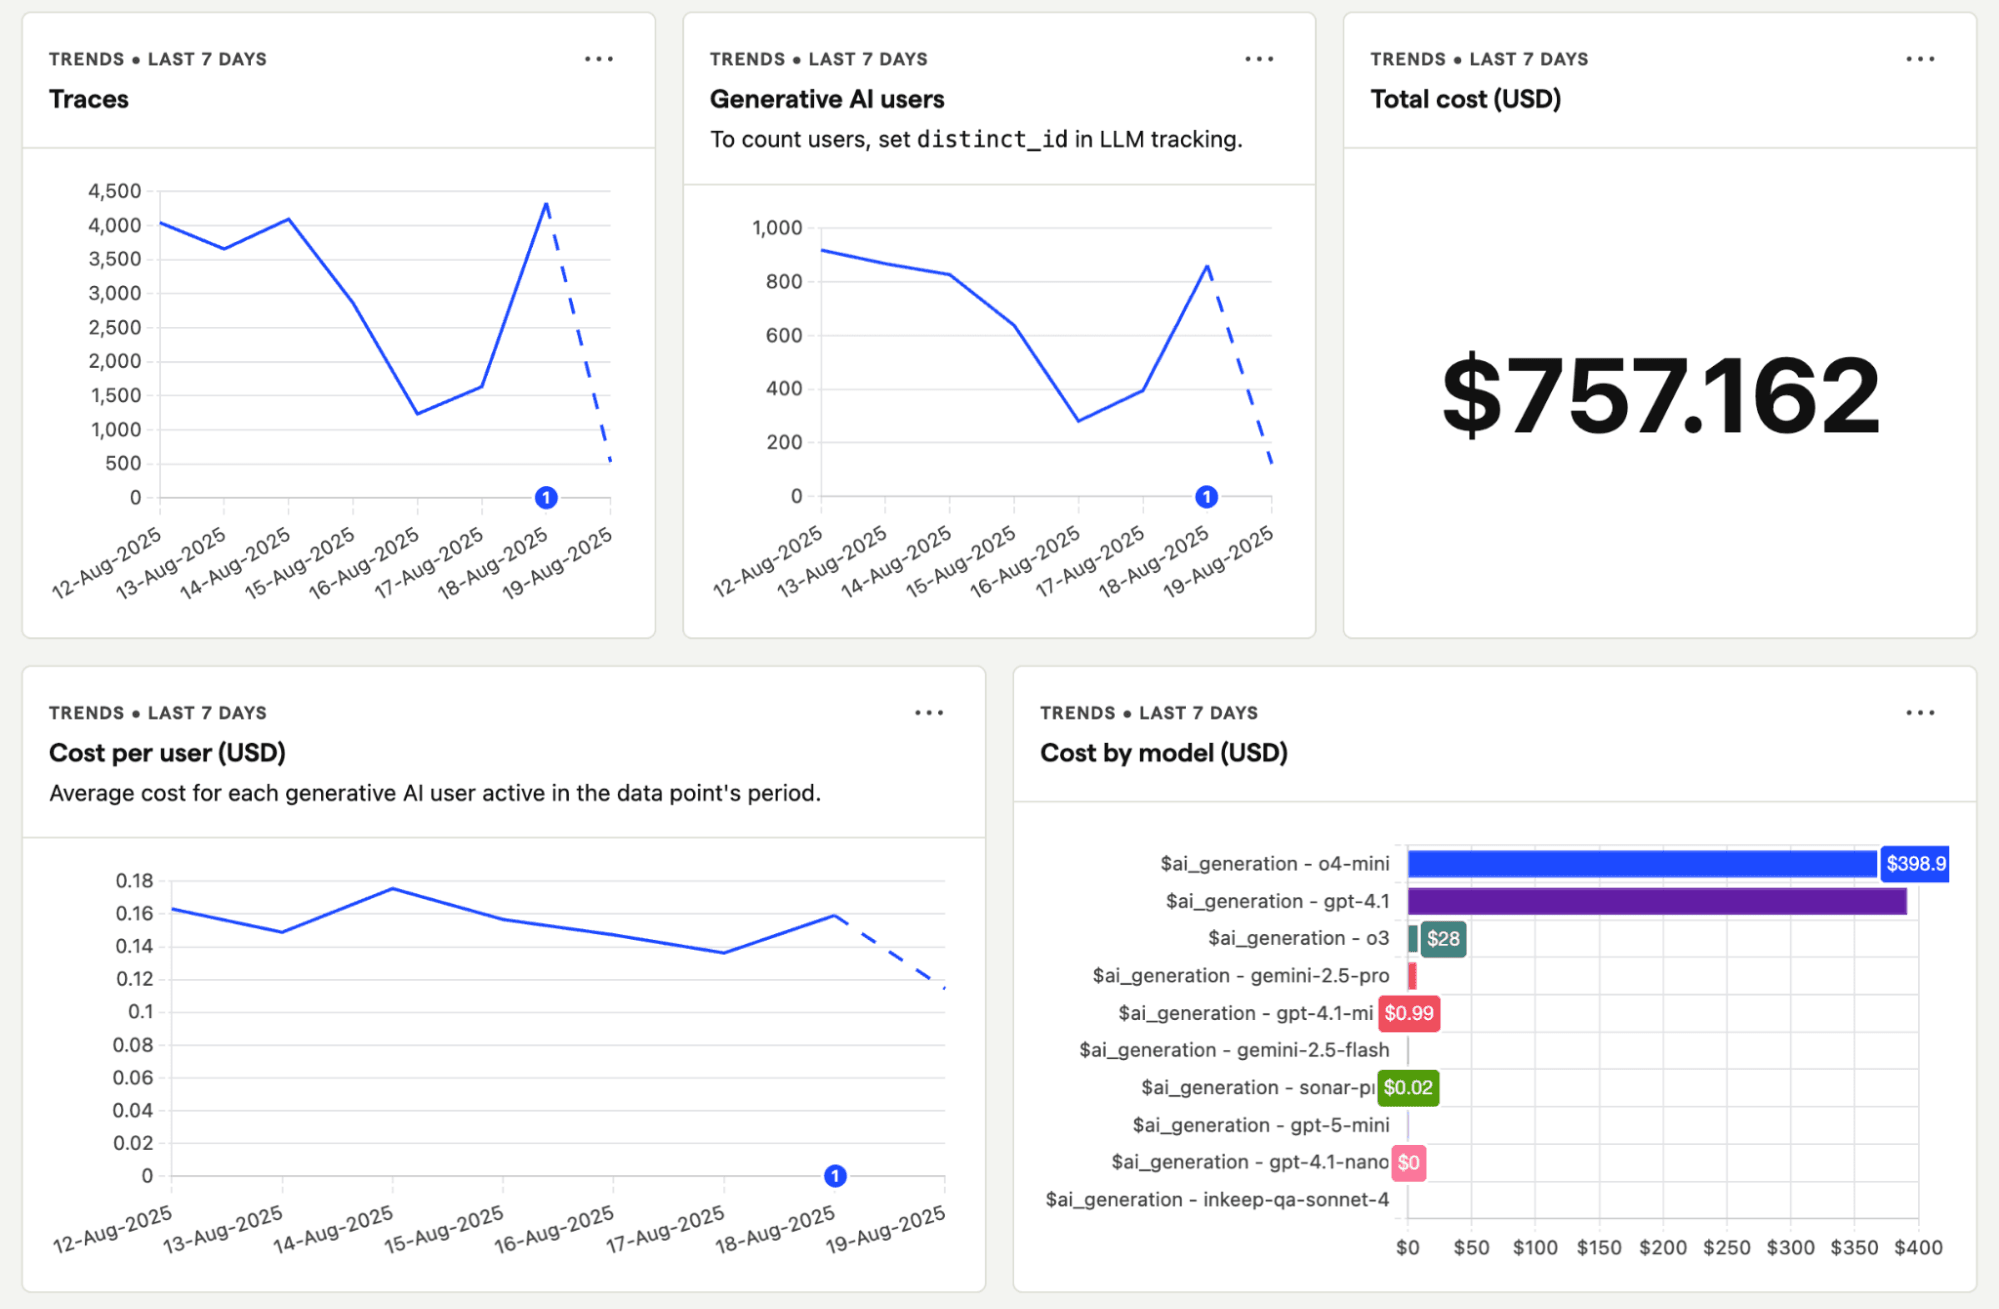
GitHub Stars: 32,100+ (as of March 2026) | License: MIT | Website: posthog.com
PostHog bundles LLM observability alongside product analytics, session replay, feature flags, A/B testing, and error tracking. For teams who want to understand not just how their LLM performs technically but how users actually interact with it, PostHog is uniquely positioned.
 Key Features:
Pros:
Cons:
Pricing:
Best for: Product-led teams who want to combine LLM monitoring with user behaviour and product analytics in one platform.
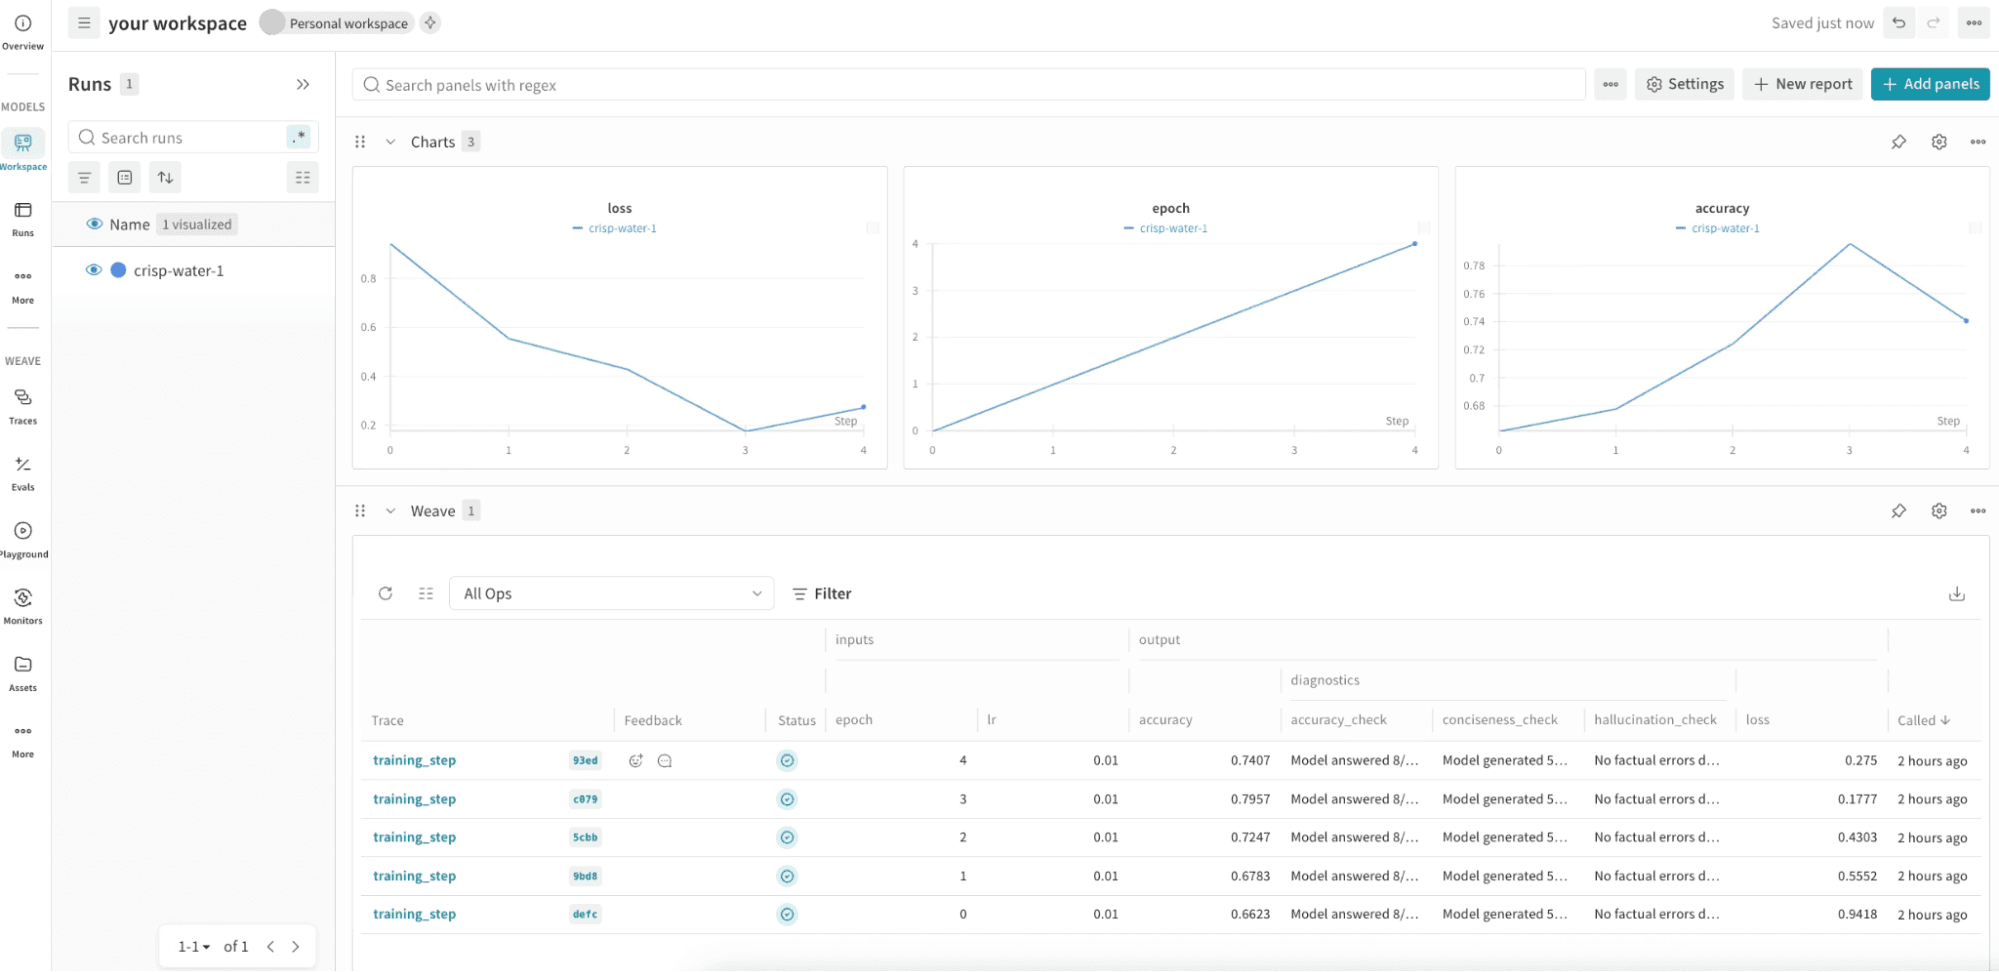
License: Apache 2.0 | Website: wandb.ai/site/weave
Weave is the LLM observability product from Weights & Biases (W&B), extending W&B's ML experiment tracking into LLM application observability covering tracing, evaluation, and dataset management in a unified interface.
Key Features:
Pros:
Cons:
Pricing:
Best for: ML research teams already invested in the W&B ecosystem who want to extend experiment tracking into production LLM observability.
| Tool | License | Self-Hosted | Tracing | Evaluation | Prompt Mgmt | Infra Monitoring | RAG Support | Best For |
|---|---|---|---|---|---|---|---|---|
| OpenObserve | AGPL-3.0 | ✅ | ✅ | ⚠️ (via integrations) | ⚠️ (via integrations) | ✅✅ | ✅ | Unified infra + LLM observability |
| Langfuse | MIT (core) | ✅ | ✅ | ✅ | ✅ | ❌ | ✅ | Full-lifecycle LLM observability |
| Arize Phoenix | ELv2 | ✅ | ✅ | ✅ | ⚠️ | ❌ | ✅✅ | RAG and agent debugging |
| OpenLLMetry | Apache 2.0 | ✅ | ✅ | ❌ | ❌ | ❌ | ✅ | Vendor-neutral instrumentation |
| Comet Opik | Apache 2.0 | ✅ | ✅ | ✅ | ✅ | ❌ | ✅ | Prompt optimization + observability |
| Helicone | MIT | ✅ | ✅ | ⚠️ | ❌ | ❌ | ⚠️ | Lightweight proxy-based monitoring |
| Lunary | Apache 2.0 | ✅ | ✅ | ⚠️ | ❌ | ❌ | ✅ | JavaScript RAG & chatbots |
| TruLens | MIT | ✅ | ⚠️ | ✅✅ | ❌ | ❌ | ✅ | Structured evaluation pipelines |
| PostHog | MIT | ✅ | ✅ | ⚠️ | ⚠️ (beta) | ❌ | ⚠️ | LLM + product analytics combined |
| Weave (W&B) | Apache 2.0 | ✅ | ✅ | ✅ | ⚠️ | ❌ | ✅ | ML research teams on W&B |
✅ = strong support, ⚠️ = partial or in beta, ❌ = not available
If your organization requires data residency or strict compliance, every tool on this list supports self-hosting. For the simplest and most powerful self-hosted path, OpenObserve stands out single binary deployment in under 2 minutes, covering both infrastructure and LLM telemetry with no multi-component stack to manage. For pure LLM-specific self-hosting, Langfuse via Docker Compose takes about 5 minutes.
| If your main problem is... | Best tool(s) |
|---|---|
| Unified infra + LLM observability in one place | OpenObserve |
| Debugging agent and chain failures | OpenObserve, Langfuse, Arize Phoenix |
| RAG pipeline quality | Arize Phoenix, TruLens, Lunary |
| Prompt quality and optimization | Comet Opik, Langfuse |
| Cost and token tracking | Helicone, Langfuse, OpenObserve |
| Storage cost at scale | OpenObserve (140x compression) |
| Vendor-neutral instrumentation | OpenLLMetry → OpenObserve as backend |
| JavaScript/Node.js first | Lunary, PostHog |
| Product analytics + LLM | PostHog |
In early development, basic tracing and cost monitoring (Helicone, Lunary) may be enough. As you move to production, evaluation becomes critical. Langfuse and Arize Phoenix lead for comprehensive evaluation workflows; TruLens leads for structured RAG evaluation methodology. For teams wanting a single backend for all telemetry while layering eval tools on top, OpenObserve is the ideal foundation.
Tools built on OpenTelemetry standards particularly OpenLLMetry, Arize Phoenix, and OpenObserve give you the most flexibility to change components without re-instrumenting your application. OpenObserve is fully OTEL-native, meaning your instrumentation code stays unchanged regardless of which evaluation or prompt management layer you place on top.
OpenObserve is our top pick for 2026. It is the only open source platform that covers both LLM observability and infrastructure monitoring in a single deployment eliminating tool sprawl while delivering 140x lower storage costs and a familiar SQL query interface. For LLM-specific evaluation and prompt management on top of OpenObserve, Langfuse is the strongest companion. For RAG-specific debugging, Arize Phoenix leads.
Yes. All tools on this list support major providers including OpenAI, Anthropic, Cohere, Azure OpenAI, AWS Bedrock, Vertex AI, and most open source model endpoints. OpenLLMetry and Helicone have the broadest provider coverage (100+ models). OpenObserve accepts telemetry from any OpenTelemetry-compatible instrumentation, making it fully provider-agnostic.
Tracing records what happened, prompts sent, responses received, latencies, token counts, tool calls. Evaluation assesses whether what happened was good was the response accurate, relevant, grounded in retrieved context, free of hallucinations? OpenObserve handles tracing and operational monitoring exceptionally well. For evaluation workflows, pair it with Langfuse or Comet Opik.
Not if you choose OpenObserve. It handles metrics, logs, distributed traces, and LLM telemetry in a single platform replacing the need for separate tools like Prometheus, Loki, Tempo, and a dedicated LLM observability layer. For all other tools on this list, you will need a separate infrastructure monitoring stack, and OpenObserve is the recommended open source choice for that role. See the OpenObserve overview of top observability platforms for a full breakdown.
Yes. OpenTelemetry has become the de facto standard for vendor-neutral telemetry. Tools like OpenLLMetry, Arize Phoenix, and OpenObserve are built on OTEL from the ground up, meaning you can switch backends without changing your instrumentation code. This is increasingly the expected baseline just as it has become standard in infrastructure observability, as covered in the OpenObserve guide to modern observability platforms.
Helicone wins on LLM-specific setup speed one line of code (change your base URL) and you have immediate production observability. OpenObserve wins on full-stack setup speed single binary deployment in under 2 minutes, covering both LLM and infrastructure telemetry with no multi-component configuration needed.
This is where OpenObserve stands out most clearly. Its Parquet-based 140x compression technology dramatically reduces the cost of storing LLM traces, prompt histories, and operational metrics at scale critical as LLM application volumes grow. For a detailed breakdown of how storage costs compare across platforms, see OpenObserve's cost comparison analysis.
Passionate about observability, AI systems, and cloud-native tools. All in on DevOps and improving the developer experience.