Top Log Management Tools (Compared & Reviewed)

Simran Kumari
March 11, 2026
14 min read
Don’t forget to share!
Try OpenObserve Cloud today for more efficient and performant observability.

As systems grow in complexity, microservices, containers, multi-cloud deployments and log management tools have become the backbone of modern engineering operations. Without them, debugging a production incident means manually grepping through thousands of raw files across hundreds of servers. With the right tool, you find the root cause in seconds.
In this guide, we compare the top 10 log management tools of 2026 covering features, pricing, open-source availability, and the exact use cases where each one shines.
Log management tools collect, aggregate, index, store, and analyze log data generated by applications, servers, containers, databases, and network devices. A good log management platform turns raw, chaotic log streams into structured, searchable, and actionable intelligence.
The core capabilities to look for in any log management tool include:
| Tool | Type | Open Source | Best For | Starting Price |
|---|---|---|---|---|
| OpenObserve | Self-hosted / Cloud | ✅ | Cost-efficient cloud-native | Free / $0.3/GB |
| Datadog | SaaS | ❌ | All-in-one observability | ~$0.10/GB |
| Splunk | Self-hosted / Cloud | ❌ | Enterprise security & SIEM | ~$150/GB/day |
| Grafana Loki | Self-hosted / Cloud | ✅ | Kubernetes environments | Free |
| Elastic Stack (ELK) | Self-hosted / Cloud | ✅ | Full-text search pipelines | Free / $95+/mo |
| Papertrail | SaaS | ❌ | Small teams, fast setup | Free / $7/mo |
| Sumo Logic | SaaS | ❌ | Multi-cloud & compliance | Free tier / Enterprise |
| Graylog | Self-hosted / Cloud | ✅ | Self-hosted on a budget | Free / $1,250/mo |
| New Relic Logs | SaaS | ❌ | Unified observability | Free (100GB/mo) |
Best Open-Source Log Management Tool
Type: Open-source · Self-hosted & Cloud
Pricing: Free (self-hosted) / ~$0.3/GB on cloud
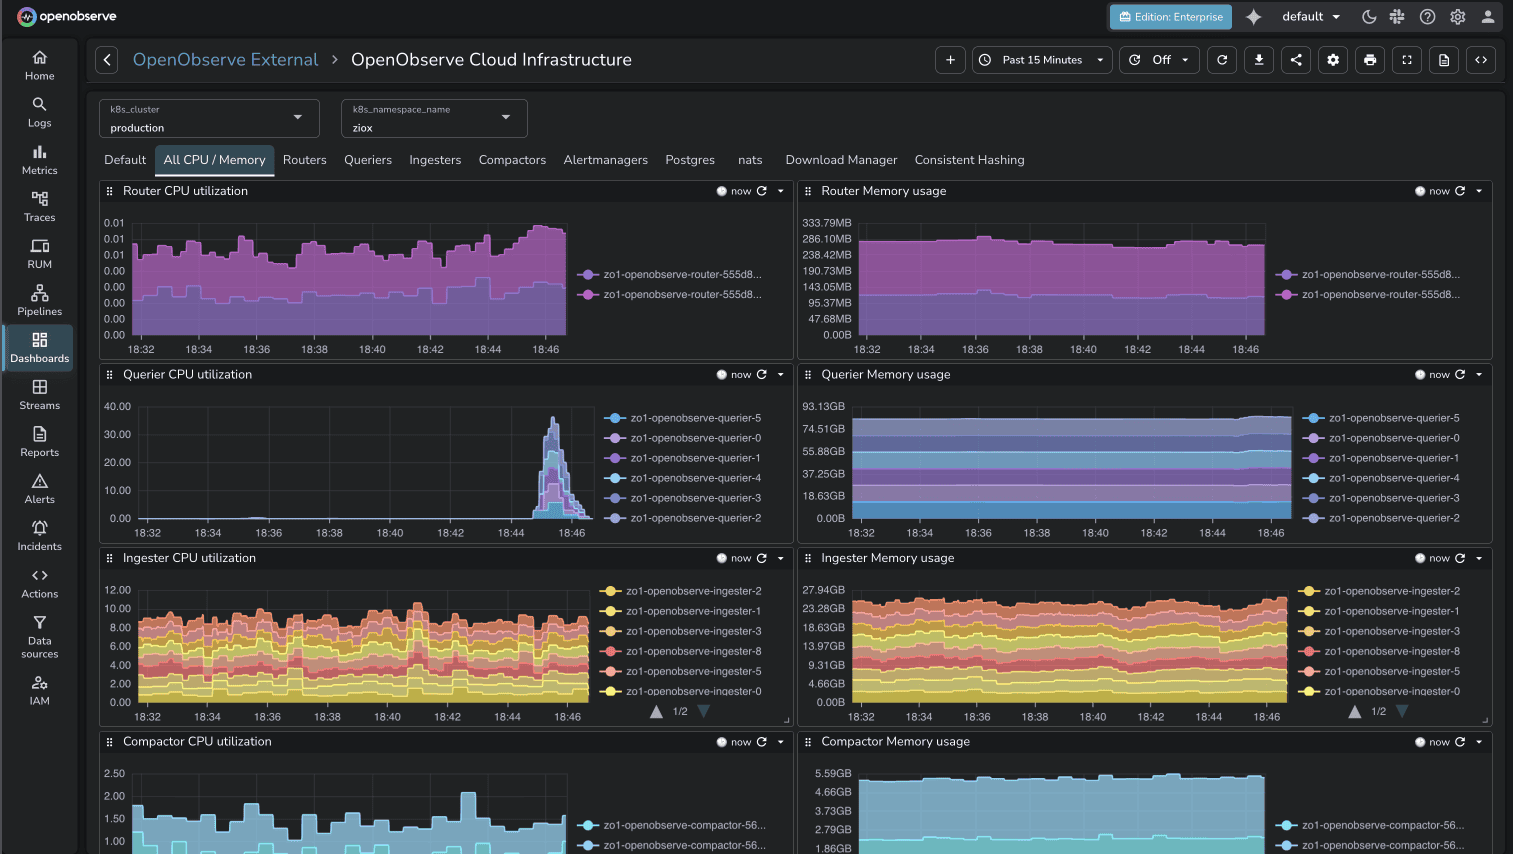
OpenObserve has quickly established itself as one of the most compelling log management tools for teams that want Elasticsearch-level power at a fraction of the cost. Written in Rust and built S3-native from the ground up, it delivers approximately 140× lower storage costs compared to traditional ELK deployments.
Unlike many open-source tools, OpenObserve ships as a single binary with everything built in: log ingestion, metrics, traces, dashboards, and alerting no plugins or external dashboarding layer required.
Key features:
Best for: Startups, cost-conscious platform teams, cloud-native developers who want a self-hosted Datadog alternative.
Type: SaaS
Pricing: ~$0.10/GB ingested + retention add-ons
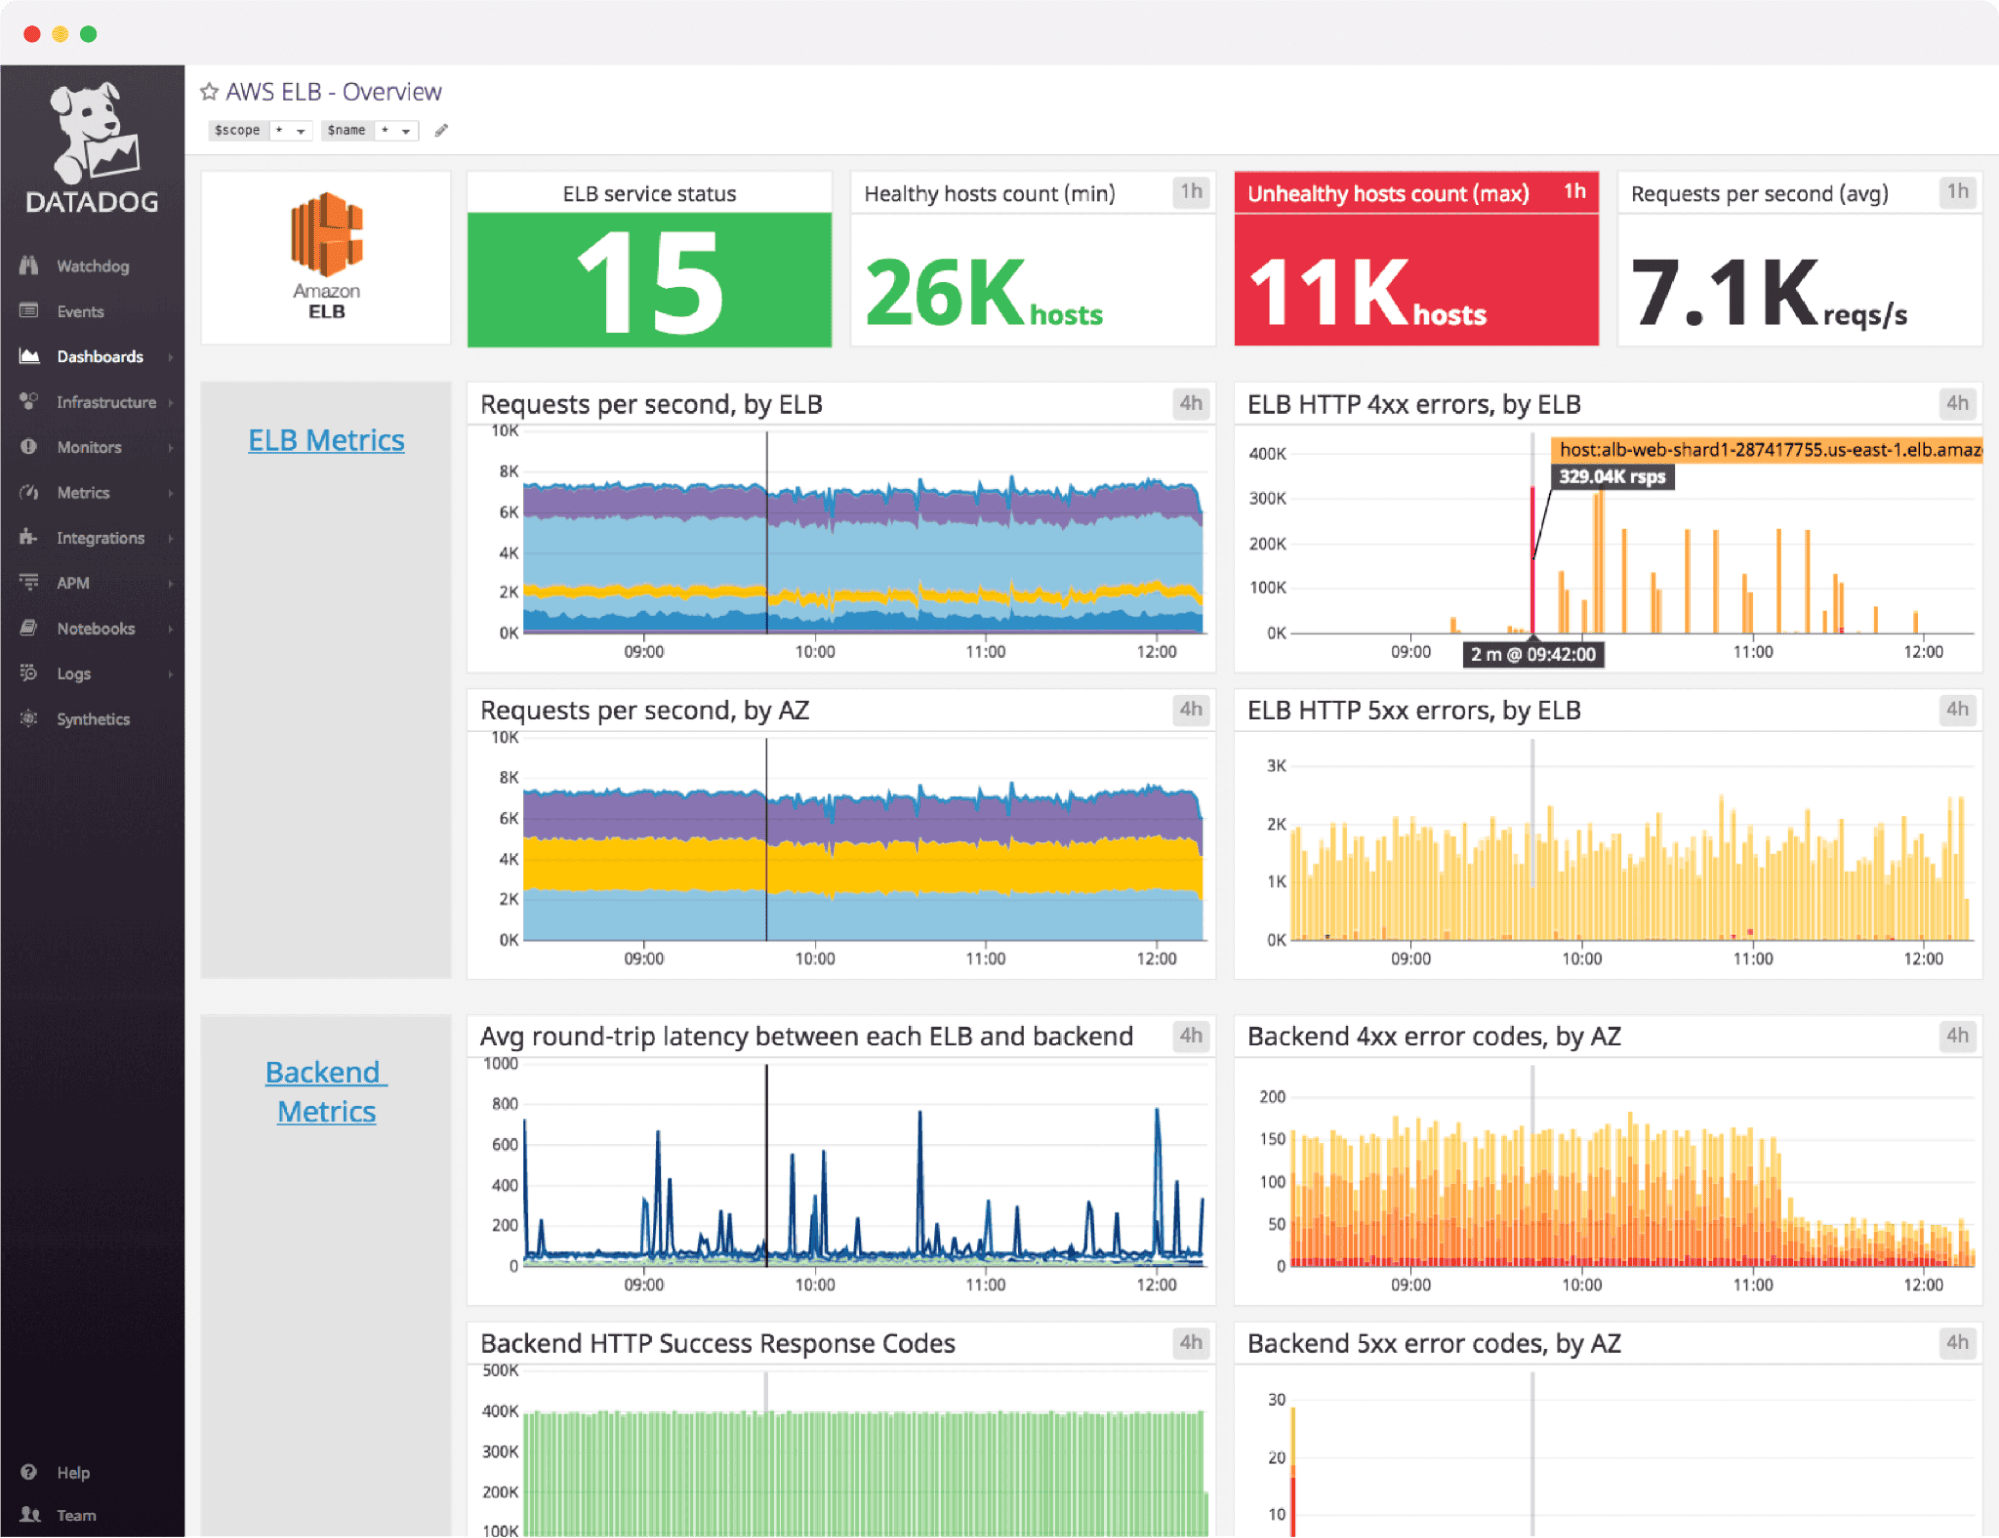
Datadog is the most polished all-in-one log management tool on the market. With 700+ out-of-the-box integrations, automatic log parsing via pipelines, ML-powered anomaly detection, and seamless correlation between logs, APM traces, and infrastructure metrics it's the gold standard for teams that want power without operational overhead.
Datadog's Log Explorer supports live tail, pattern clustering, and one-click pivoting from a log line to the associated distributed trace. Their Sensitive Data Scanner and Audit Trail features make it suitable for compliance-heavy environments.
Read our detailed comparison guide on OpenObserve VS Datadog
Key features:
Best for: Mid-market to enterprise teams wanting a fully managed, deeply integrated observability platform.
Type: Self-hosted & Cloud
Pricing: ~$150/GB/day ingested (volume pricing available)
Splunk defined the category of enterprise log management over a decade ago and remains the dominant choice for large-scale security operations and SIEM workloads. Its Search Processing Language (SPL) is extraordinarily expressive for complex analytics, threat hunting, and compliance reporting.
Splunk's ecosystem including SIEM, SOAR, Observability Cloud, and a vast marketplace of apps gives security teams an end-to-end platform that no other tool matches in depth.
Read our detailed comparison guide on OpenObserve VS Splunk
Key features:
Best for: Large enterprises with security-heavy workloads, regulatory compliance requirements, or existing Splunk investments.
Type: Open-source · Self-hosted & Grafana Cloud
Pricing: Free (OSS) / Grafana Cloud has a free tier
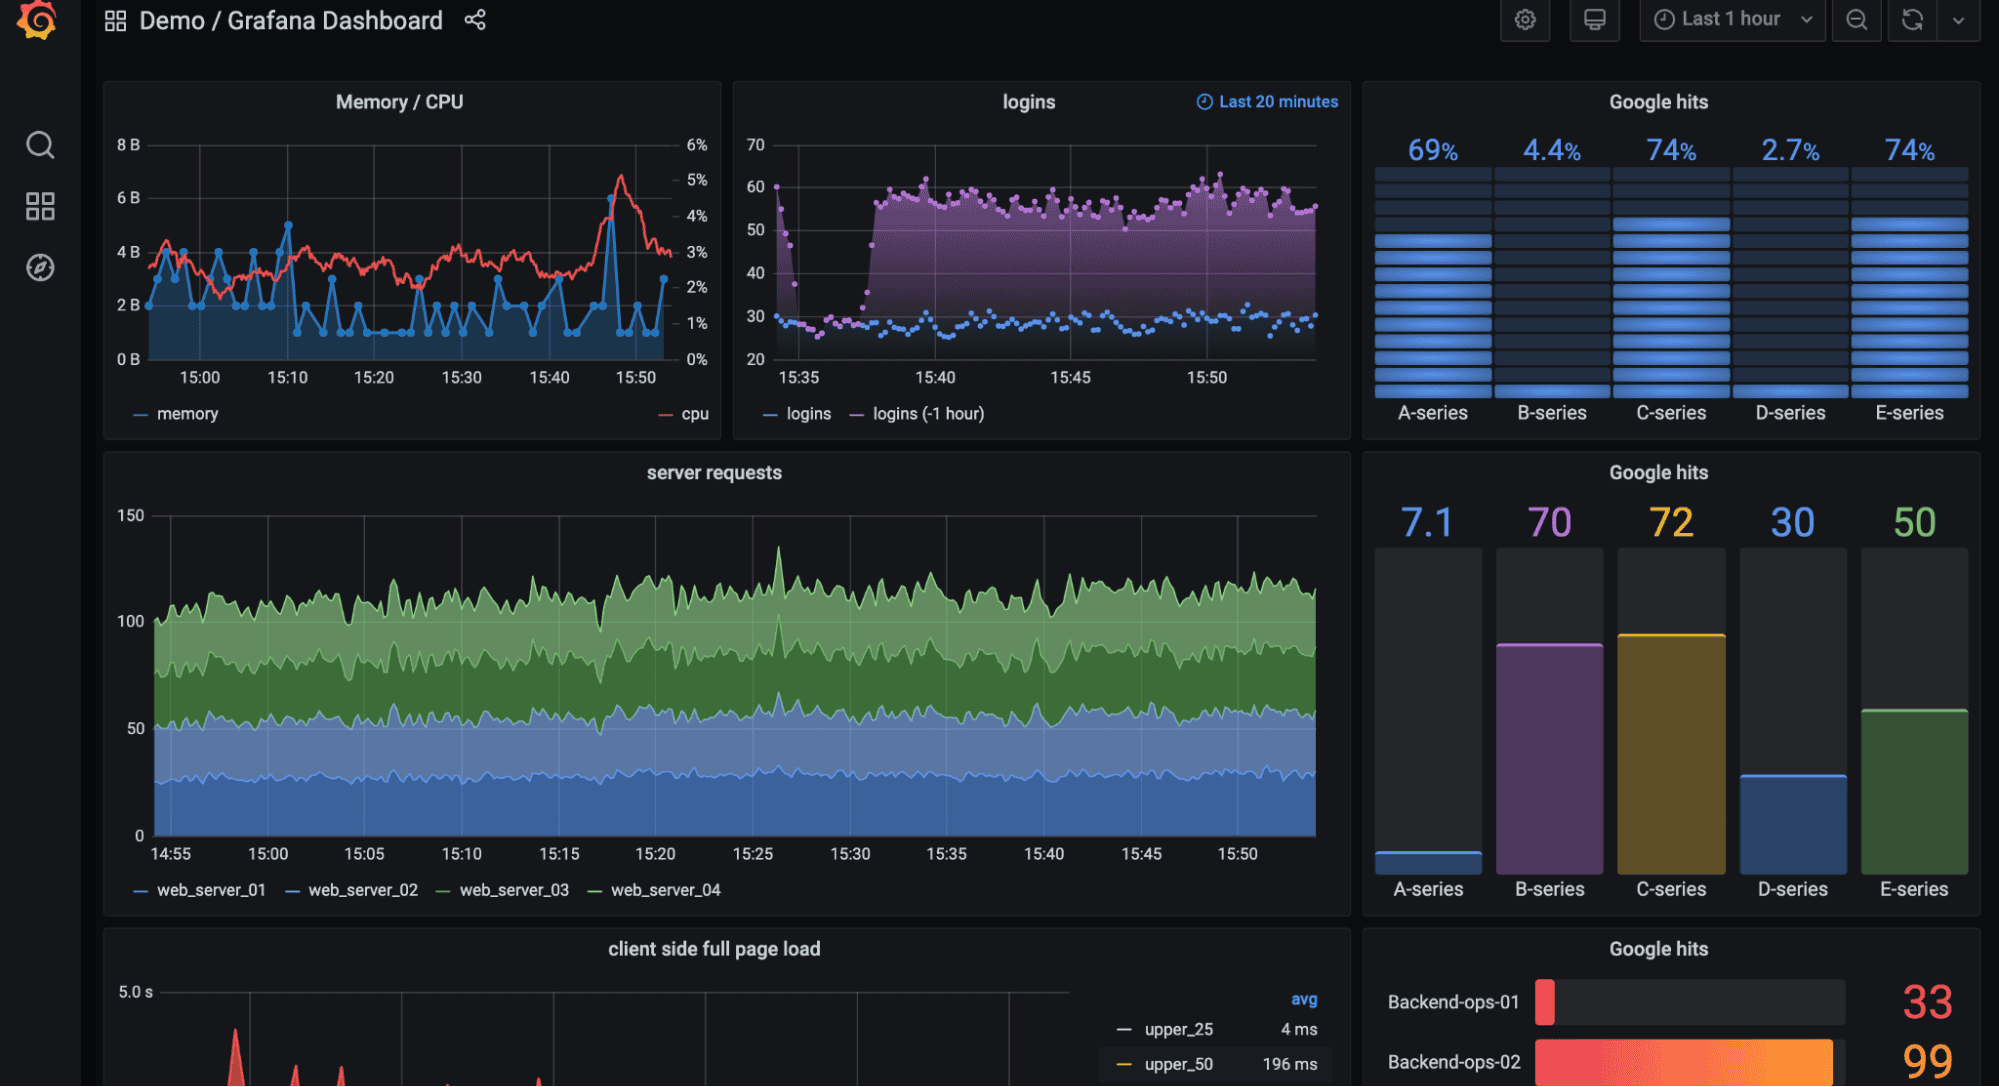
Grafana Loki takes a radically different architectural approach to log management: rather than indexing the full content of every log line, it only indexes metadata labels just like Prometheus does for metrics. This keeps storage and operational costs dramatically low, at the cost of some query flexibility.
Loki is the natural choice for teams already using Prometheus and Grafana, integrating seamlessly into the same label-based mental model and dashboarding layer.
Key features:
Best for: Kubernetes-native teams already invested in the Prometheus + Grafana observability stack.
Type: Open-source · Self-hosted & Elastic Cloud
Pricing: Free (OSS) / Elastic Cloud from $95/month
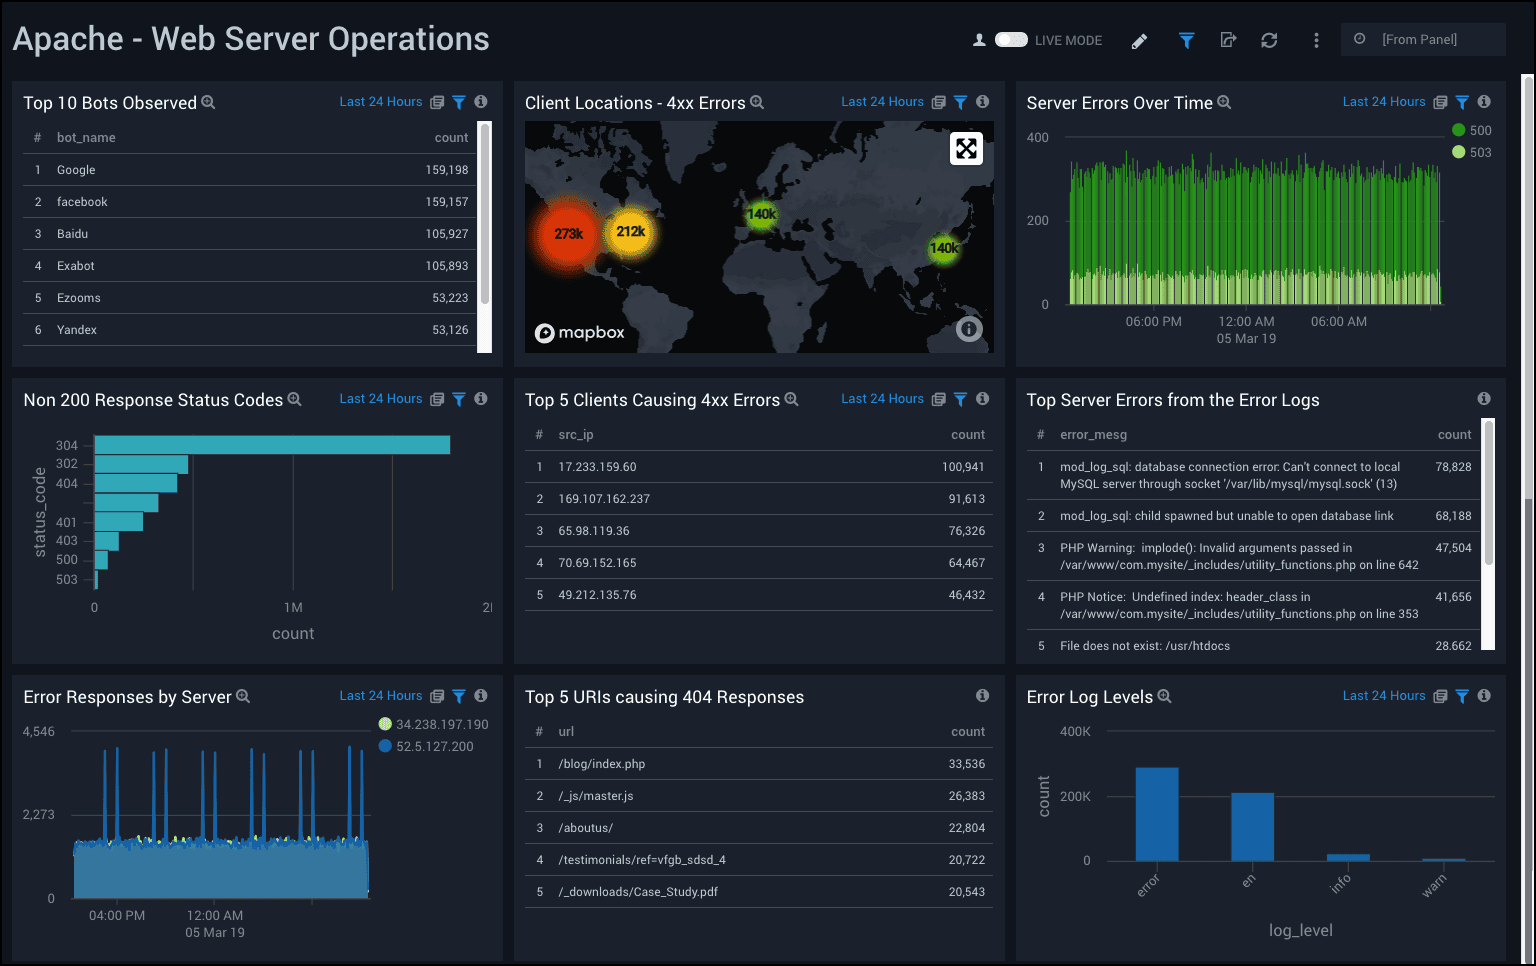
The ELK Stack Elasticsearch, Logstash, and Kibana, now extended with Beats agents remains one of the most widely deployed log management solutions in the world. Elasticsearch's inverted index powers near-instant full-text search across billions of log lines. Logstash offers a highly flexible ingest and transform pipeline. Kibana delivers rich, customizable dashboards.
Elastic has expanded significantly into ML-based anomaly detection, SIEM, APM, and endpoint security in recent years, making it more of a full observability platform than just a log aggregator.
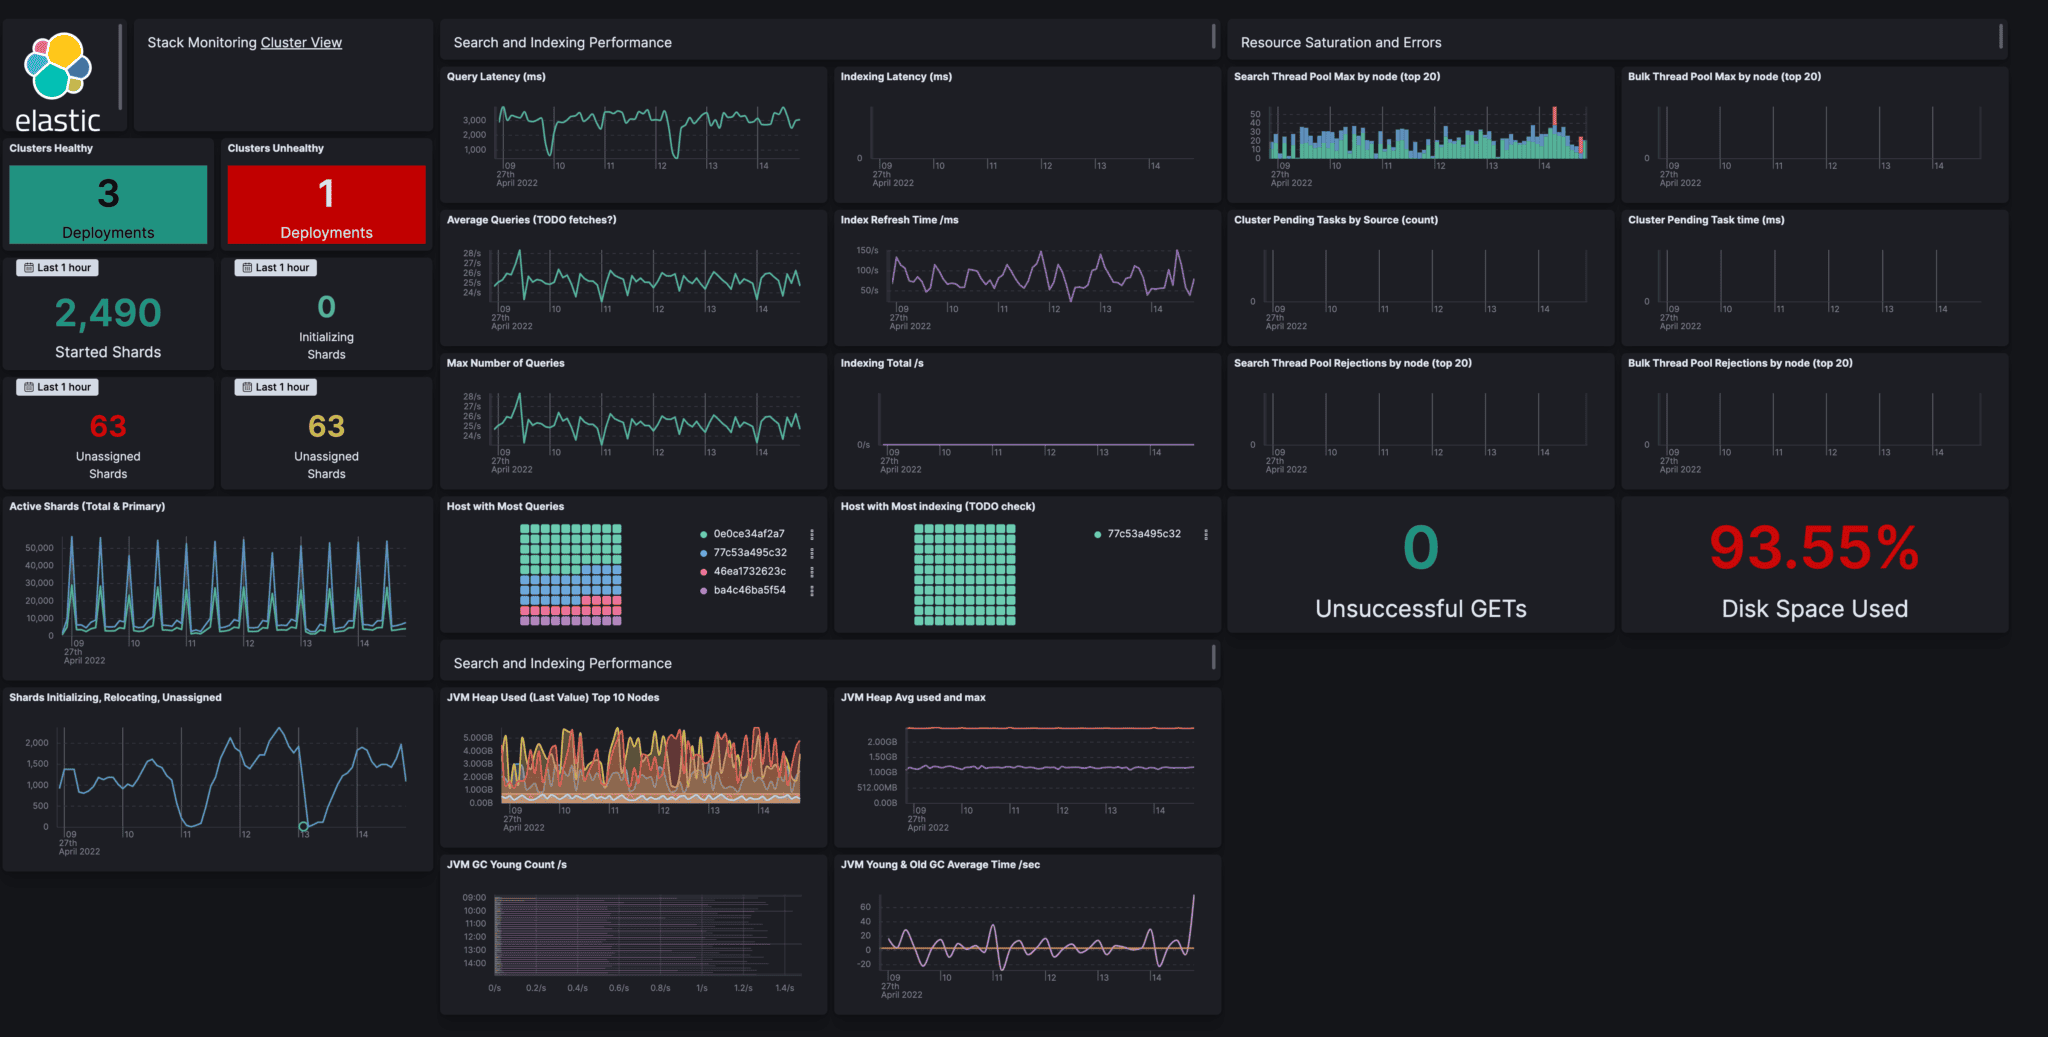
Key features:
Best for: Teams with complex ingest pipelines needing powerful full-text search, or organizations already running Elastic infrastructure.
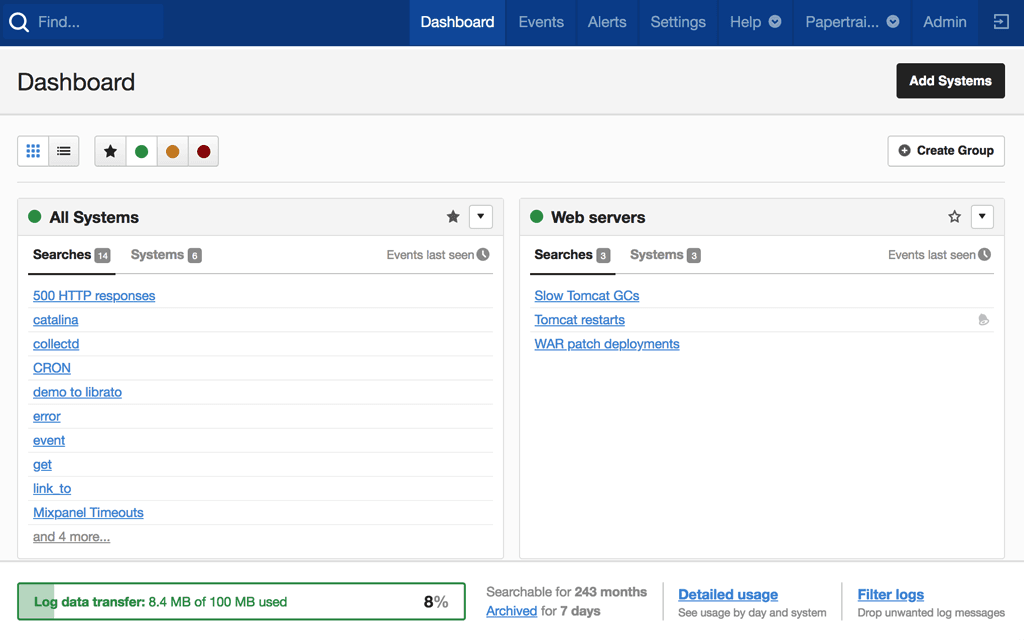
Type: SaaS
Pricing: Free (50MB/month) / Paid from $7/month
Papertrail (by SolarWinds) prioritizes one thing above all else: simplicity. You can be collecting logs and tailing them live in your browser within minutes of signing up with zero infrastructure to manage. It handles syslog, Heroku log drains, and custom application logs with minimal configuration.
For small teams, side projects, or any context where you just need logs to work without DevOps overhead, Papertrail delivers exactly that.
 Key features:
Best for: Small development teams, indie developers, Heroku-hosted apps, or any project where simplicity beats power.
Type: SaaS
Pricing: Free (500MB/day) / Enterprise pricing on request
Sumo Logic is a cloud-native SaaS platform with deep roots in security analytics and compliance. Its Continuous Intelligence Engine processes logs, metrics, and events in real time, with pre-built apps for AWS, Azure, GCP, Kubernetes, Salesforce, and hundreds of other platforms. It's a strong choice for industries with heavy compliance requirements finance, healthcare, retail.
Key features:
Best for: Compliance-heavy industries (finance, healthcare) operating across multiple cloud providers.
Type: Open-source · Self-hosted & Cloud
Pricing: Free (Open) / Enterprise from $1,250/month
Graylog is a mature, battle-tested self-hosted log management platform built on top of Elasticsearch/OpenSearch and MongoDB. It offers a well-rounded feature set pipeline processing, stream management, role-based access control, and multi-tenancy without the full complexity of rolling your own ELK stack from scratch.
Graylog has maintained a large open-source community for over a decade and offers a clear upgrade path from the free Open edition to the Enterprise tier.
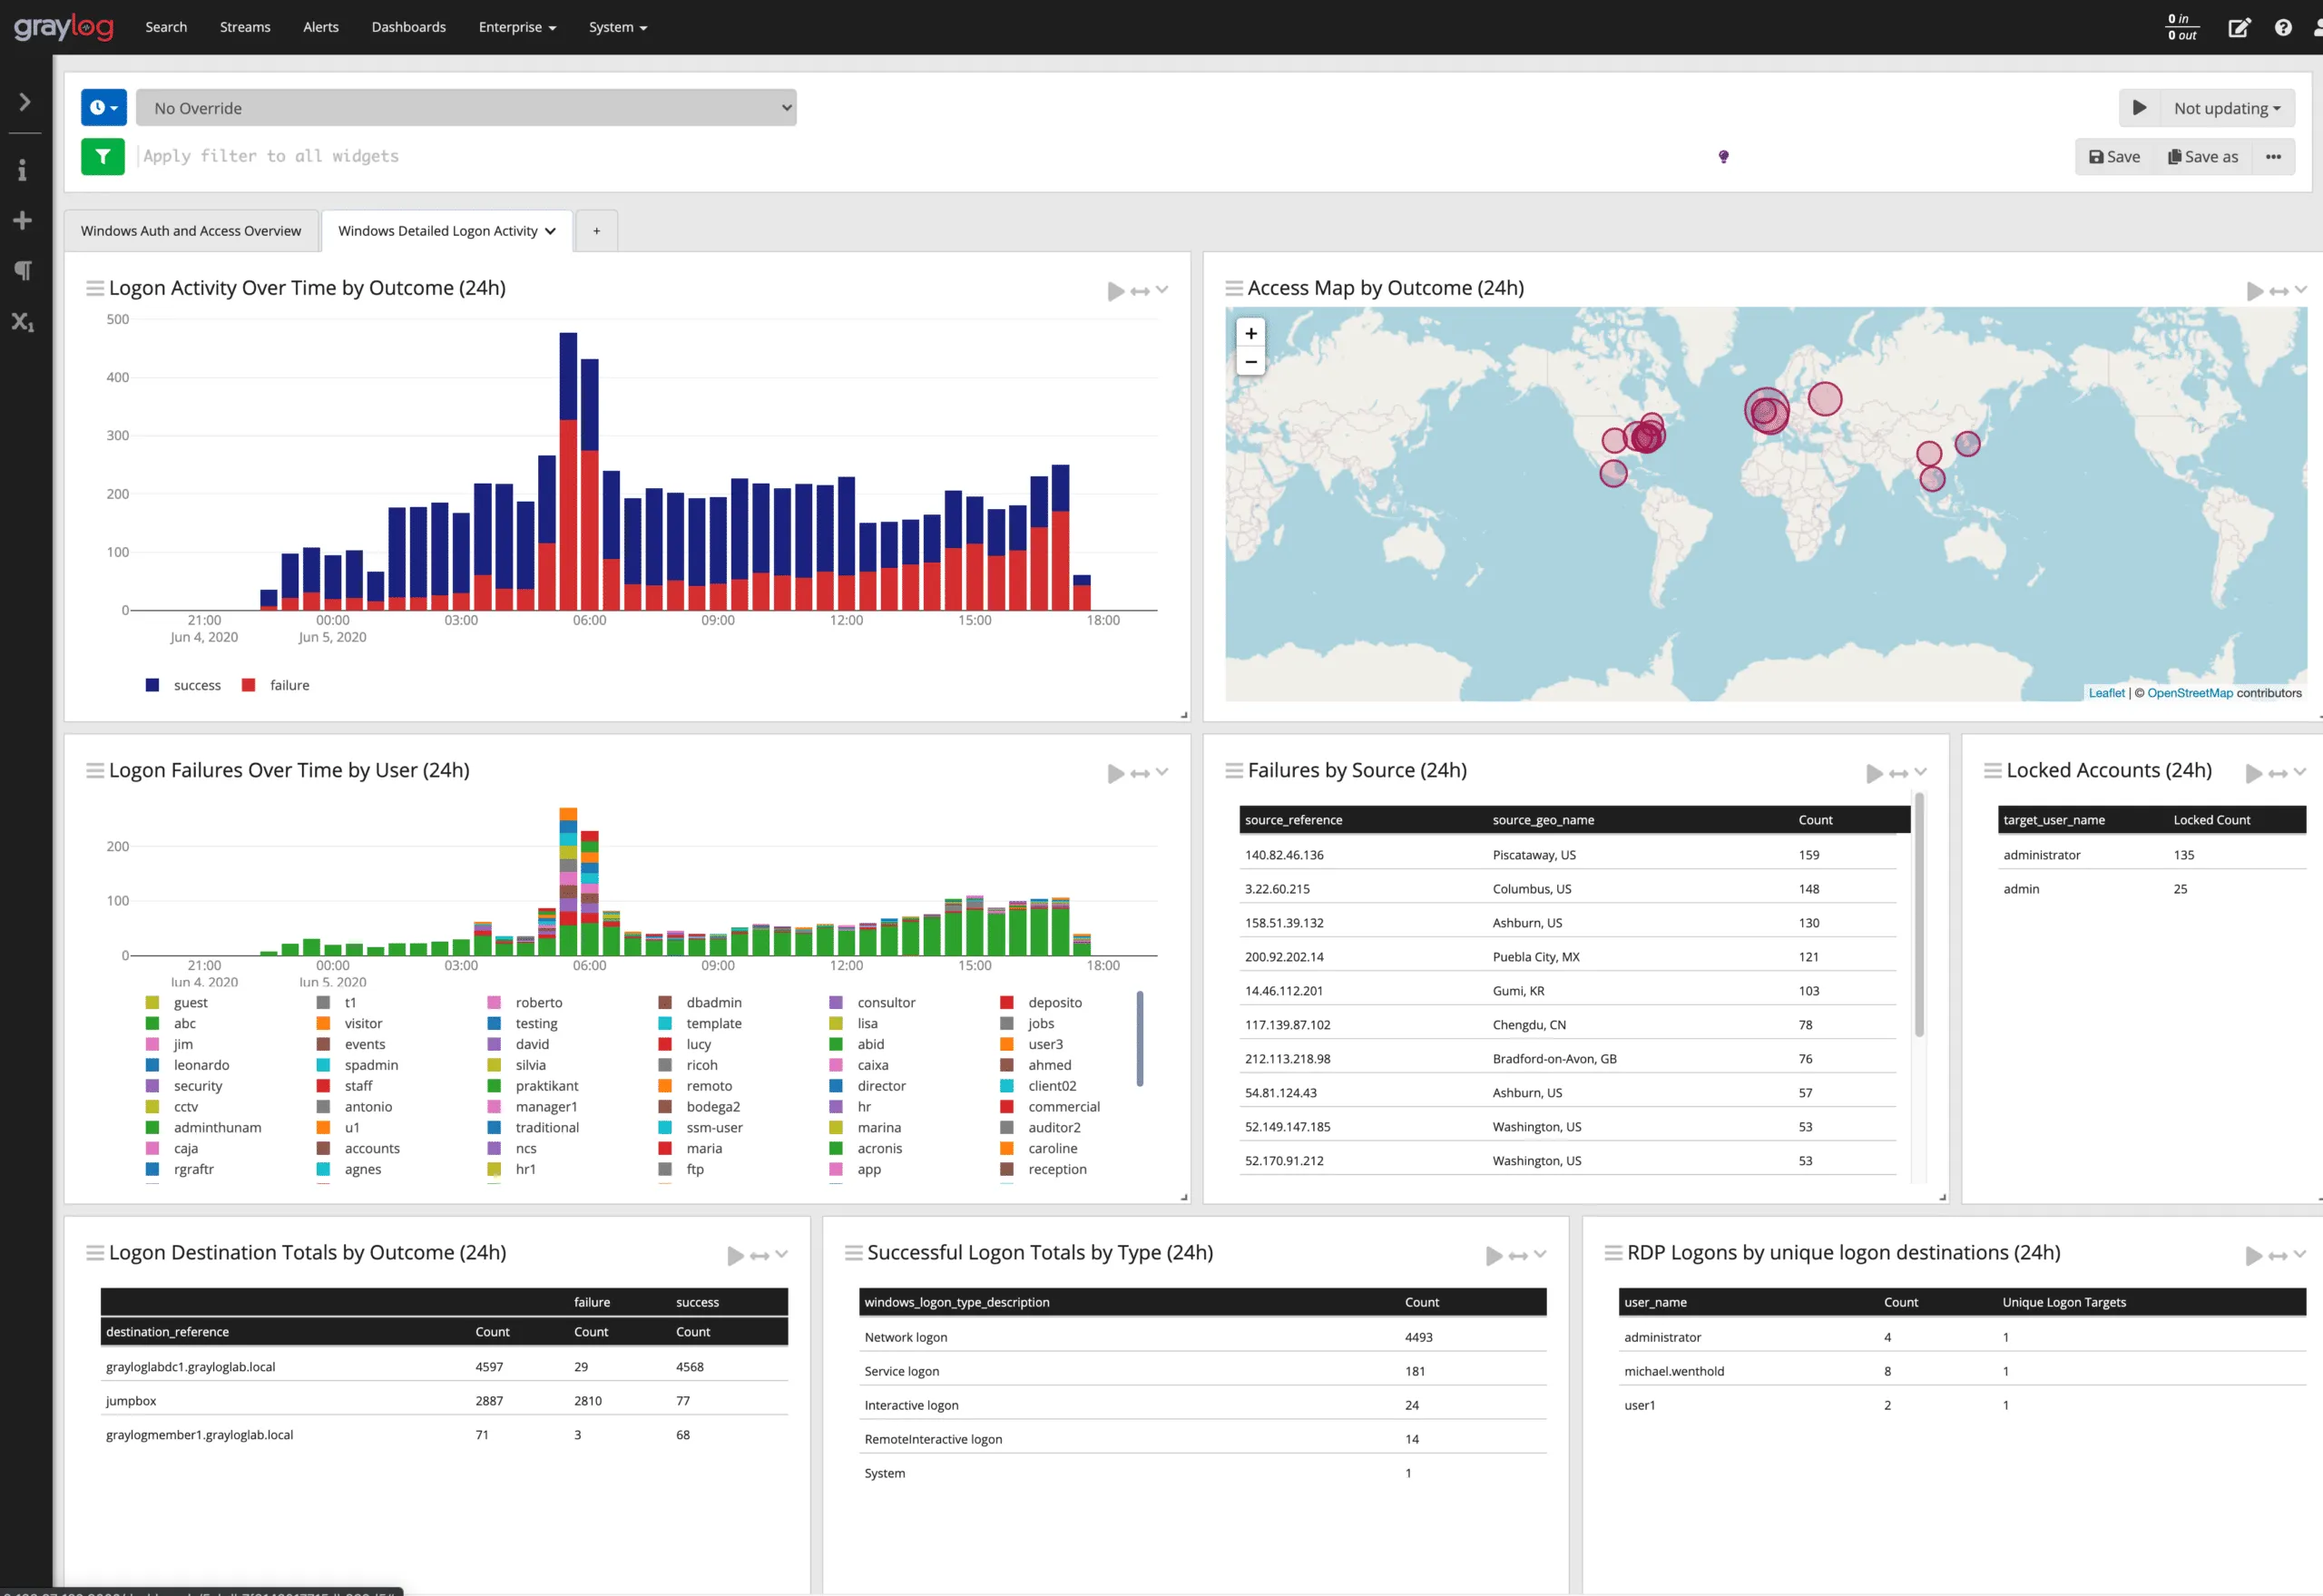
Key features:
Best for: Organizations needing self-hosted log management with strong access controls and a proven open-source foundation.
Type: SaaS
Pricing: Free (100GB/month) / $0.30/GB after
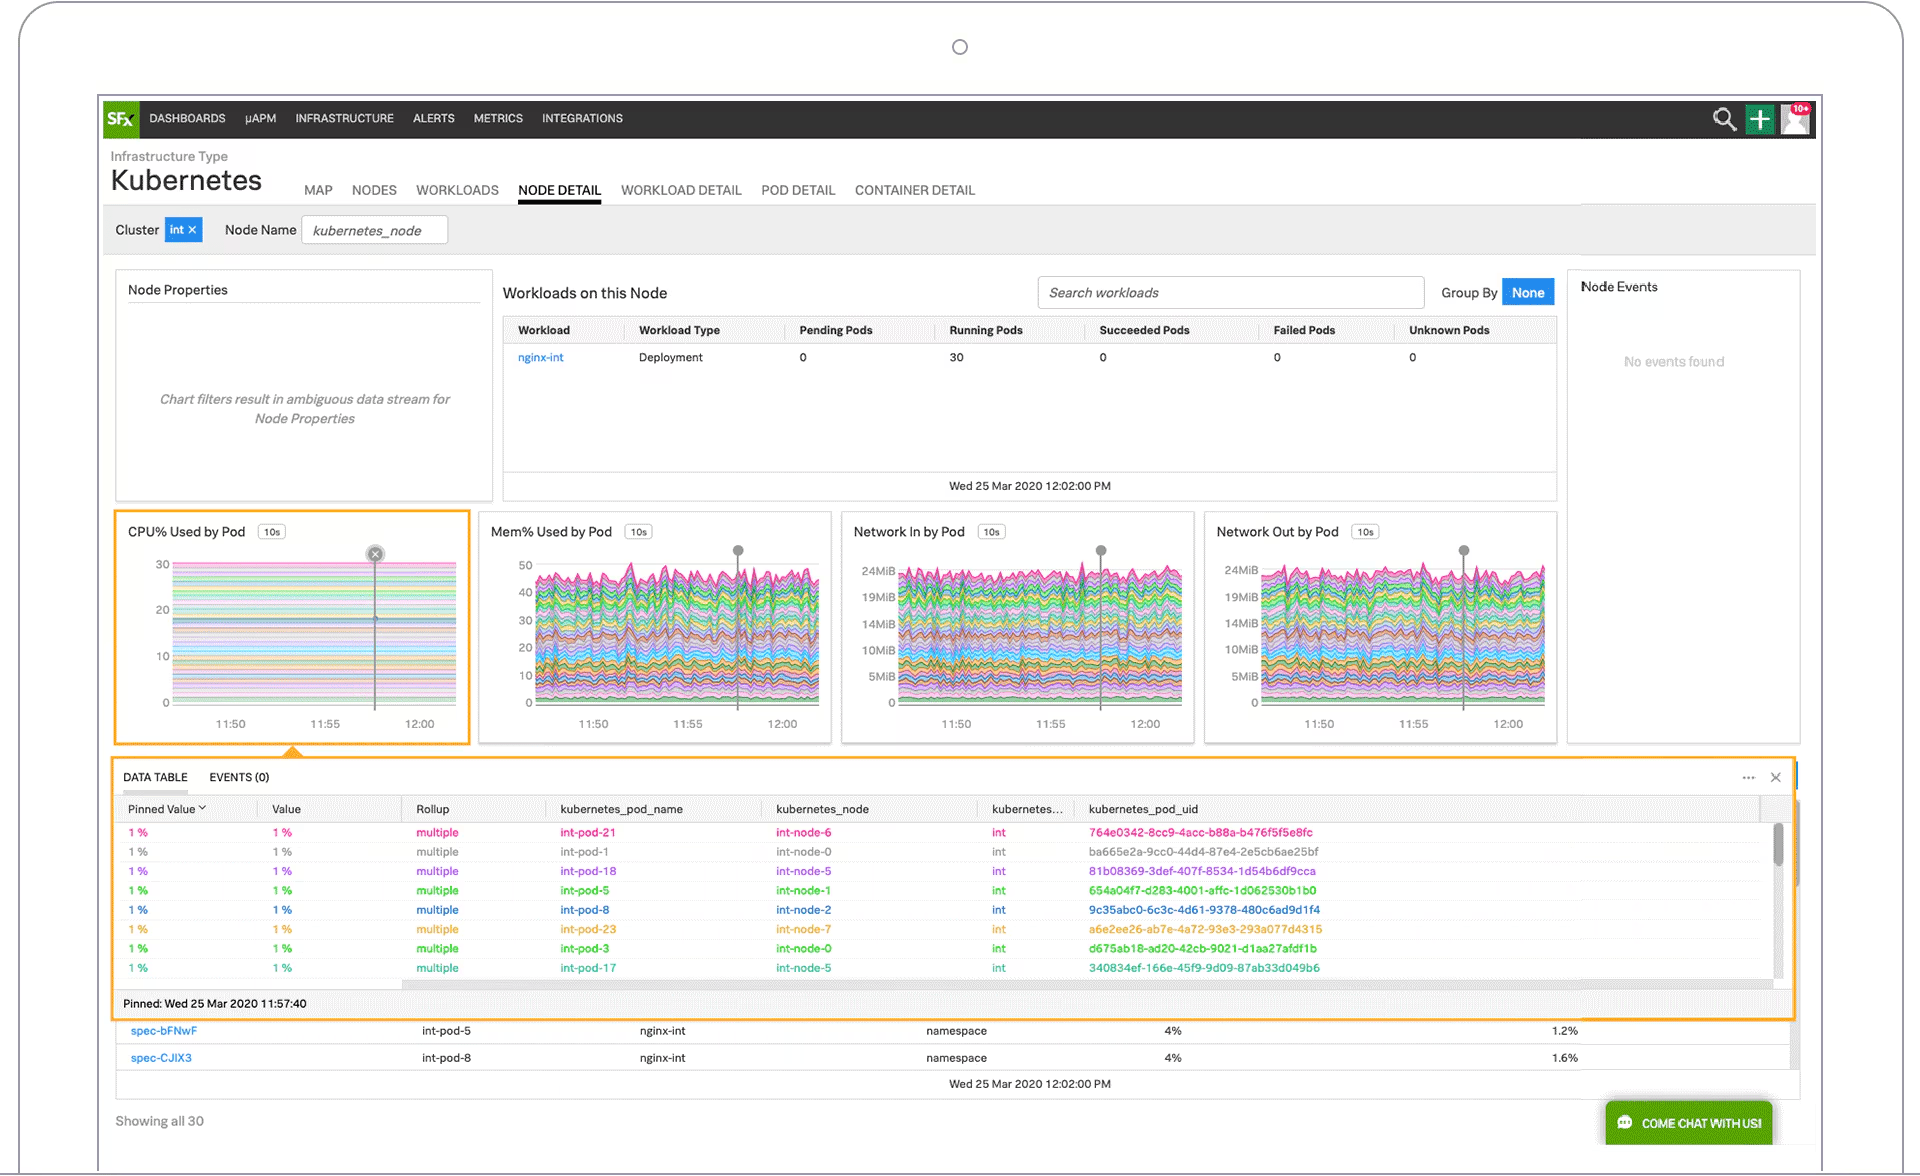
New Relic Logs is strongest when used as part of the broader New Relic platform. Its log-in-context feature connects individual log lines directly to distributed traces, errors, and infrastructure metrics dramatically reducing mean time to resolution (MTTR) during incidents. No other tool in this list makes the jump from a log line to a full distributed trace as seamlessly.
The 100GB/month free tier is the most generous among fully managed SaaS log management tools, making it accessible to smaller teams.
Read our detailed comparison guide on OpenObserve VS New Relic
Key features:
Best for: Teams already using New Relic for APM or infrastructure monitoring who want logs integrated into the same workflow.
With so many options, here's a practical framework:
1. Estimate your log volume. Under 10GB/day, almost any tool will work well. Above 100GB/day, cost-per-GB becomes the primary driver evaluate OpenObserve, Loki, or Graylog for cost efficiency.
2. Define your deployment constraints. Data sovereignty, air-gapped networks, or compliance requirements mean you need a self-hosted option: OpenObserve, ELK, Graylog, or Splunk Enterprise. No such constraints? A SaaS platform removes all operational overhead.
3. Map your existing stack. Already on Prometheus + Grafana? Loki is the natural fit. On Datadog for APM? Their log product is unbeatable for correlated incident investigation. Using Kubernetes heavily? Loki or OpenObserve integrate well with OpenTelemetry.
4. Define your query requirements. Need fast full-text search over unstructured logs? Elasticsearch or OpenObserve. Need SQL queries? Logtail or OpenObserve. Need a specialized security query language? Splunk's SPL.
5. Run a proof of concept. No comparison article replaces testing with your real data. Run a 2-week POC at realistic log volume and test ingestion, query latency, alert reliability, and total cost before committing.
The right log management tool reduces incident MTTR, cuts infrastructure costs, and gives your team full visibility across your stack. The wrong tool quietly drains your budget or gets abandoned by engineers who find it too painful to use.
Start with your constraints volume, compliance, deployment model then shortlist two or three tools from this guide and run a genuine proof of concept with real data. Most tools offer free tiers or trials that make this easy.
If you're looking for a modern, cost-efficient open-source log management tool that covers logs, metrics, and traces in a single platform, OpenObserve is worth putting at the top of your evaluation list.
Log management focuses specifically on collecting, storing, and searching log data. Observability is a broader discipline encompassing logs, metrics, and distributed traces together, enabling engineers to understand the internal state of a system from its outputs. Many modern log management tools including Datadog, New Relic, and OpenObserve now cover all three pillars.
OpenObserve and Grafana Loki are both excellent free, open-source log management tools for self-hosted deployments. Among fully managed SaaS platforms, New Relic offers the most generous free tier at 100GB/month.
For operational debugging, 30–90 days of hot (searchable) retention is typically sufficient. Security and compliance frameworks like PCI DSS, HIPAA, and SOC 2 often require 1 year or more. Most log management tools support tiered retention keeping recent logs in fast storage and archiving older logs to object storage like S3.
Yes, selectively. ELK remains powerful for full-text search and complex ingest pipelines. However, resource requirements and Elastic's licensing changes have pushed many teams toward OpenSearch, Loki, or OpenObserve. If you need Elasticsearch-quality search without the cost and complexity, OpenObserve is worth evaluating as a direct alternative.
CloudWatch works well for AWS-only workloads at low-to-moderate volume. At scale, it becomes expensive and lacks cross-platform support, advanced analytics, and rich visualization. Most growing engineering teams migrate to a dedicated log management tool for better performance, cost control, and flexibility across cloud providers.
Passionate about observability, AI systems, and cloud-native tools. All in on DevOps and improving the developer experience.


