Mastering Windows IIS Logging: A Comprehensive Beginner's Guide

Sampath Siva Kumar Boddeti
November 13, 2024
10 min read
Don’t forget to share!
Try OpenObserve Cloud today for more efficient and performant observability.
Are you looking to unlock the full potential of Windows IIS logging? Whether you're a system admin, web developer, or IT enthusiast, understanding IIS logging is key to monitoring and optimizing your web server's performance. In this comprehensive guide, we’ll take you through everything you need to know from setting up IIS and hosting custom sites to collecting, analyzing, and parsing logs with OpenObserve. By the end of this blog, you’ll have the tools and techniques to keep your IIS server running smoothly while gaining actionable insights from your logs.
In this blog, we will cover:
Internet Information Services (IIS) is a powerful and flexible web server developed by Microsoft, widely used for hosting websites, applications, and services on Windows machines. With its intuitive interface and robust support for web technologies like ASP.NET and PHP, IIS is an essential tool for organizations looking to deploy web-based content efficiently.
IIS logs are essential for understanding how your web server is performing and diagnosing issues with your website or application. Logs help you monitor server health, track user activity, and troubleshoot errors efficiently.
Key Features:
Common Use Cases:
Let’s walk through the steps to get IIS up and running, configure logging, and set up your first website.
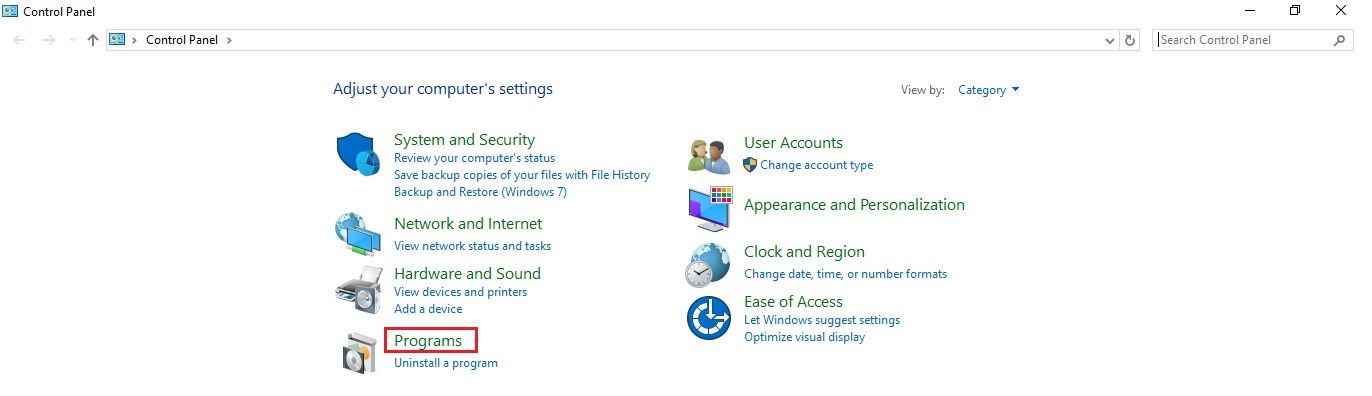
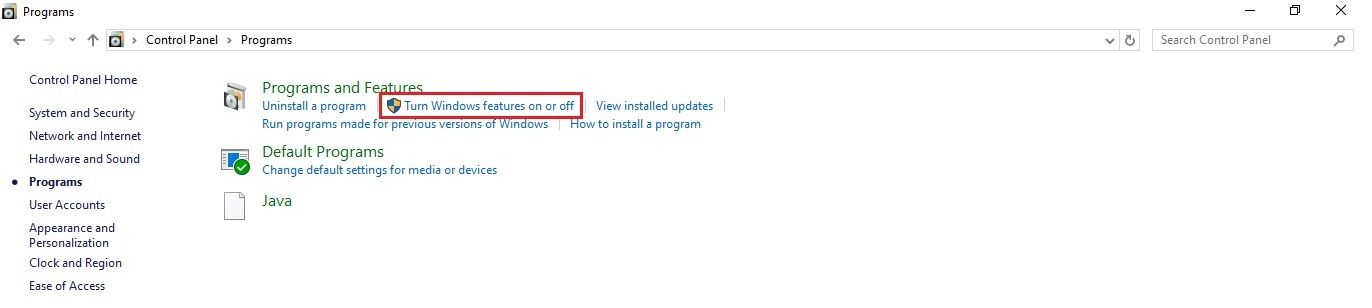
To start, we need to enable IIS on your Windows machine. Here's how:
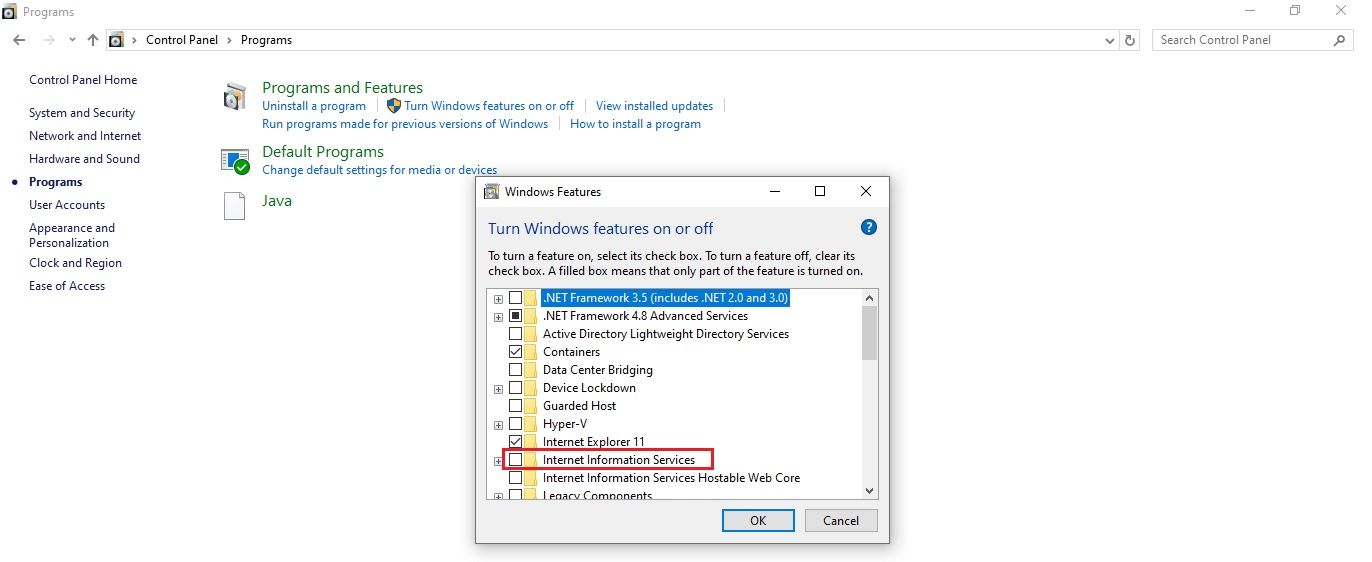
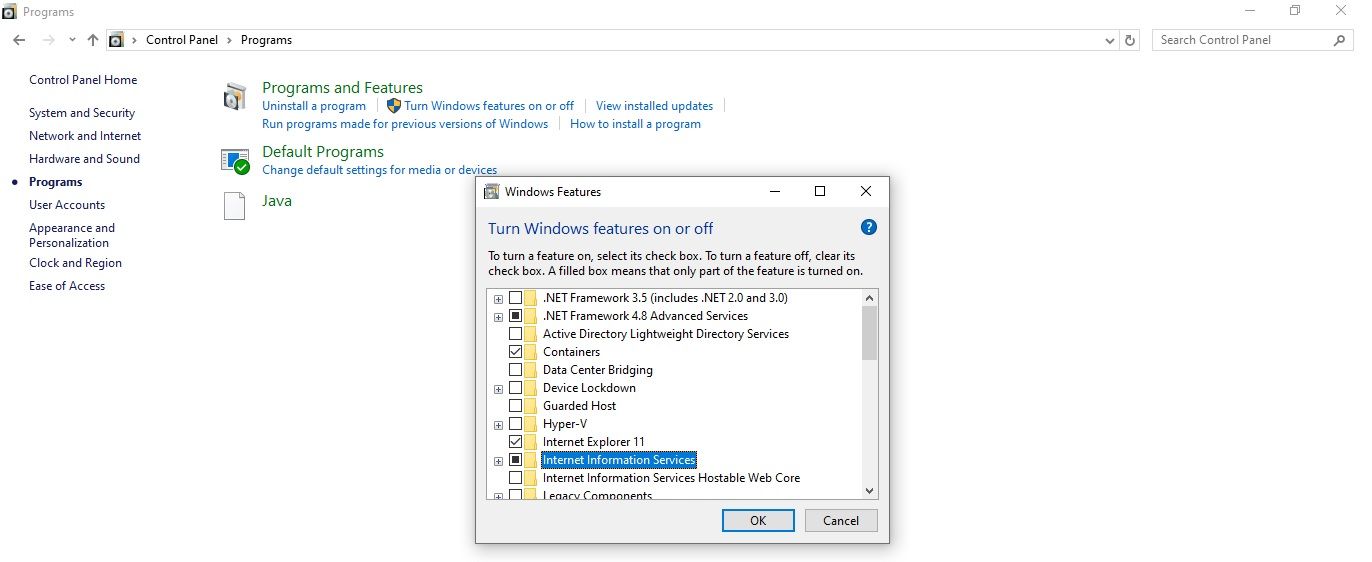
Go to Control Panel > Programs > Turn Windows features on or off, check Internet Information Services, and click OK.
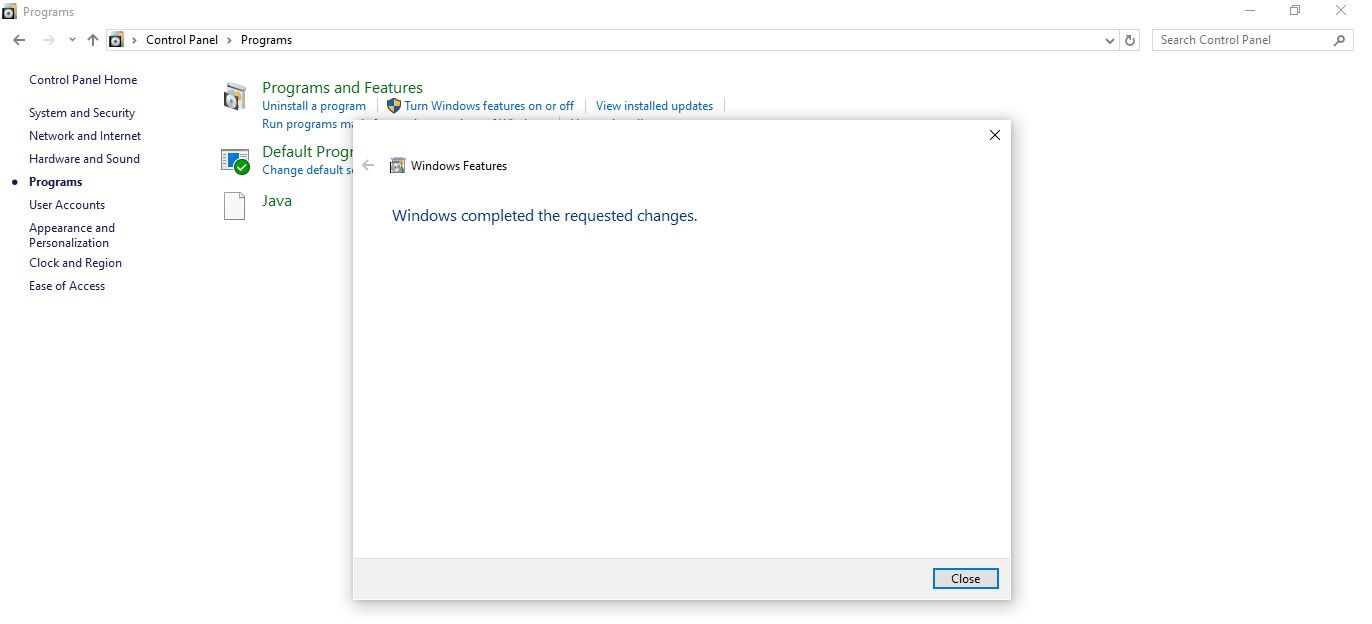
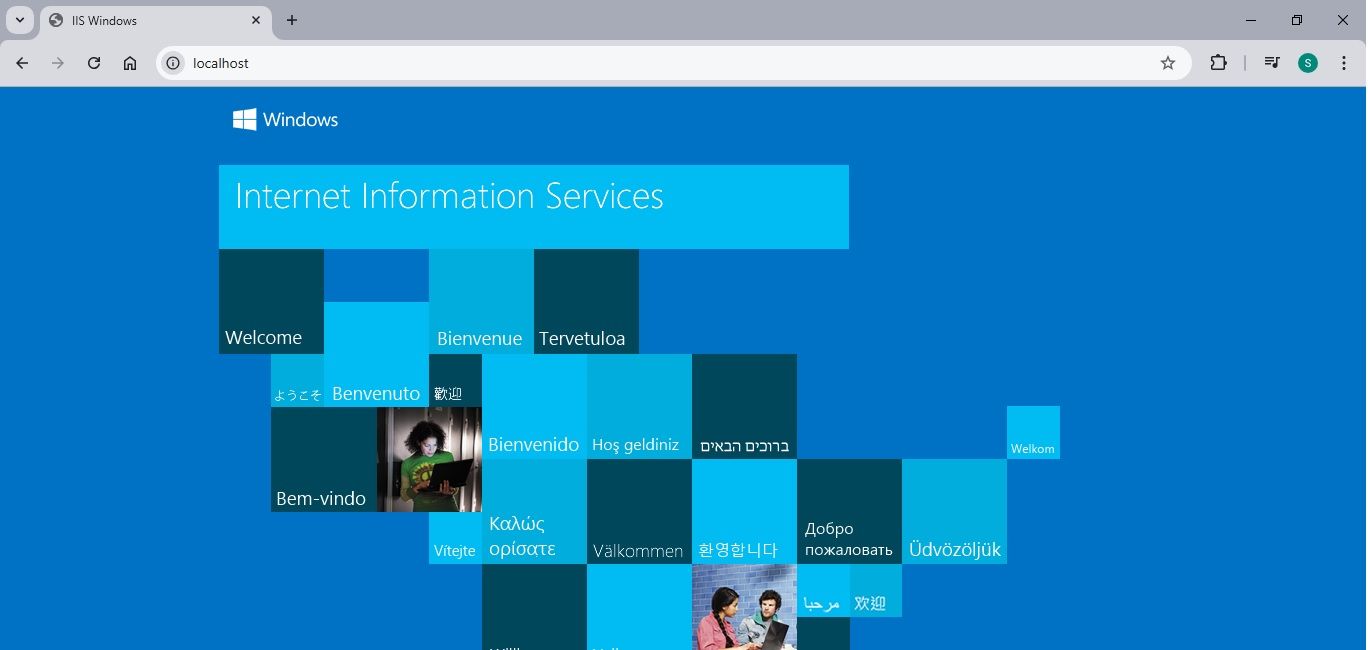
Congratulations, IIS is now enabled! Verify its installation by opening http://localhost/ in your web browser, which should display the default IIS webpage.
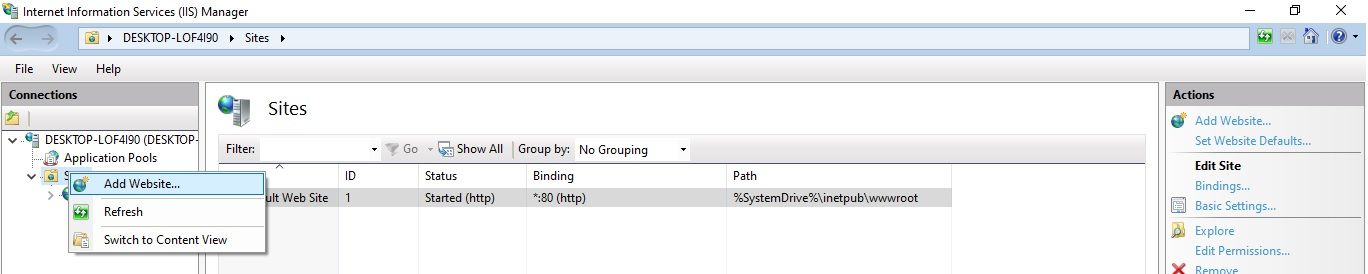
In this section, we'll walk you through creating and hosting a custom website in IIS, then associating it with a custom domain (e.g., o2.com) on your Windows machine by modifying the hosts file.
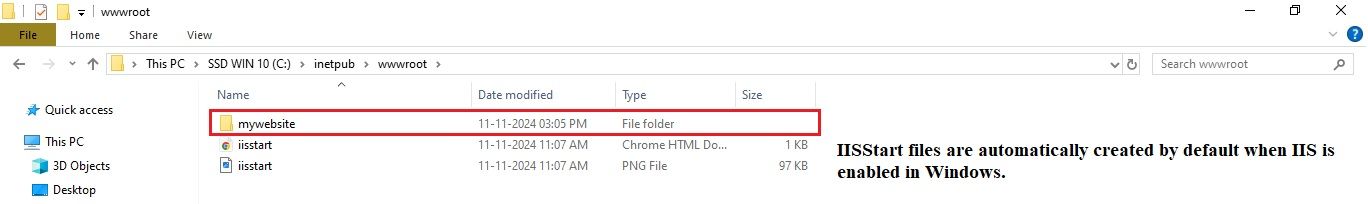
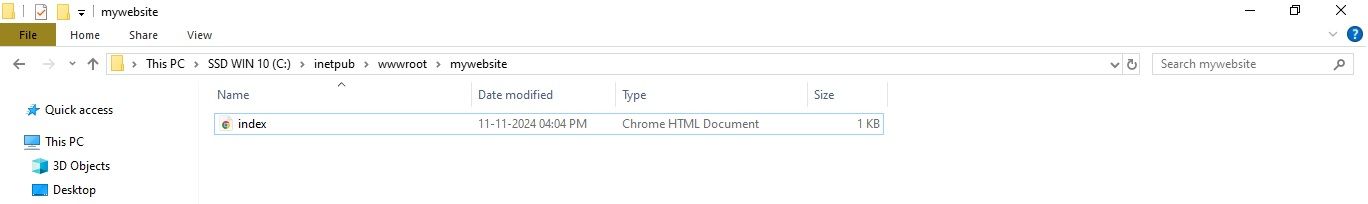
First, create a folder where your website files will be stored. In this case, let's create a folder named mywebsite under the default IIS directory C:\inetpub\wwwroot\mywebsite
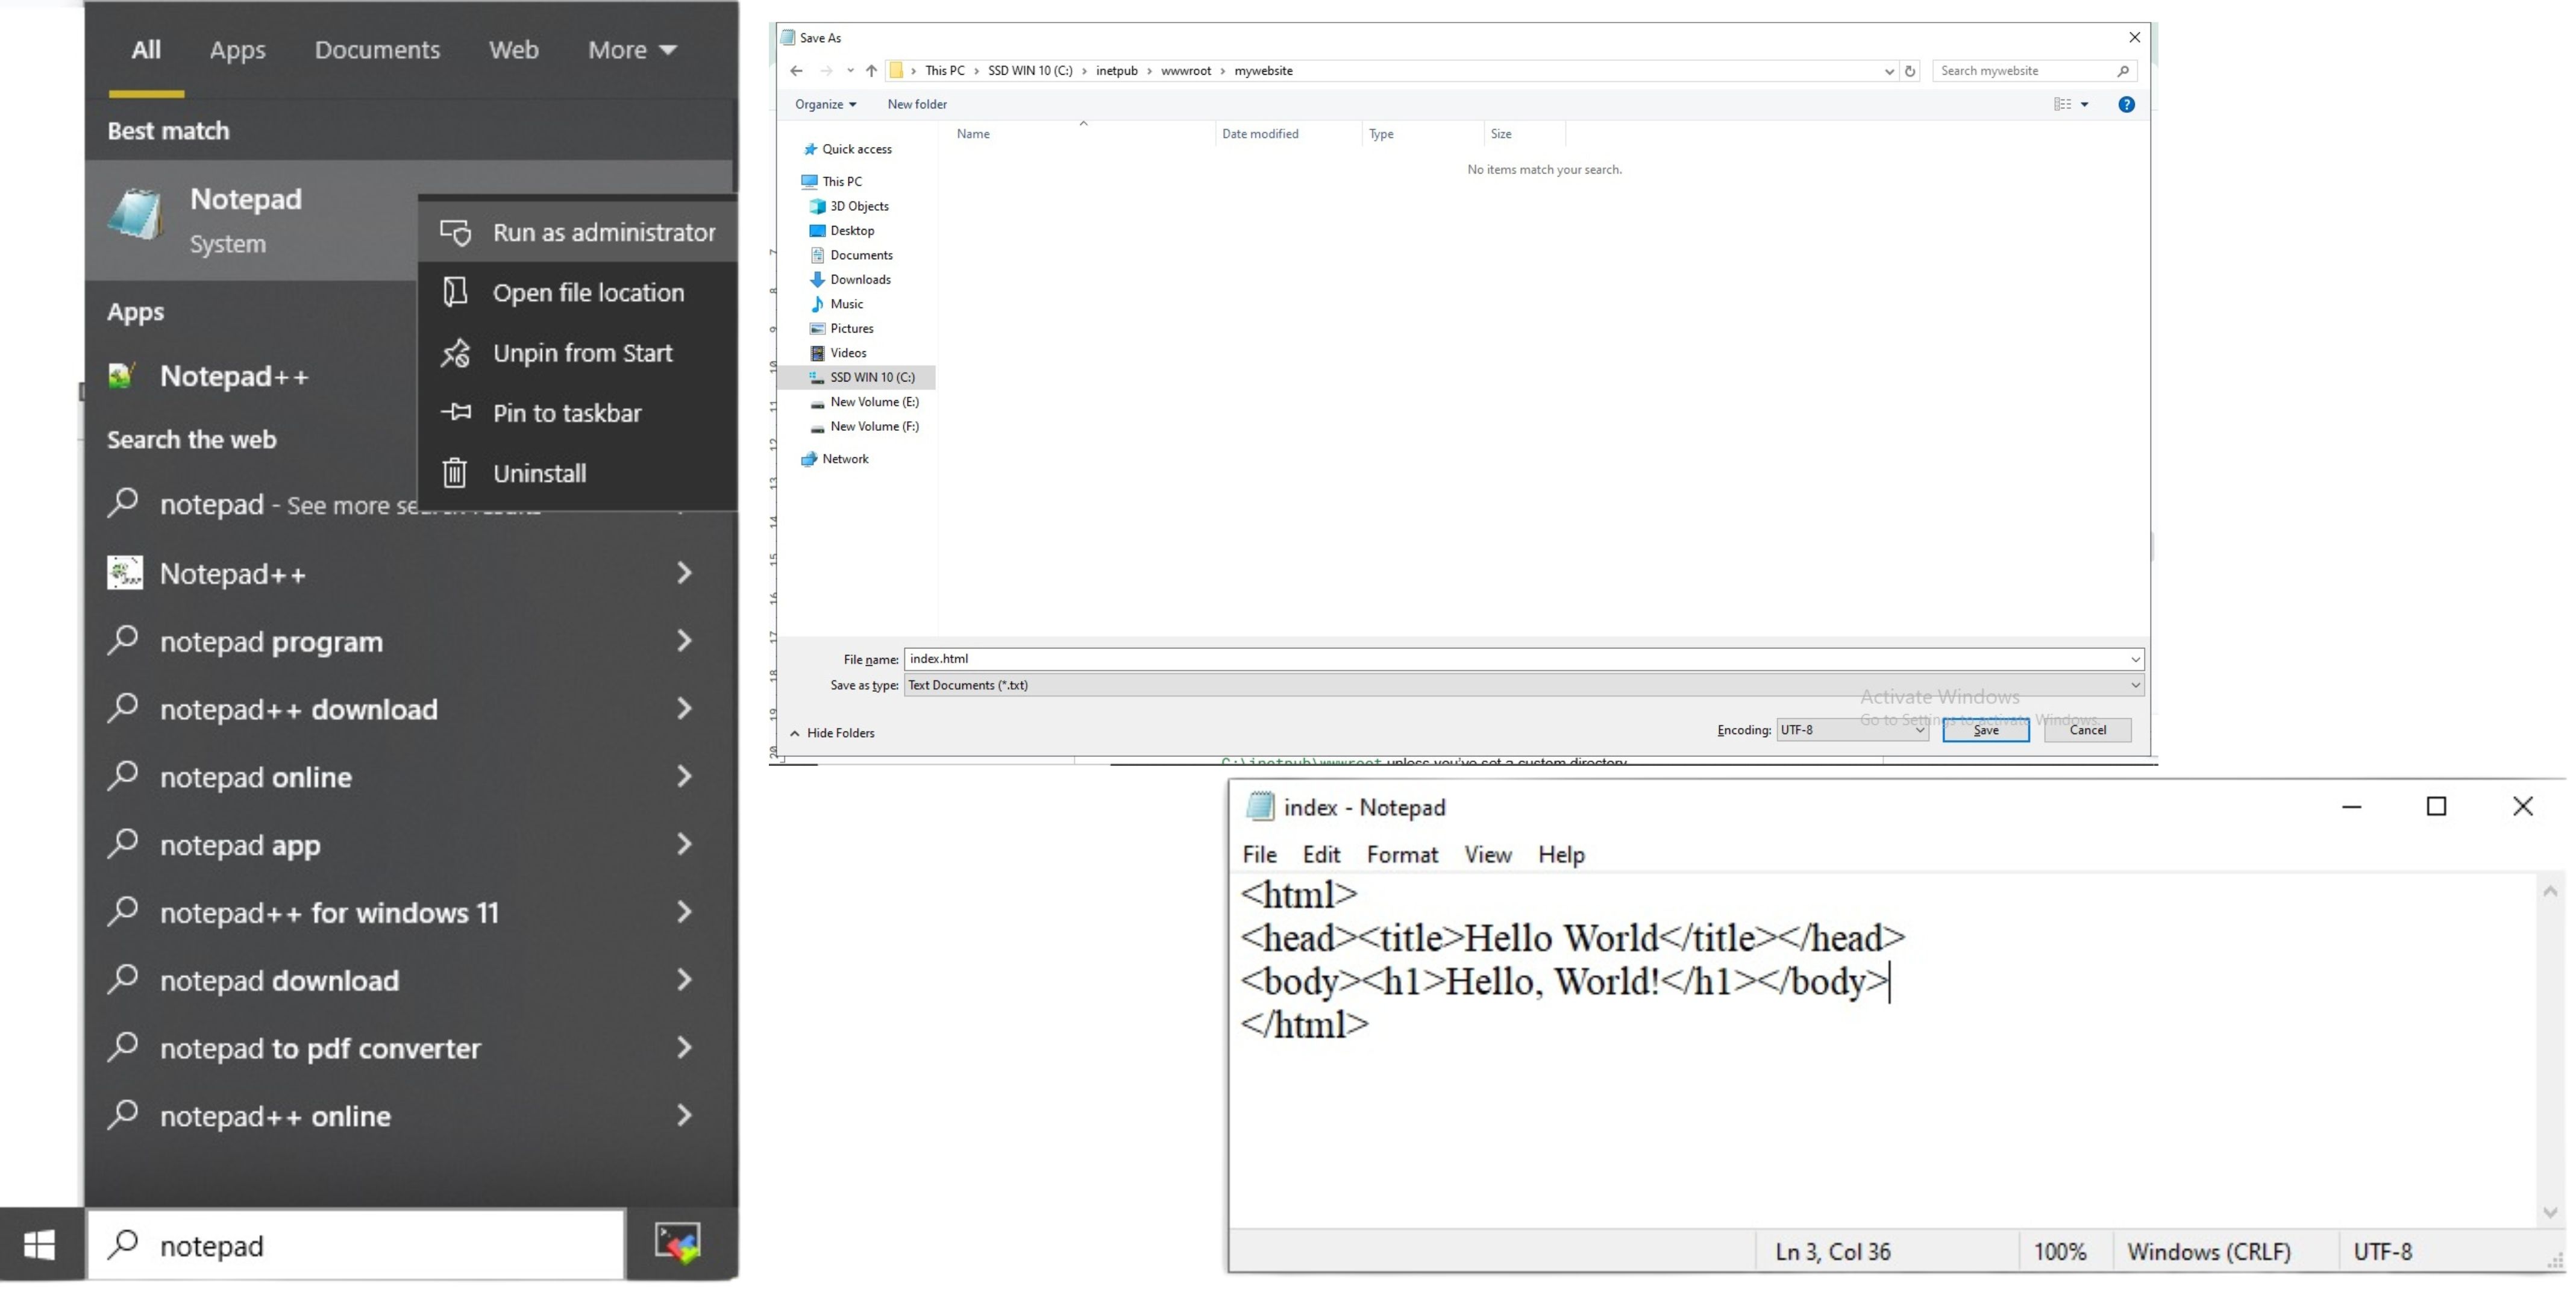
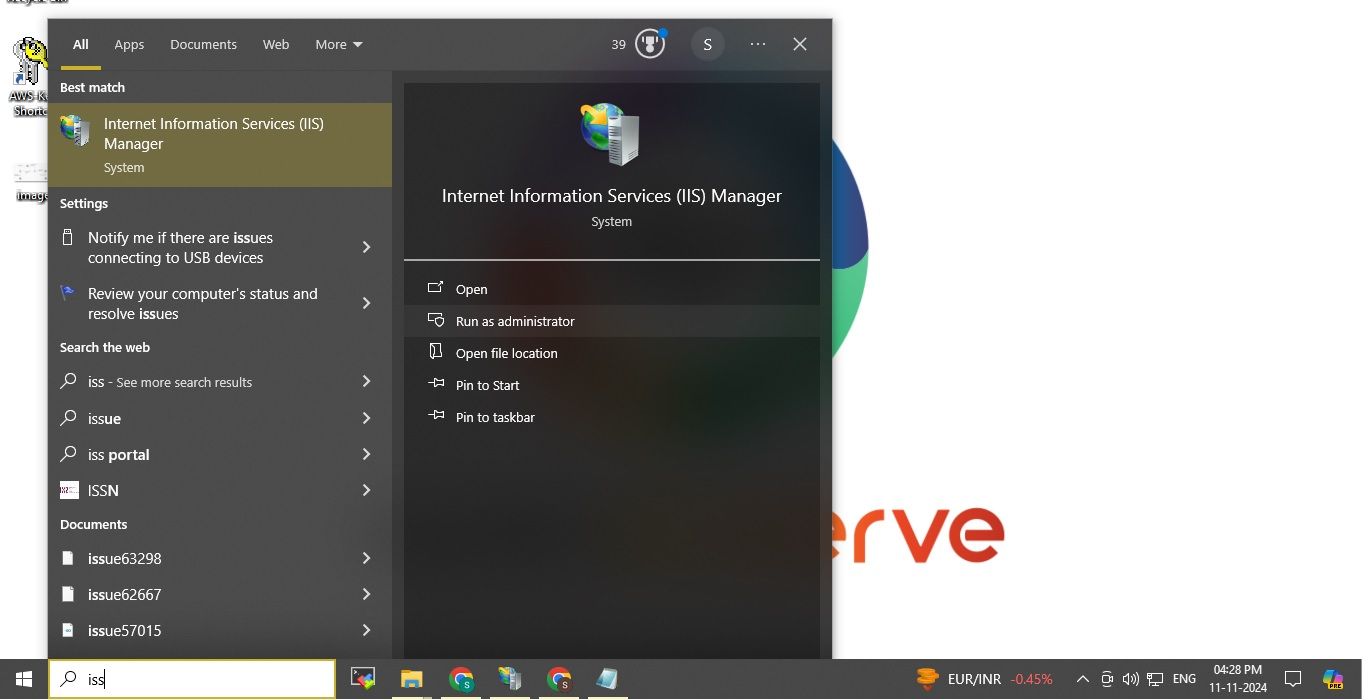
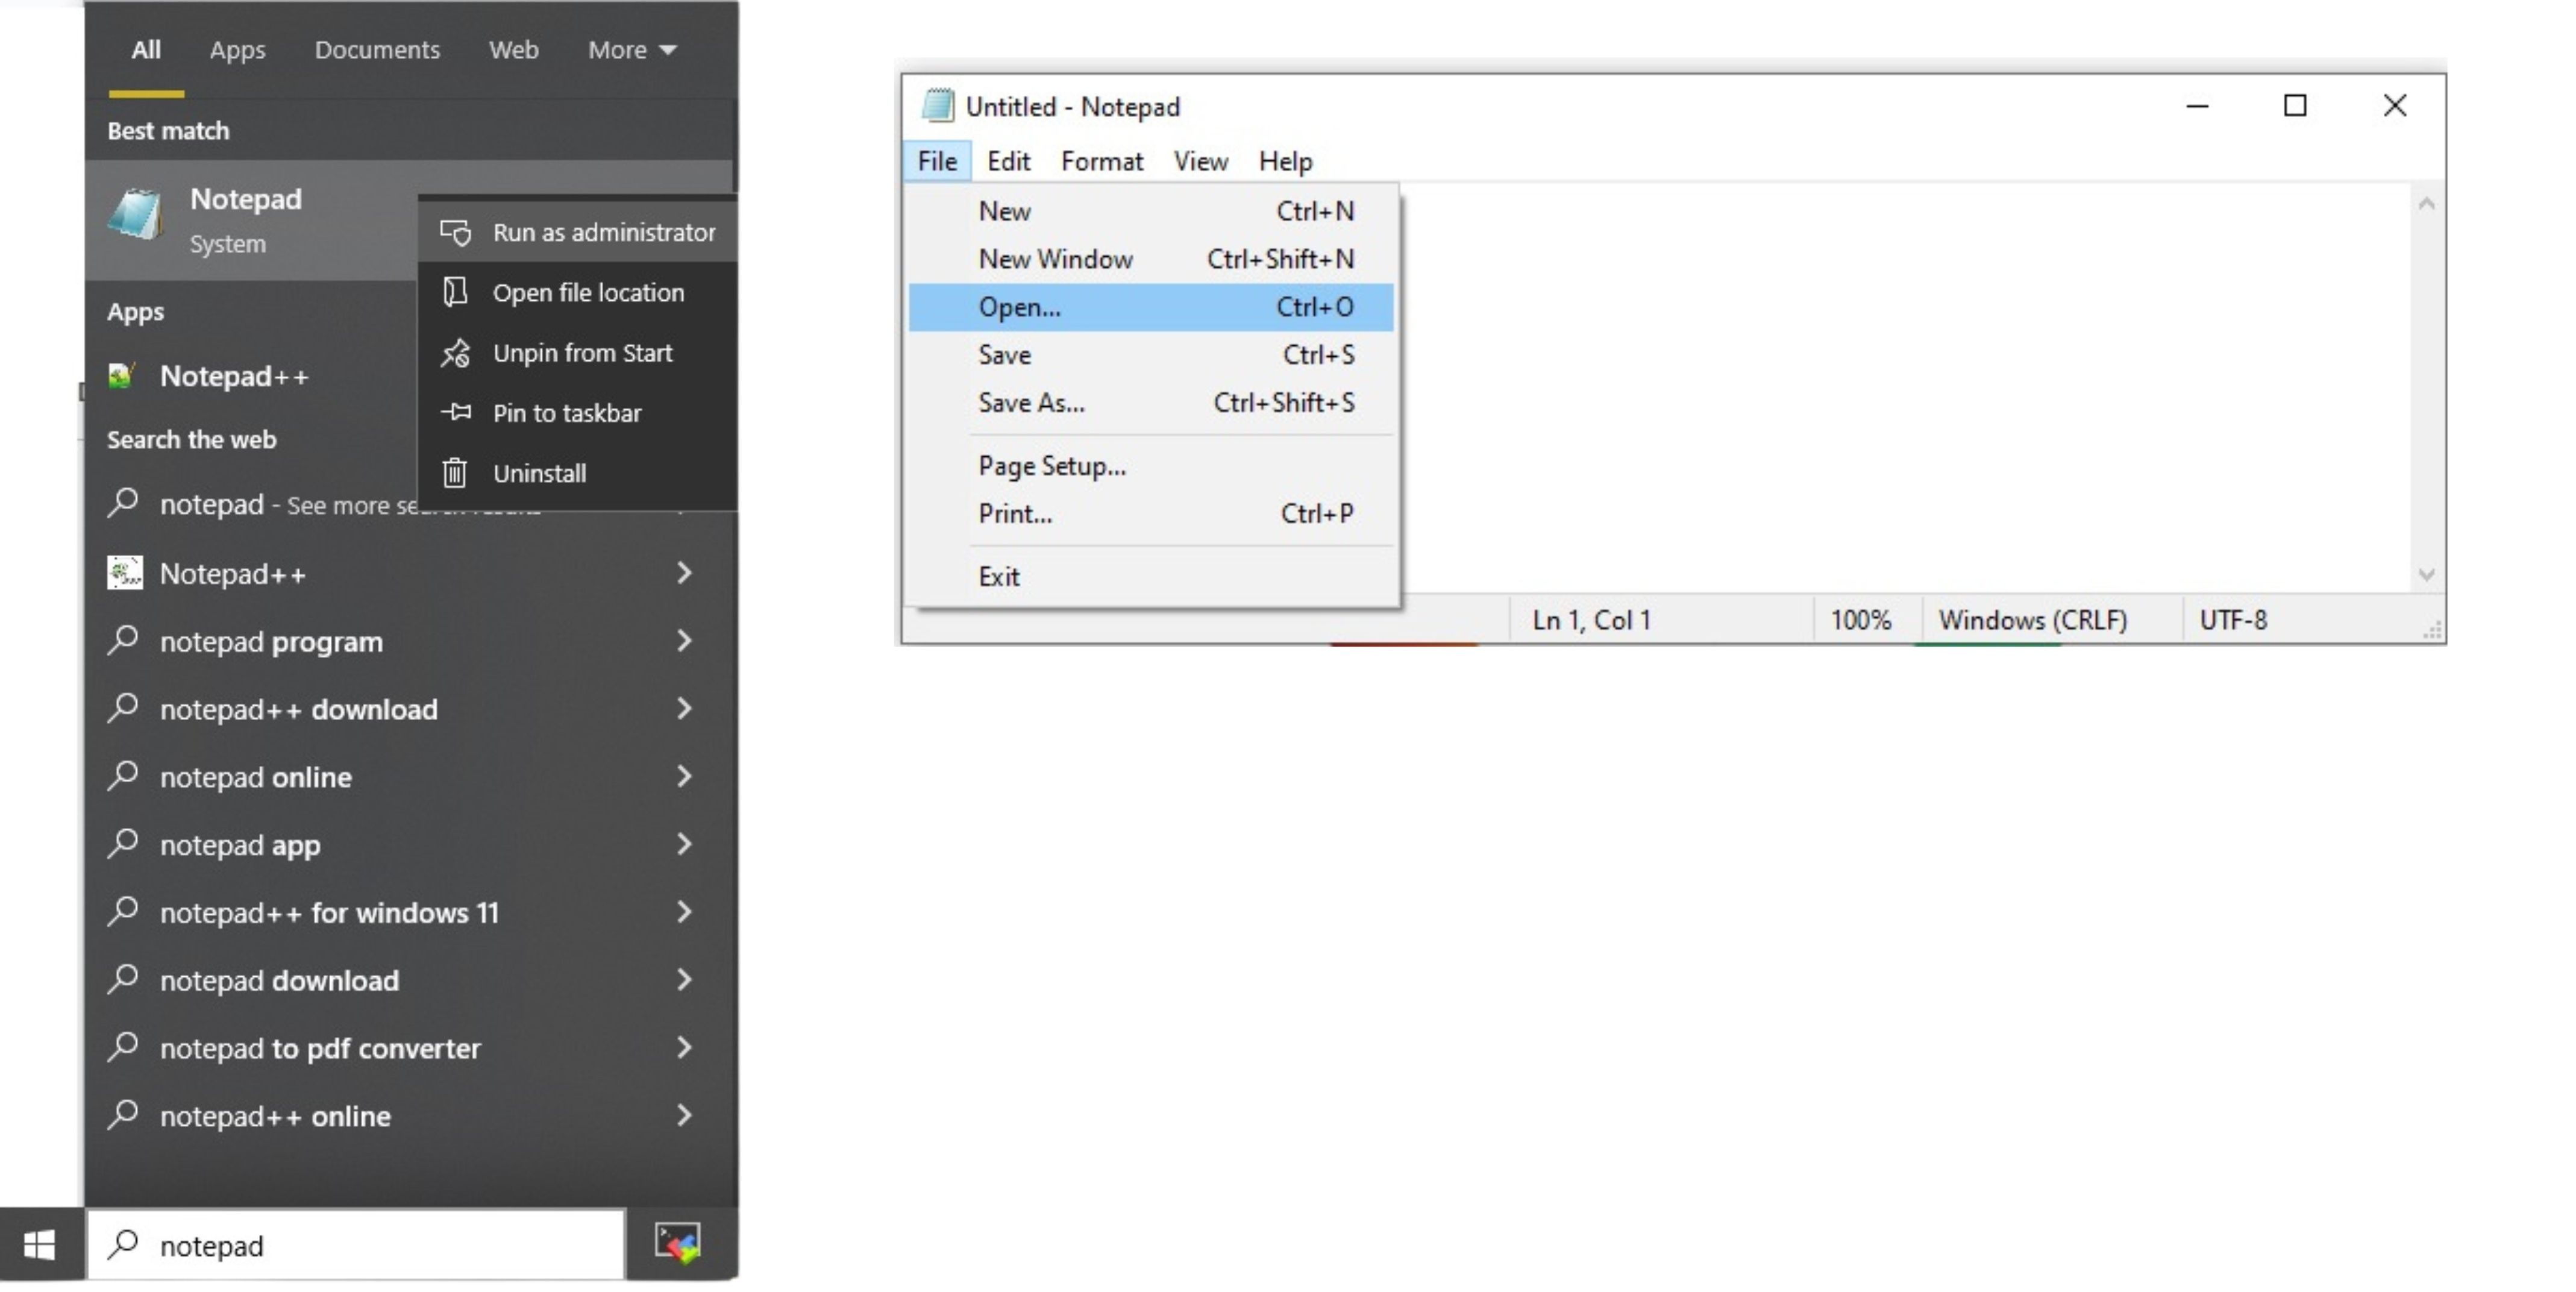
Now, create an index.html file inside the mywebsite folder. Open a text editor (like Notepad, run as administrator ) and add the following simple HTML content to the file:
<html>
<head><title>Hello World</title></head>
<body><h1>Hello, World!</h1></body>
</html>
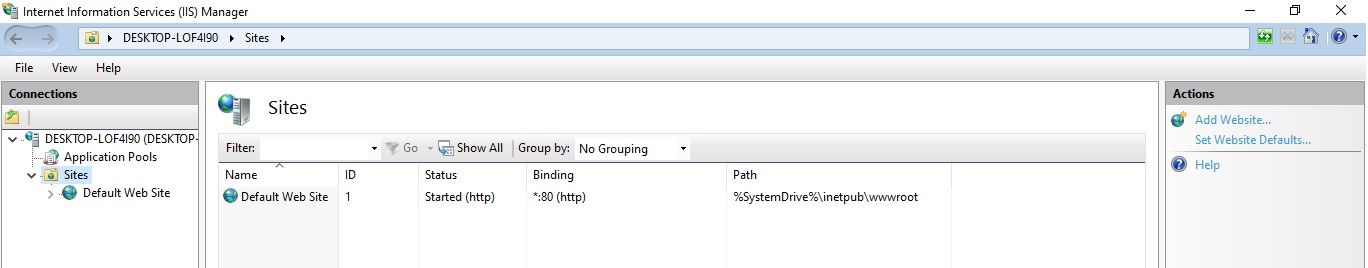
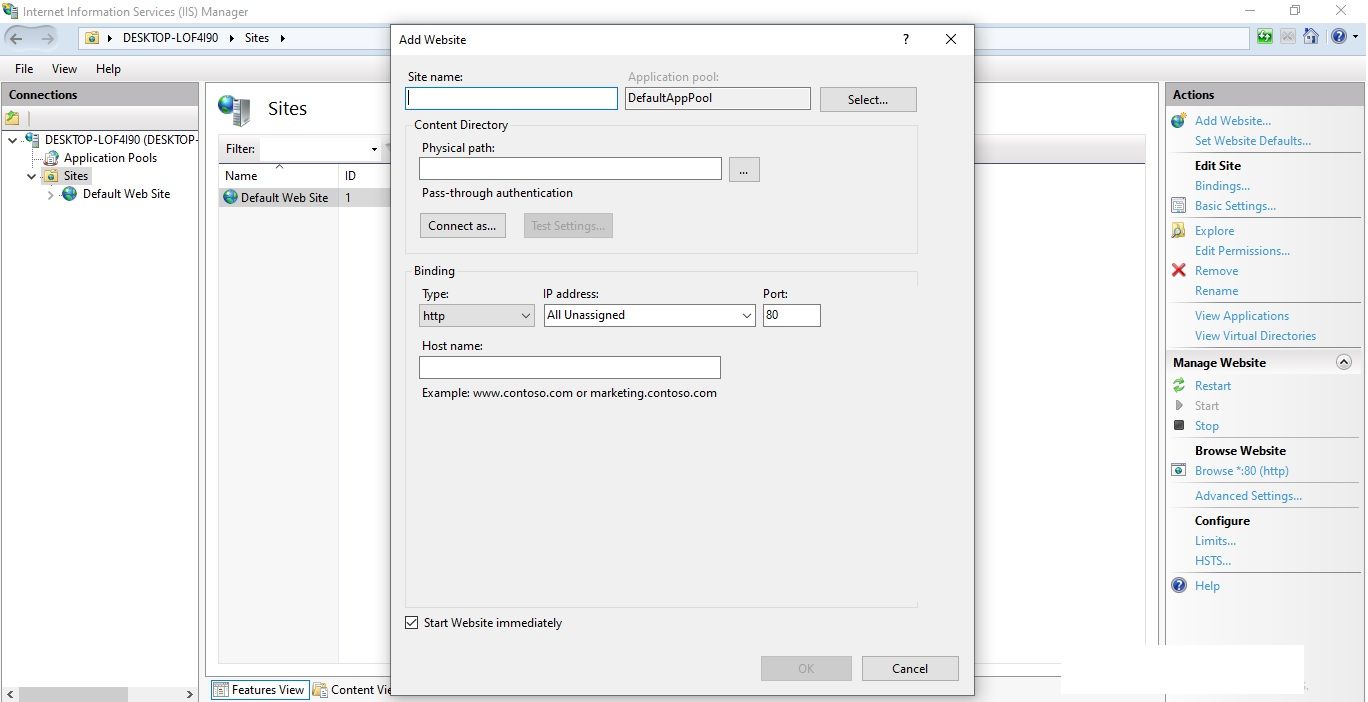
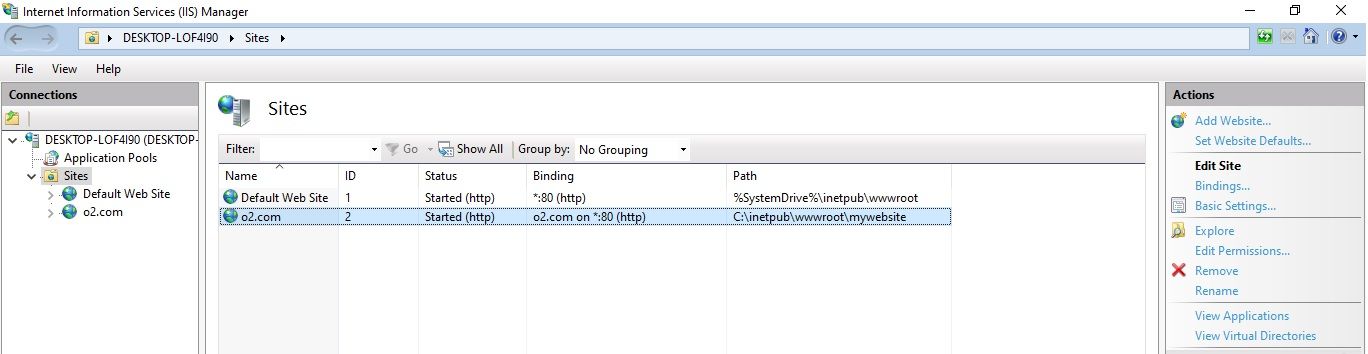
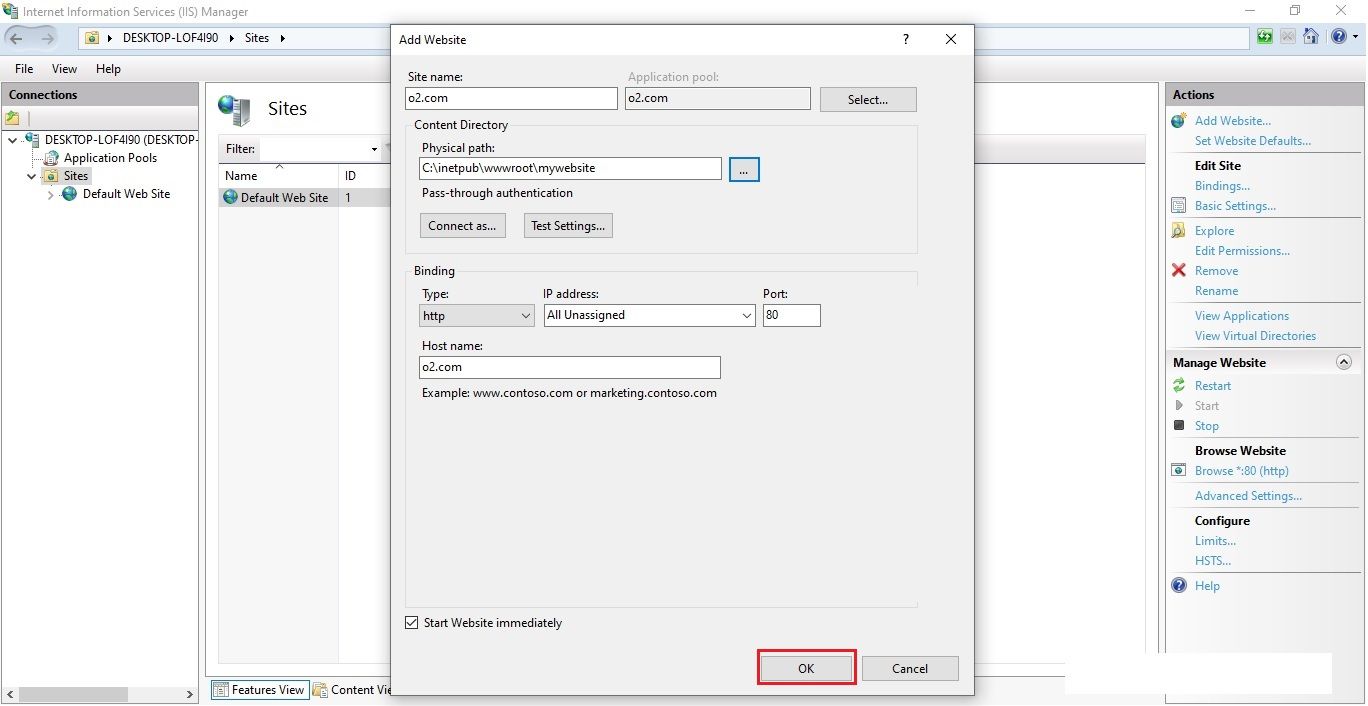 Once everything is properly configured, you should see your website details under the 'Sites' section.
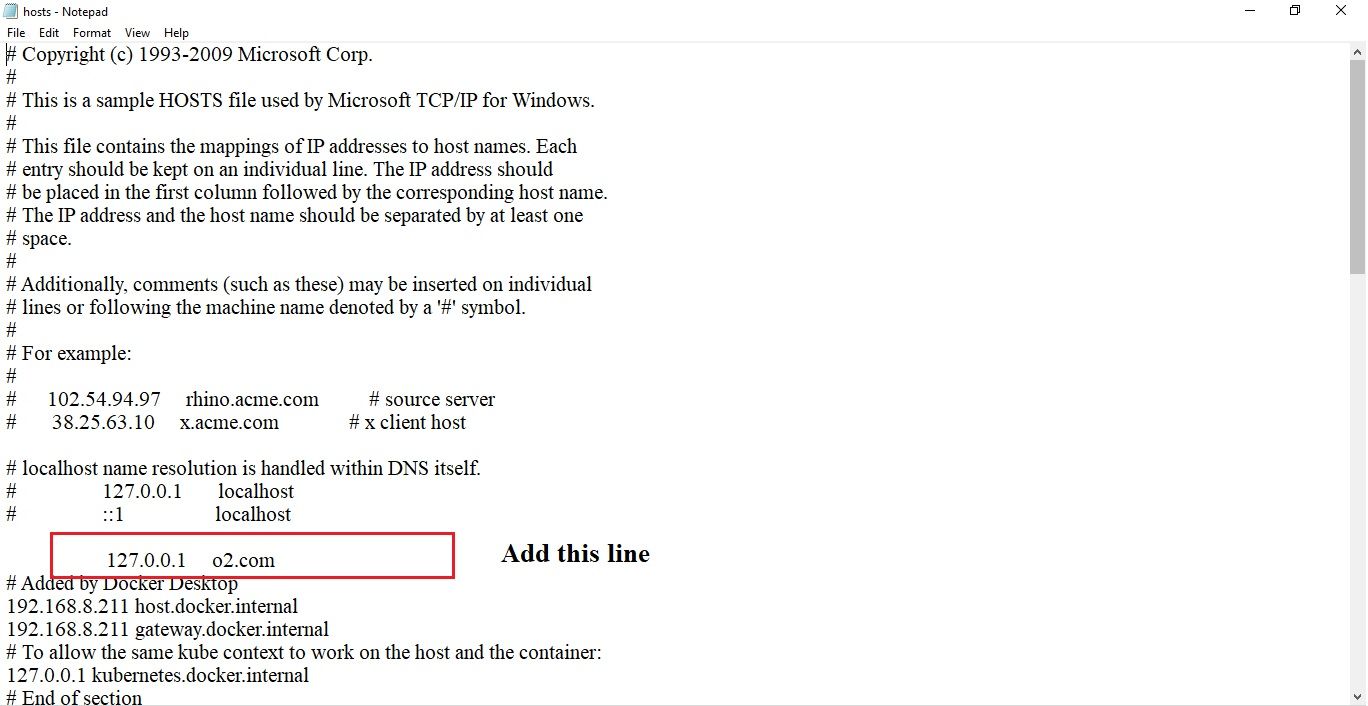
To access the website using your custom domain (e.g., o2.com), you need to map it to your local machine by editing the hosts file.
Open the Hosts File:
Add an Entry for Your Custom Domain:
127.0.0.1 o2.com
This maps the custom domain o2.com to your local machine (127.0.0.1)
Once done Save and Close the file.

Why Editing the Hosts File Is Necessary: Modifying the hosts file is useful for local development to map custom domain names to IP addresses without using public DNS. This allows you to test website behavior with a specific domain before live DNS changes, aiding in development and troubleshooting on local or internal servers.
How to Configure DNS in Production: If you're using AWS, configure DNS in production with Route 53 by creating a hosted zone for your domain and managing records (e.g., A, CNAME) to route traffic to AWS resources. Update your domain registrar's name servers to Route 53's for directing traffic effectively.
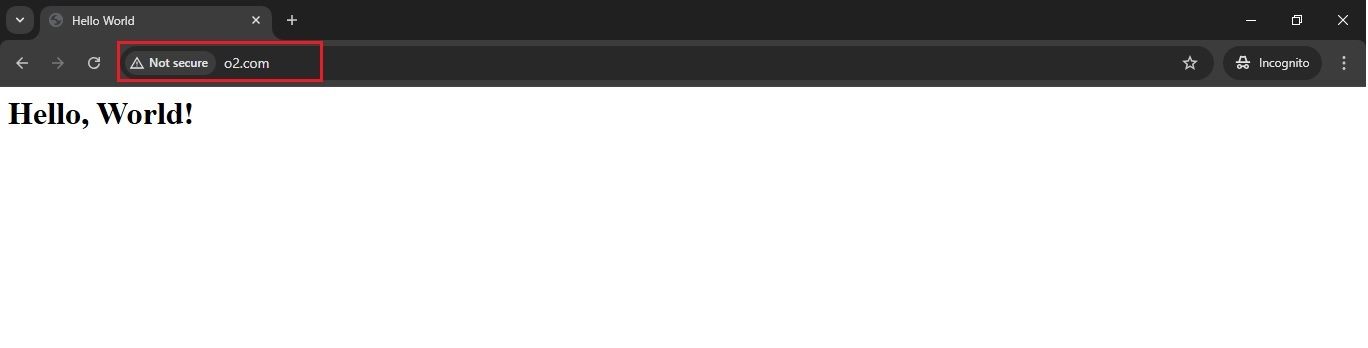
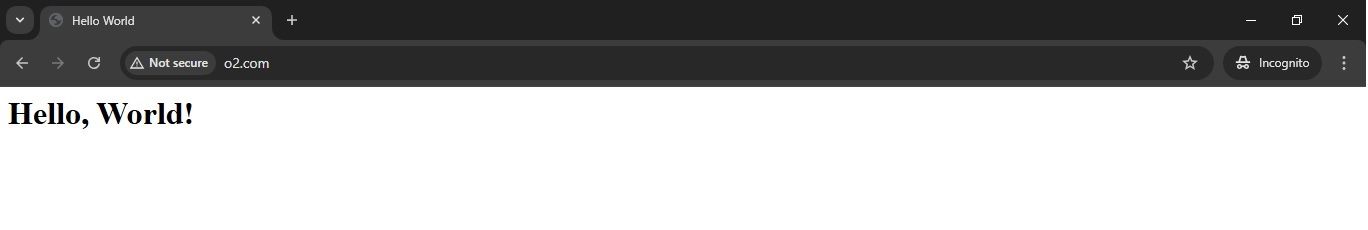
Open a web browser and type http://o2.com in the address bar.
Your custom website should load, displaying the Hello, World! Message.
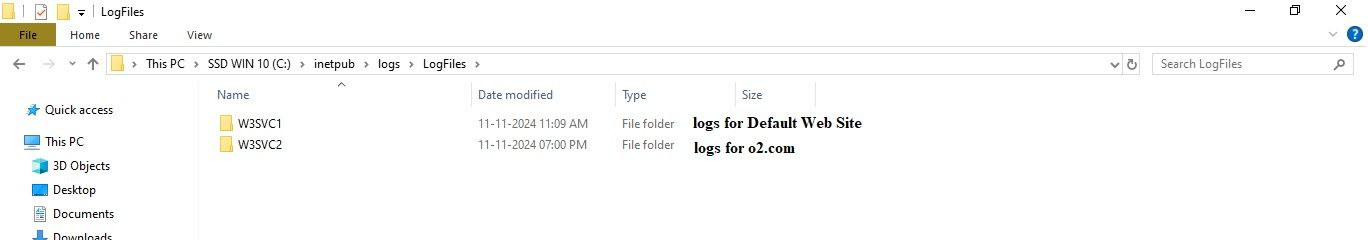
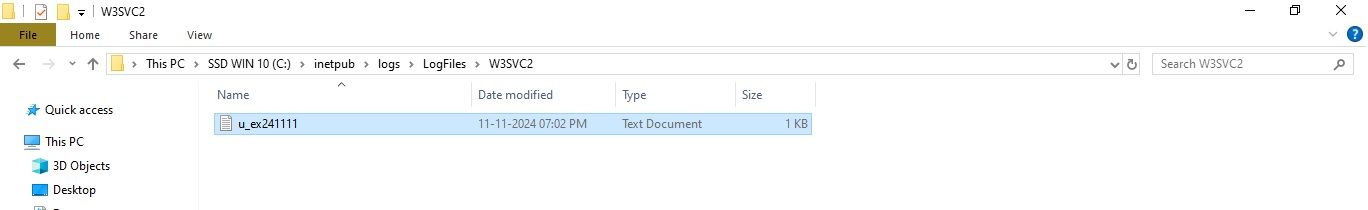
Your IIS logs will be stored at C:\inetpub\logs\LogFiles\W3SVC2. Open the log files in that directory to see the requests being logged as you visit the site. This is where you'll be able to analyze all incoming traffic to your site.
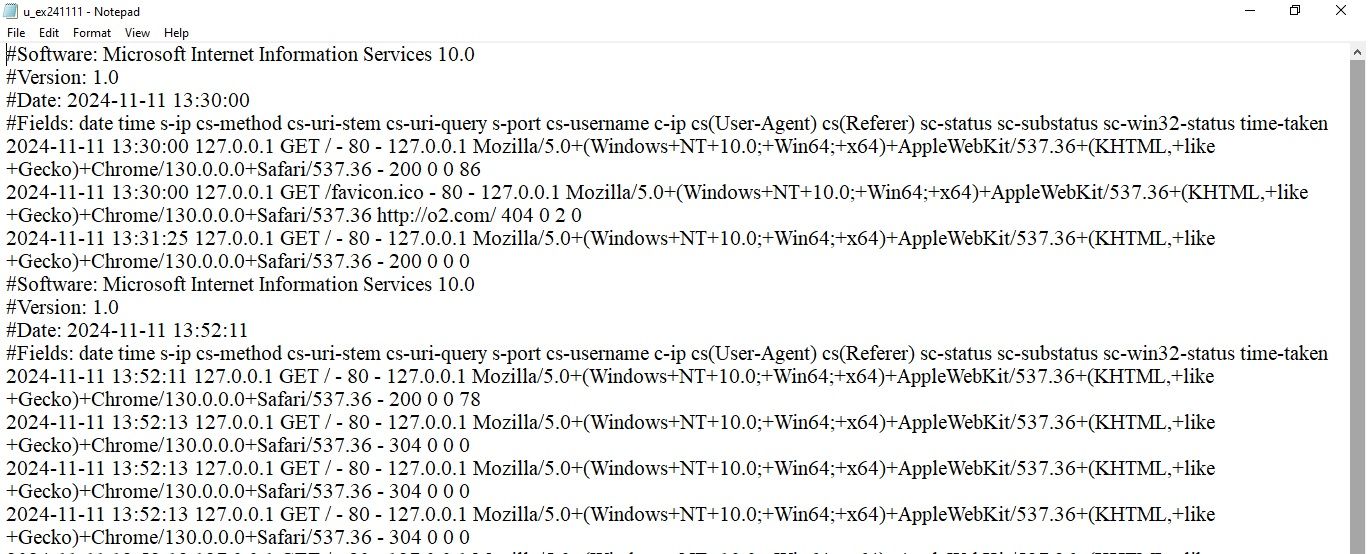
When configuring IIS, it's essential to know the available log formats and choose one that suits your needs.
By default, IIS often uses the W3C Extended Log Format. Here’s a brief overview of the formats:
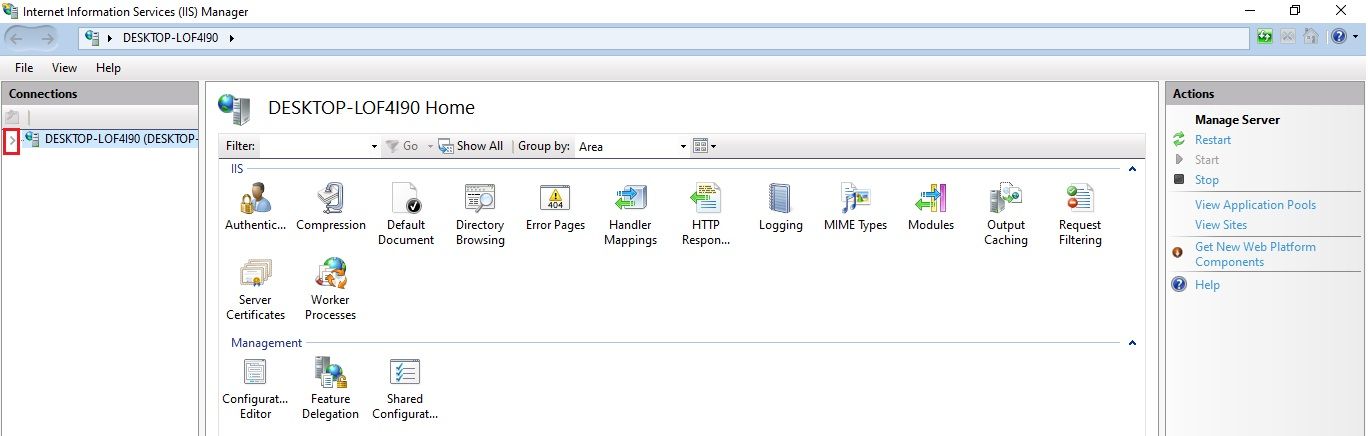
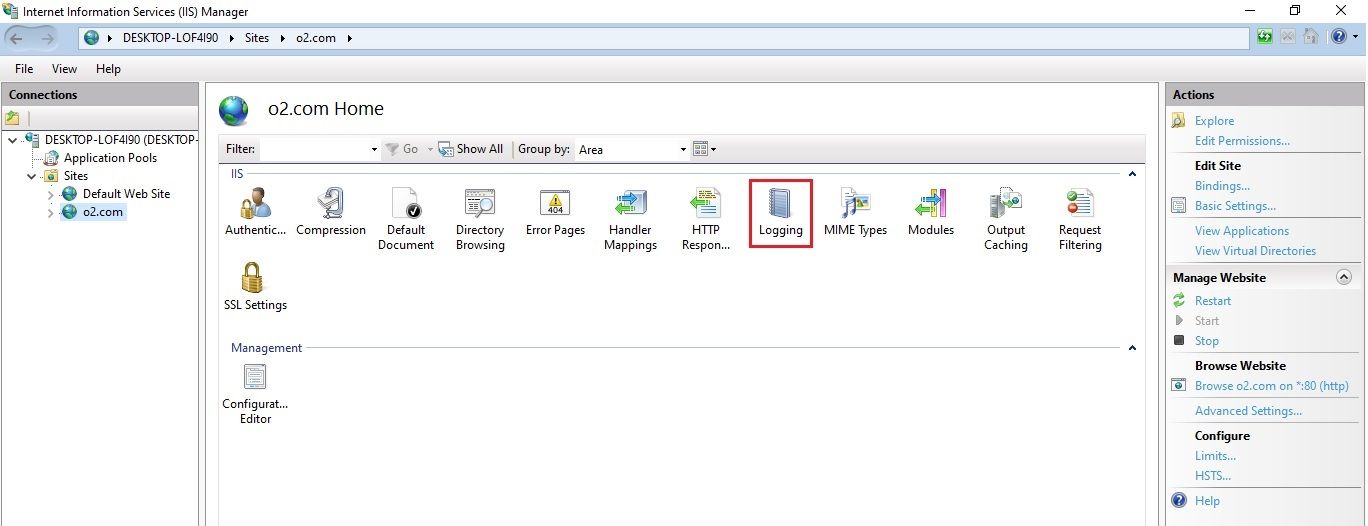
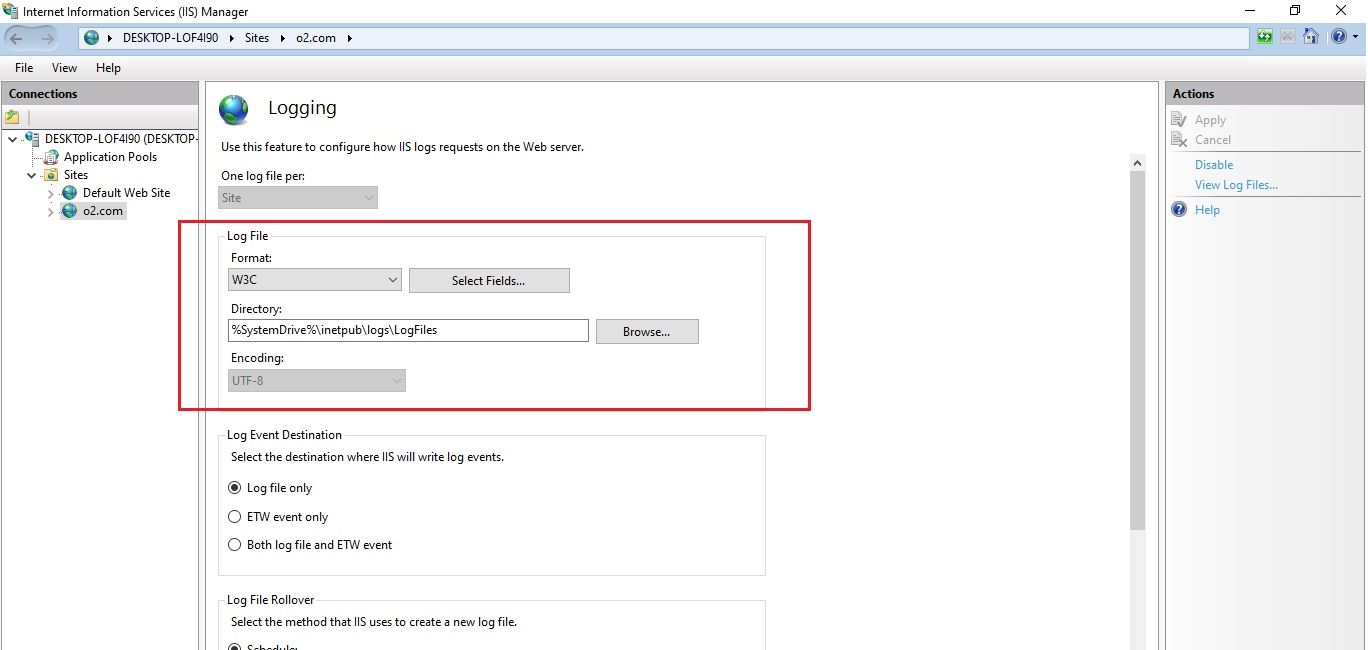
In your IIS configuration, you can review or change the log format by going to IIS Manager > Logging.
OpenObserve (O2) supports a variety of methods for collecting and sending IIS logs for analysis, giving you flexibility in how you integrate with the platform. You can use the following tools to forward IIS logs to OpenObserve:
In this blog, we will focus on using Fluent Bit to collect and send IIS logs to OpenObserve for analysis. However, if you're interested in using the OpenTelemetry Collector, we have another blog specifically dedicated to that method. You can explore it in our blog, Parsing Windows IIS Logs.
In this demo, we’ll proceed with a self-hosted installation of OpenObserve on a separate server. For a detailed setup guide, you can refer to the OpenObserve Quickstart Documentation.
curl -L https://raw.githubusercontent.com/openobserve/openobserve/main/download.sh | sh
Once downloaded run it using below command:
ZO_ROOT_USER_EMAIL="root@example.com" ZO_ROOT_USER_PASSWORD="Complexpass#123" ./openobserve
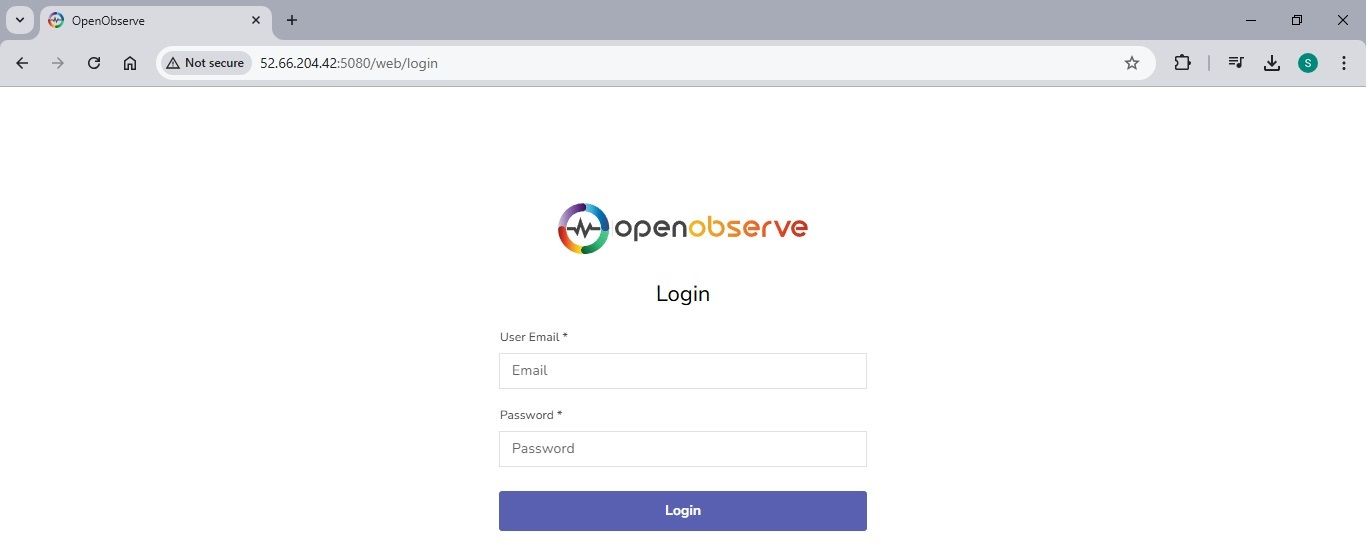
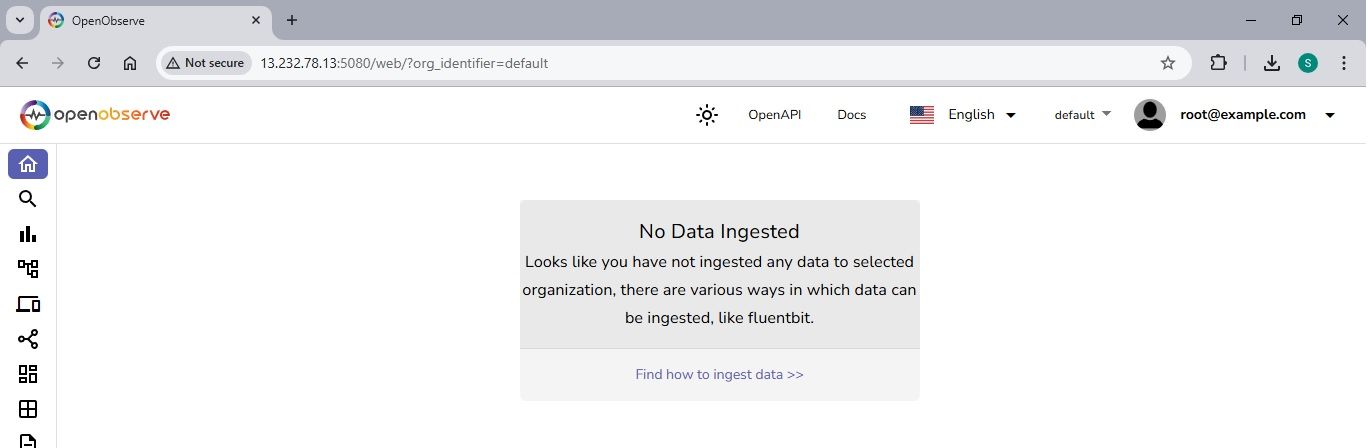
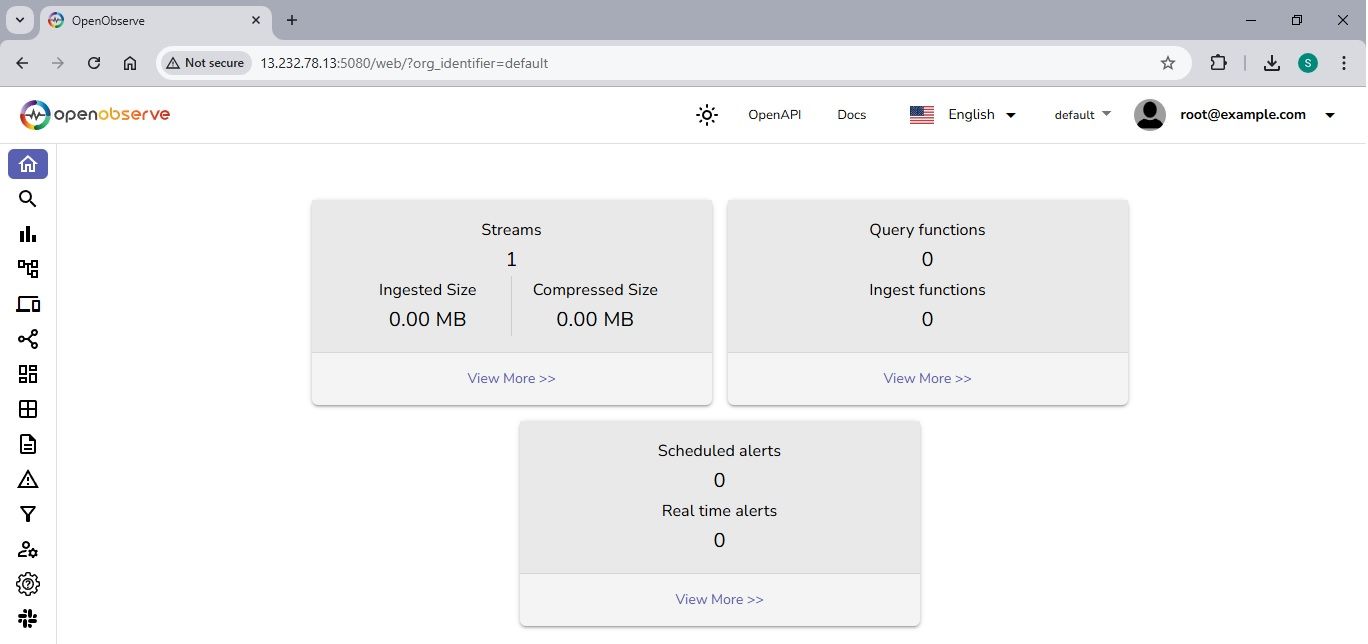
Now point your browser to http://localhost:5080 and log in with the following credentials
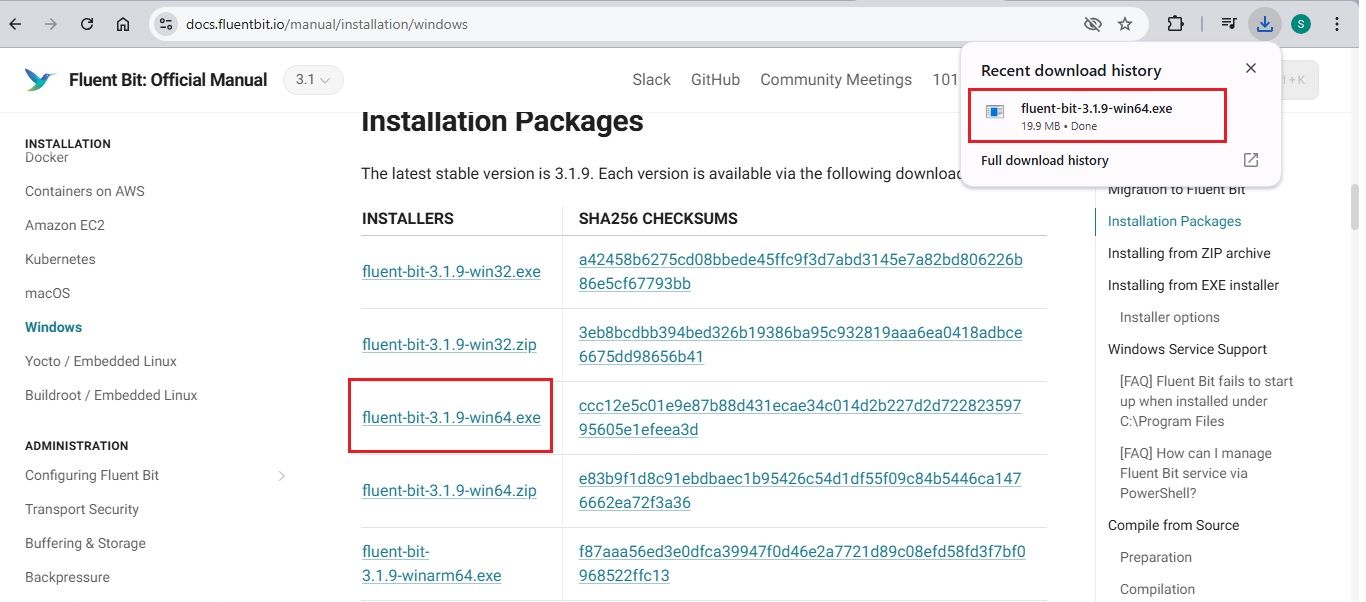
To collect and forward logs from IIS, you need to install Fluent Bit on the same machine where IIS is running. You can follow the official Fluent Bit documentation for detailed installation instructions and download links for the Windows version.
As I am using Windows 10, I will choose the Windows 10 EXE installation package for Fluent Bit.
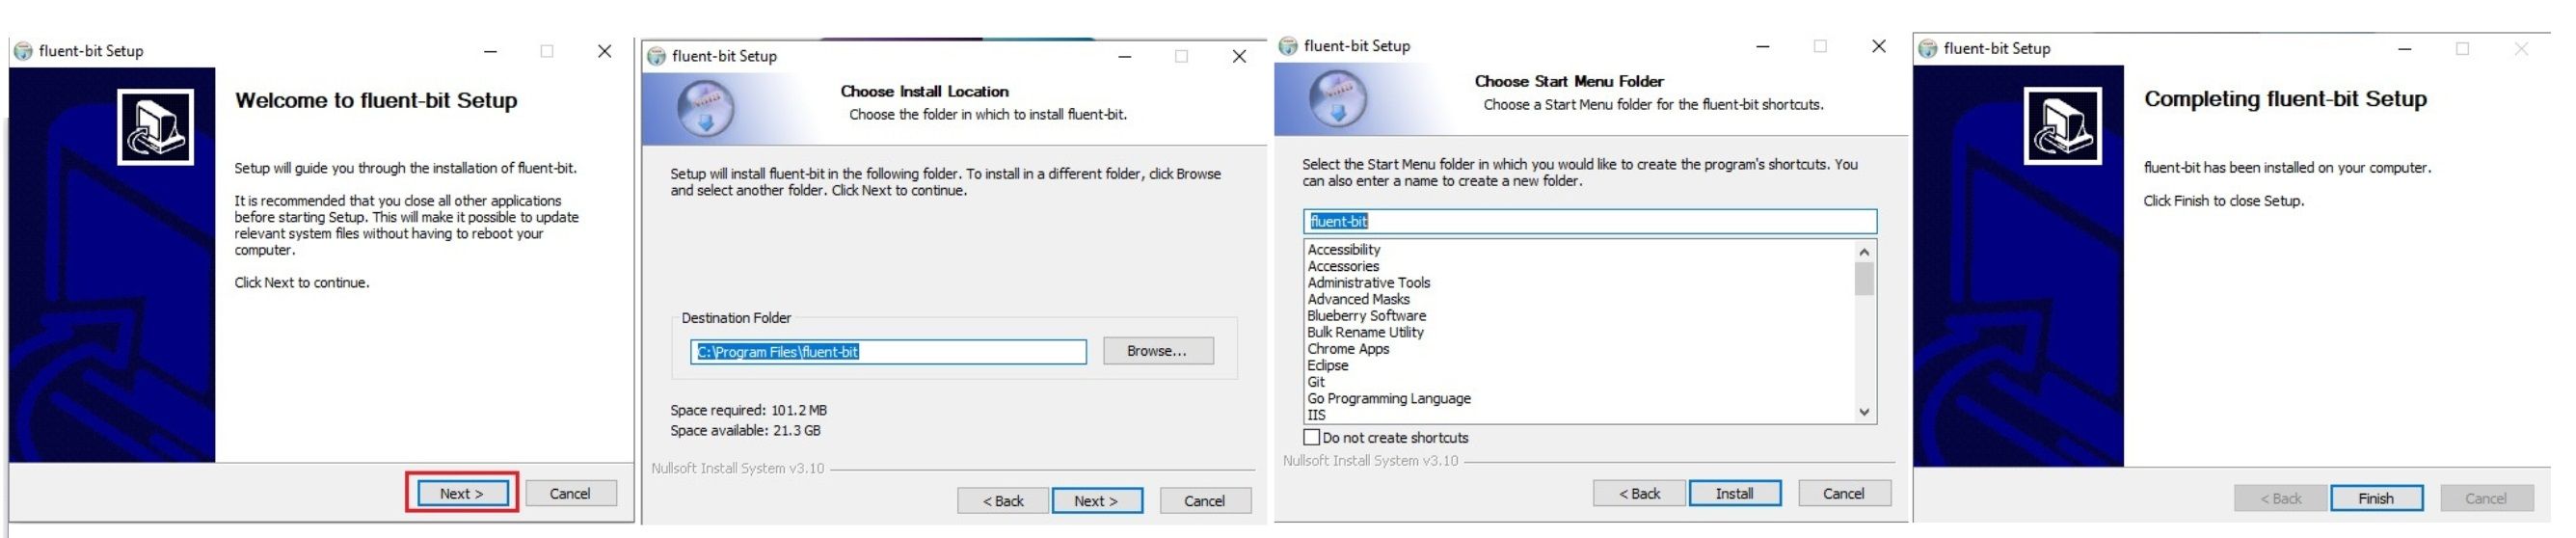
 Click on the EXE file and keep clicking Next until the setup is complete.
 Directory structure for Fluent Bit:
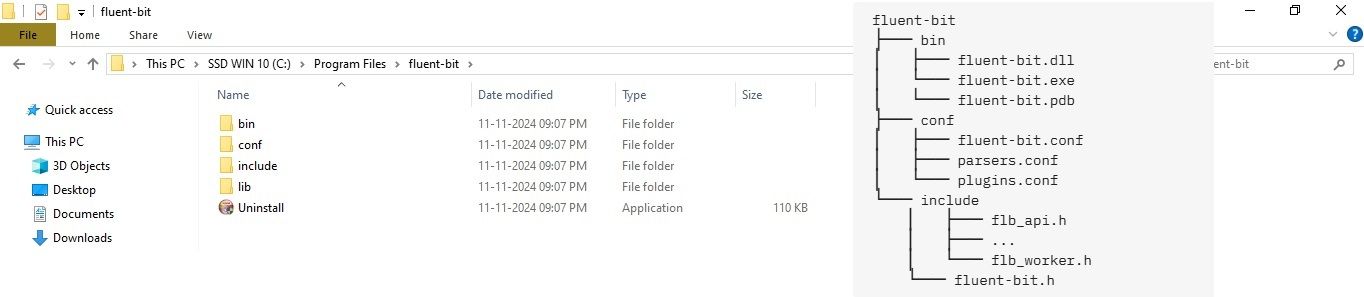
The fluent-bit.conf configuration file is located under C:\Program Files\fluent-bit\conf, where you can edit it to configure Fluent Bit to capture Windows IIS logs and send them to OpenObserve.
# Fluent Bit Input Configuration
[INPUT]
    Name              tail
    Tag               iis_logs
    Path              C:\inetpub\logs\LogFiles\W3SVC2\*.log
    Read_from_Head    On
    Skip_Long_Lines   On
    Refresh_Interval  10
    Buffer_Chunk_Size 1M
    Buffer_Max_Size   5M

# Fluent Bit Output Configuration
[OUTPUT]
    Name              http
    Match             *
    URI               /api/default/default/_json
    Host              13.232.78.13
    Port              5080
    tls               Off
    Format            json
    Json_date_key     _timestamp
    Json_date_format  iso8601
    HTTP_User         root@example.com
    HTTP_Passwd       Nw8nhBMvI6S5SB1o
    compress          gzip
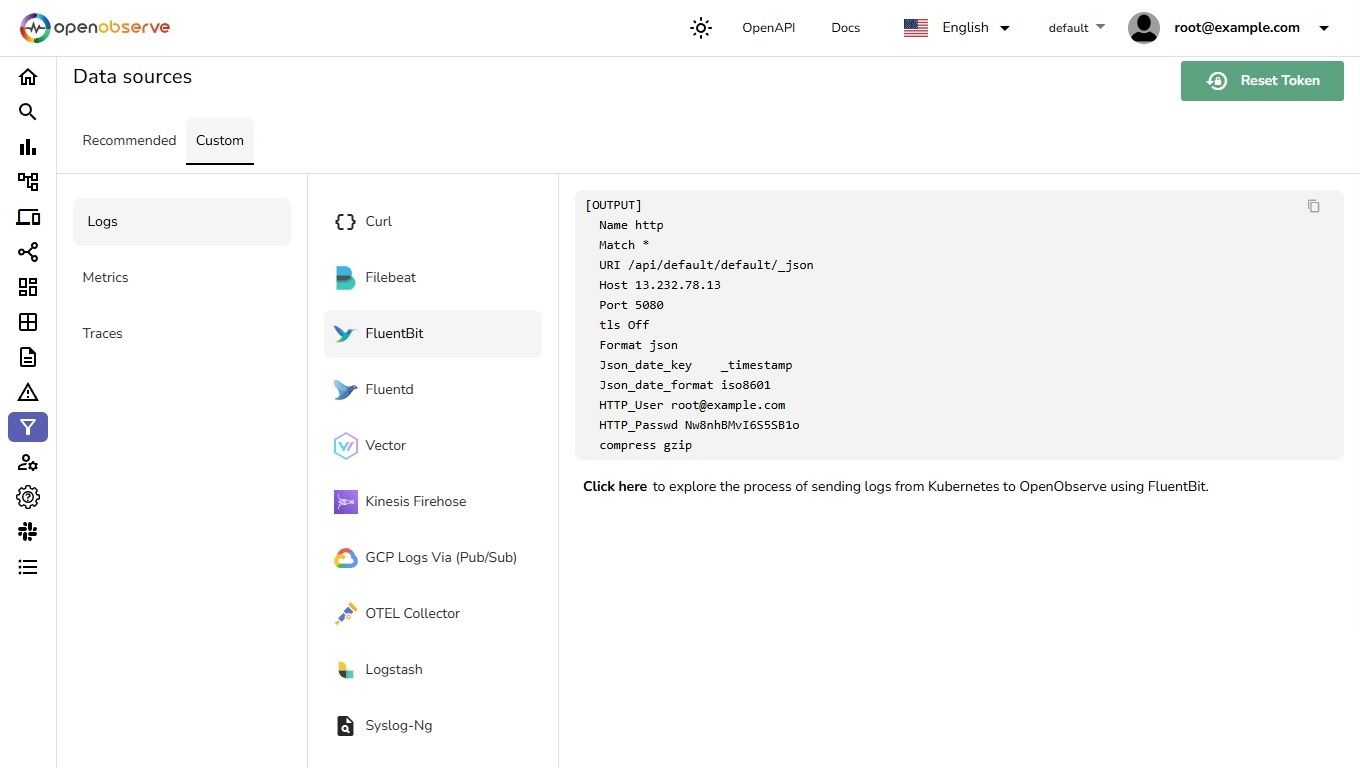
Replace
You can find the [OUTPUT] configurations for Fluent Bit under the Ingestion > Custom > Logs > FluentBit section in OpenObserve
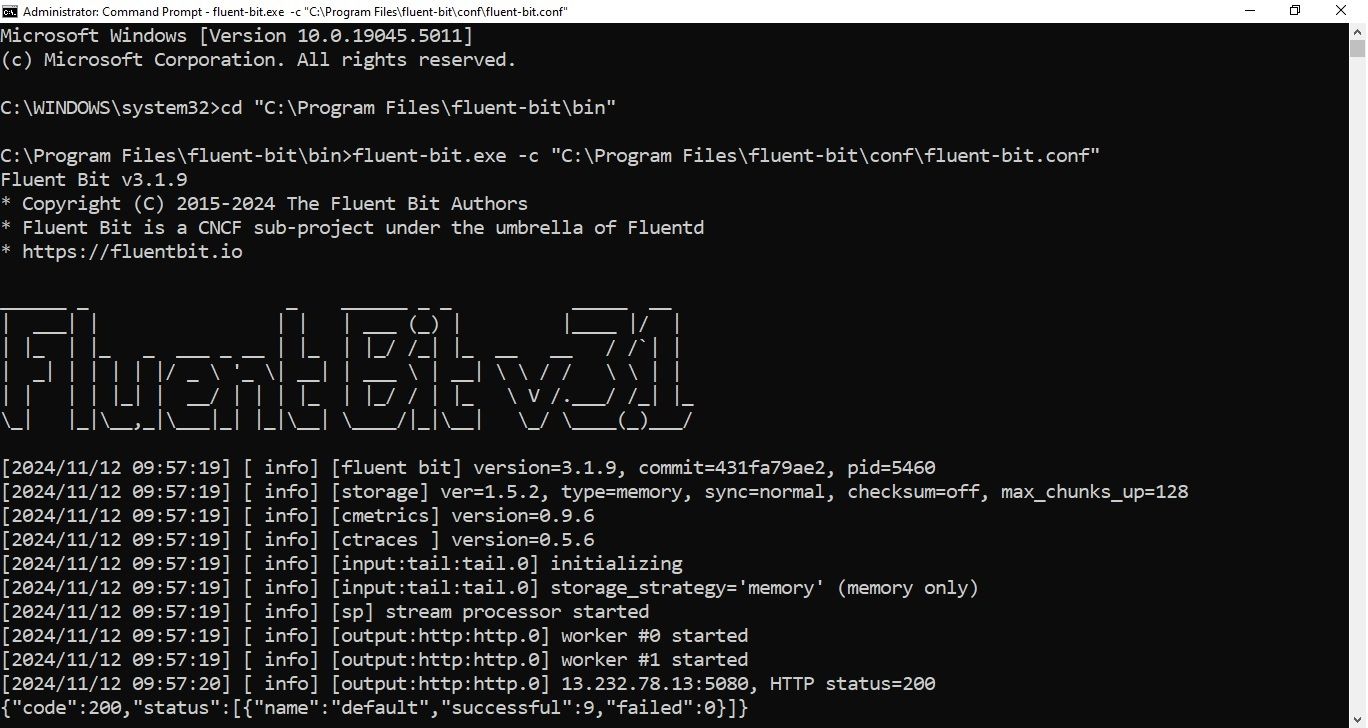
Run Fluent Bit with the following command in the command prompt to start capturing and sending IIS logs:
#  Change to the Fluent Bit installation directory
cd "C:\Program Files\fluent-bit\bin"

# Run Fluent Bit using the specified configuration file
fluent-bit.exe -c "C:\Program Files\fluent-bit\conf\fluent-bit.conf"
To make your logs more insightful, you can use Vector Remap Language (VRL) in OpenObserve to extract meaningful data.
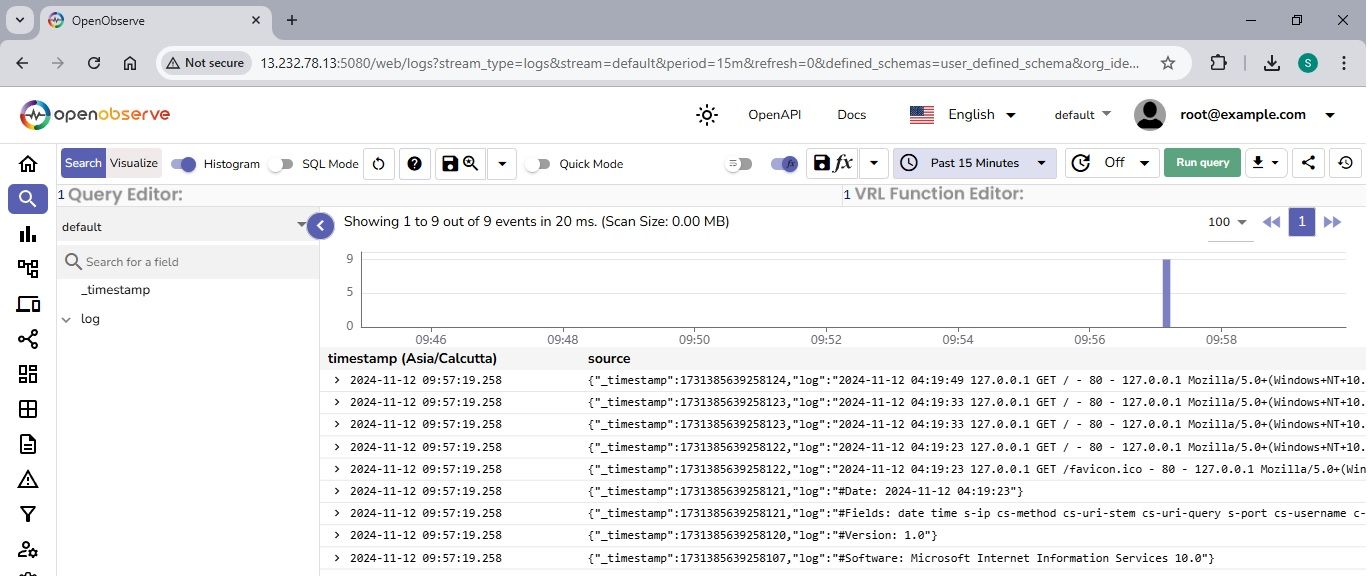
As shown below, the logs ingested currently lack sufficient detail and are not as insightful as needed
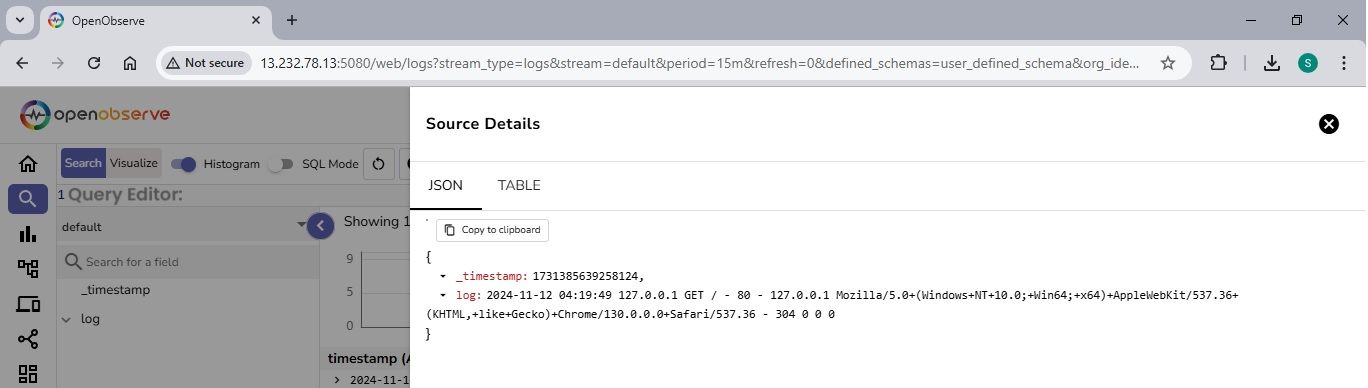 Now, let's parse the logs using VRL to extract more meaningful insights.
pattern = r'^(?P<date>\d{4}-\d{2}-\d{2}) (?P<time>\d{2}:\d{2}:\d{2}) (?P<server_ip>[^\s]+) (?P<http_method>[^\s]+) (?P<uri_stem>[^\s]+) (?P<uri_query>[^\s]+) (?P<server_port>[^\s]+) (?P<username>[^\s]+) (?P<client_ip>[^\s]+) (?P<user_agent>.*?) (?P<referer>.*?) (?P<status_code>[^\s]+) (?P<substatus>[^\s]+) (?P<win32_status>[^\s]+) (?P<time_taken>[^\s]+)$'

.log = parse_regex!(.log, pattern)
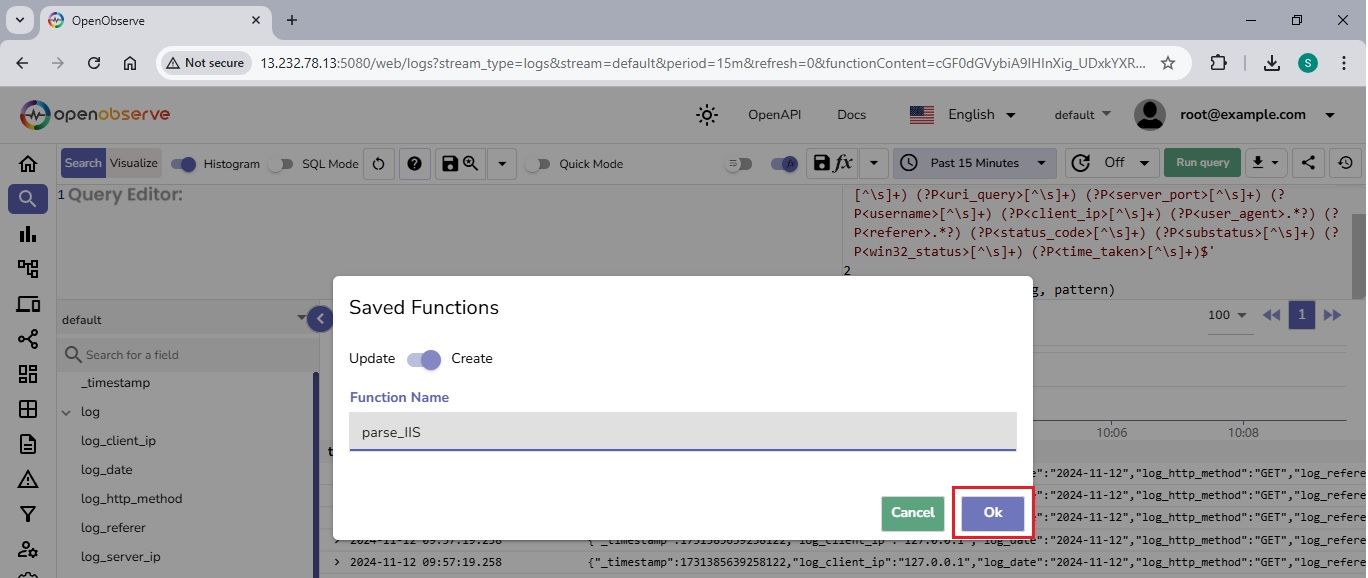
Save the VRL function and link it to the data stream to ensure that logs are parsed and structured during ingestion into OpenObserve. This step will streamline the process and improve the quality of the data as it enters the system.
Let's save the function as “parse_IIS” for easy identification and future use.
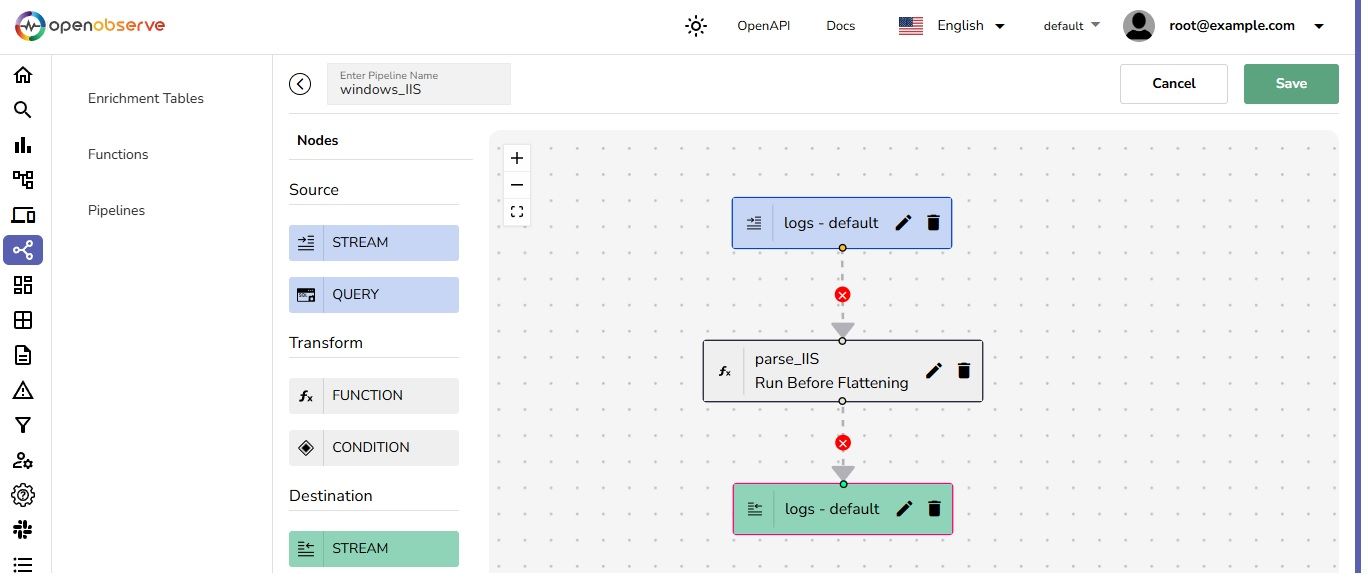
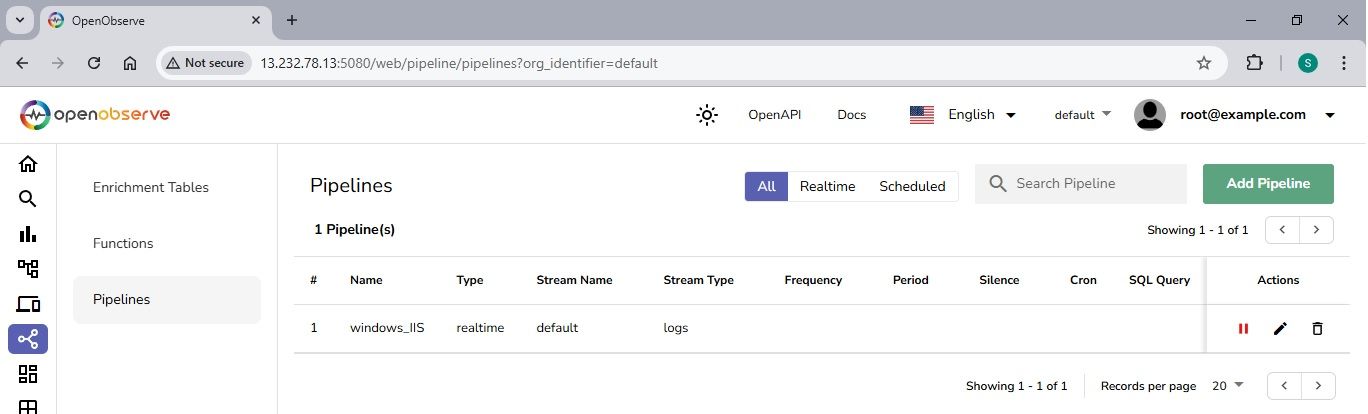
 Let's create a pipeline to associate the parse_IIS function with the default stream.
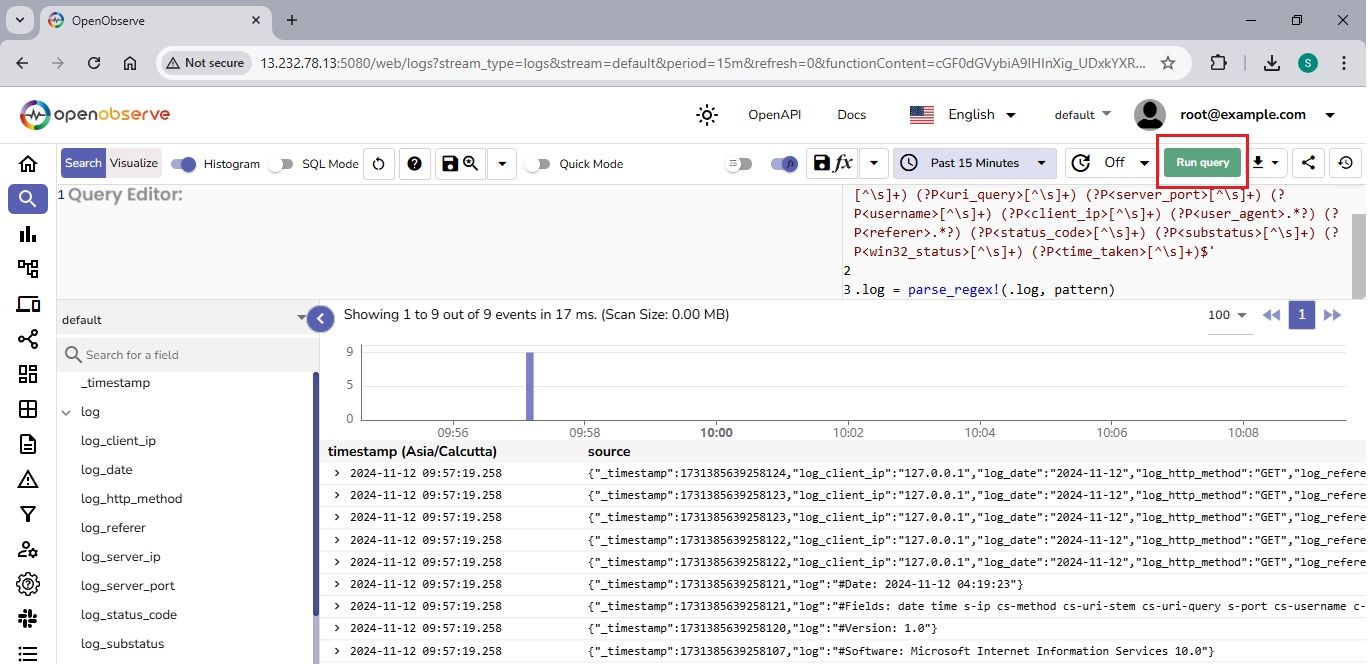
To test the setup, visit http://o2.com multiple times to generate access logs. These logs will be transformed in real-time as they are ingested into OpenObserve.
Select the 5 minute time range and run a query to view the logs.
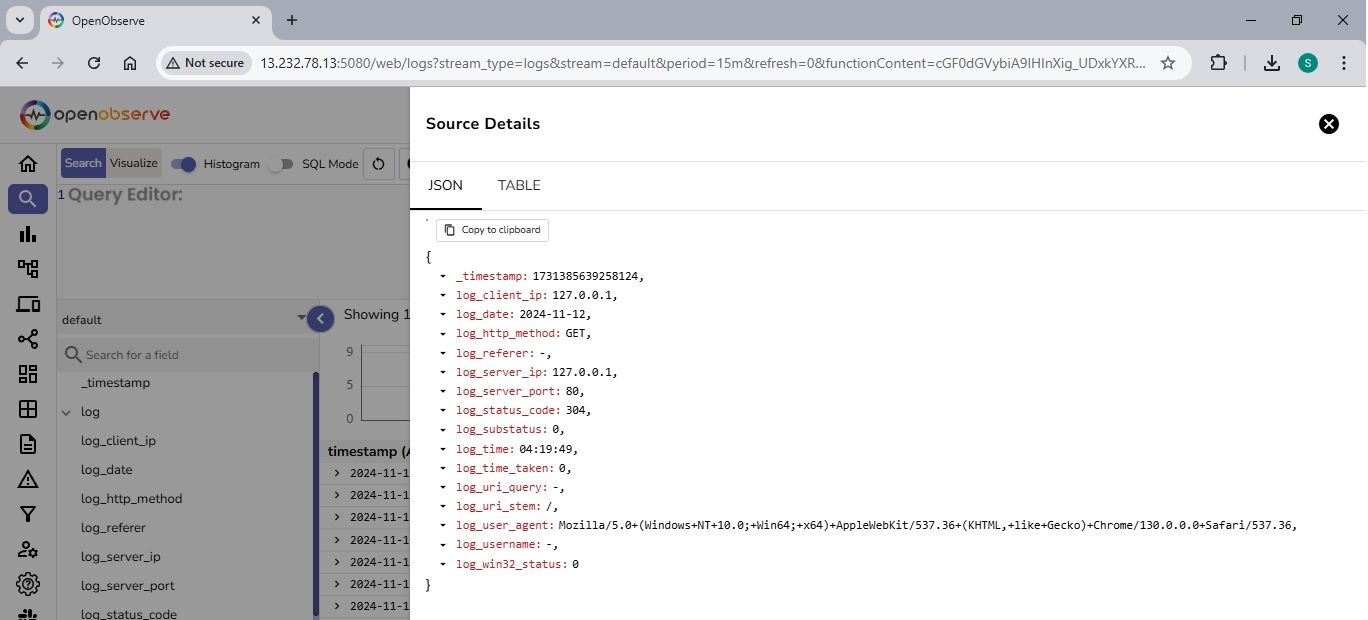
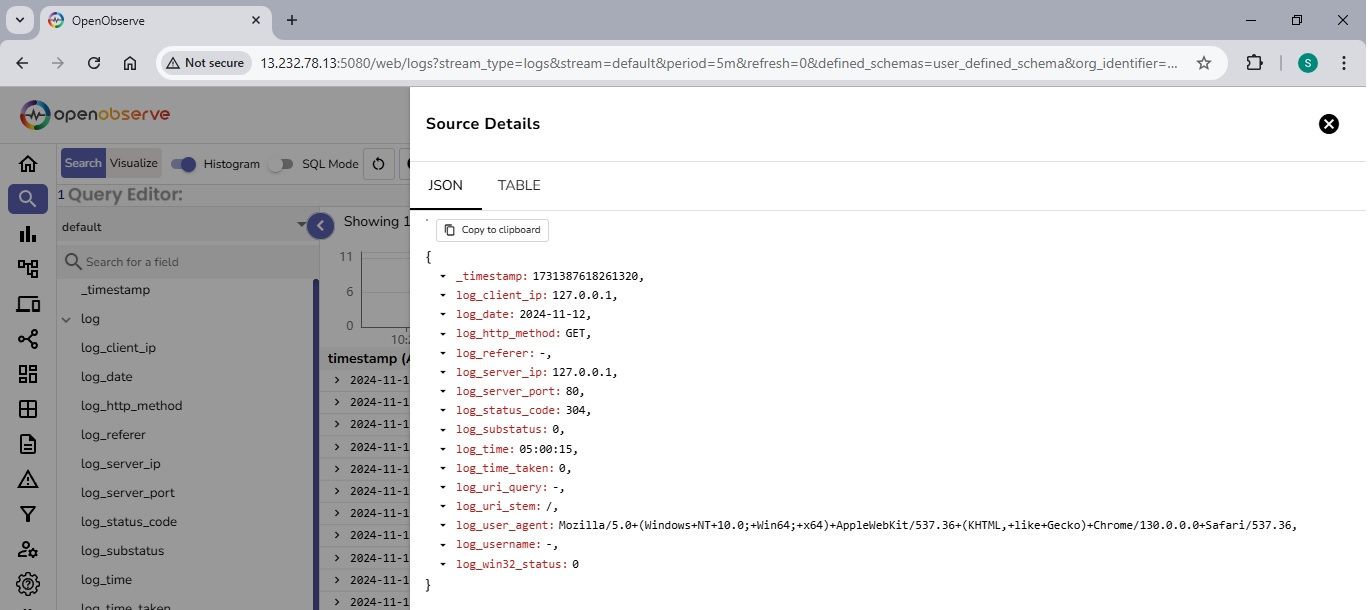
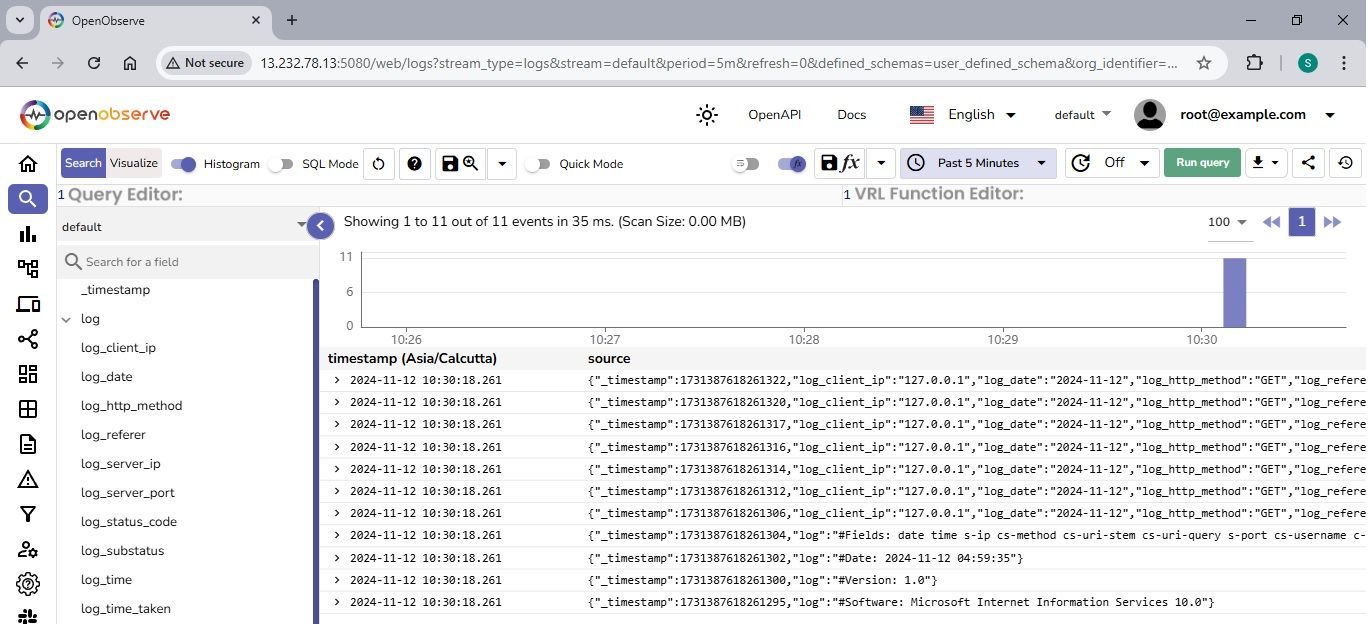 You’ll notice that VRL functions are now being applied in real-time to the ingested logs.
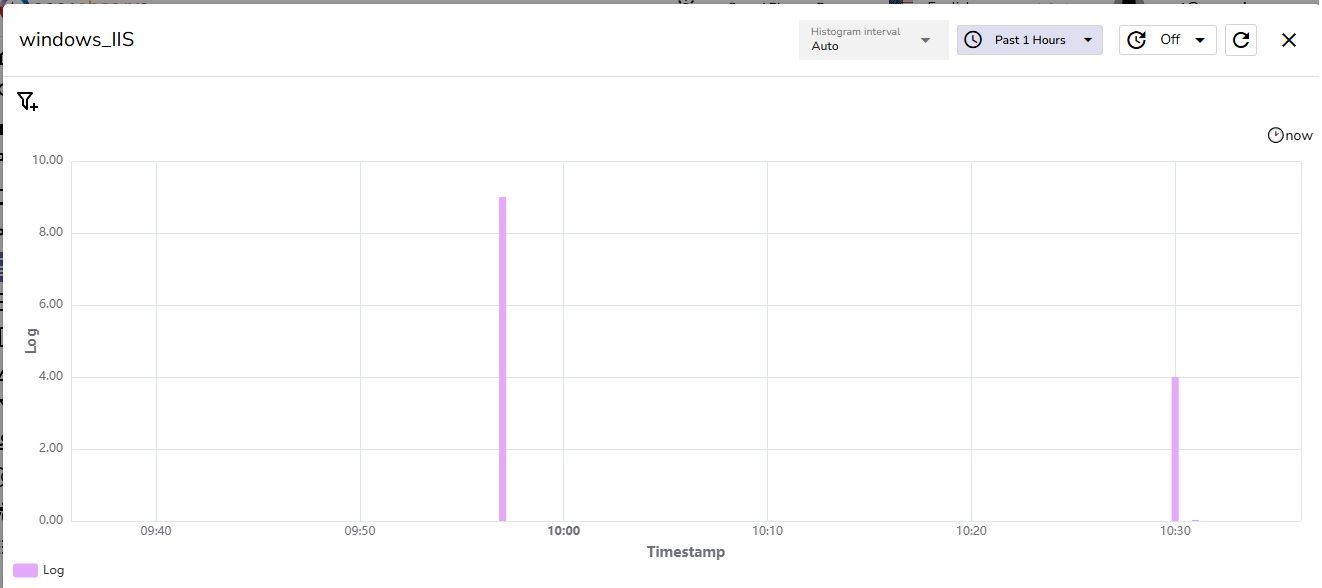
OpenObserve (O2) dashboards provide a powerful and user-friendly interface for visualizing and analyzing ingested data, such as logs, metrics, and traces. These dashboards offer customizable views, enabling users to monitor system performance, detect issues, and gain valuable insights in real-time.
The image shows a dashboard visualizing log data from "windows_IIS" over the past hour. The purple bars indicate periods of active log entries, helping identify patterns or irregularities in data ingestion for effective troubleshooting and analysis.
Windows IIS is a powerful and secure web server. By combining it with OpenObserve, you gain the ability to monitor and analyze server activity efficiently. With the steps above, you’ve set up IIS, enabled logging, and learned how to collect and analyze logs with Fluent Bit and OpenObserve. This setup will help you gain valuable insights into your IIS server’s performance and health.
Sampath is a Developer Advocate at OpenObserve with a background in DevOps and Cloud, passionate about Observability and Open Source technologies