Monitor AWS EC2 Logs and Metrics with OpenTelemetry

Nitya Timalsina
November 16, 2024
11 min read
Don’t forget to share!
Try OpenObserve Cloud today for more efficient and performant observability.
Let's face it: managing logs across AWS EC2 instances can feel like trying to drink from a firehose. Traditional monitoring tools like Amazon CloudWatch are expensive, complex, and often leave you drowning in data. What if there was a straightforward and sustainable alternative to collect, analyze, and derive insights from your logs and metrics?
Enter OpenTelemetry—a powerful solution that will help you transform log and metrics monitoring from a headache to a superpower. OpenTelemetry isn't just another monitoring tool—it's an open-source observability framework that speaks the language of modern, cloud-native infrastructure. It allows you to monitor logs, metrics, and traces without worrying about vendor lock-in.
Your EC2 instances are the heartbeat of your infrastructure. They run critical applications, serve customers, and generate mountains of data. But without proper monitoring, you're essentially driving blindfolded.
Effective log and metrics monitoring helps you:
While AWS CloudWatch is the default monitoring solution for EC2 instances, it comes with limitations:
For these reasons, many developers and DevOps teams turn to more flexible solutions like OpenTelemetry.
OpenTelemetry (OTel) is an open-source observability framework that allows you to collect logs, metrics, and traces without vendor lock-in. It provides:
However, setting up OpenTelemetry from scratch can be complex. That’s where the OpenObserve Collector comes in.
The OpenObserve Collector is a pre-configured version of the OpenTelemetry Collector optimized for capturing logs and metrics from your EC2 instances. It simplifies the setup process by providing:
So, without further ado, we'll walk you through a hands-on demonstration of EC2 logs and metrics monitoring using Opentelemetry via the OpenObserve Collector. By the end of this article, you will know how to:
Whether you're a DevOps engineer, system administrator, or developer looking to gain deeper visibility into your infrastructure, this guide will equip you with the practical skills to implement a modern, efficient monitoring solution.
Let’s get started!
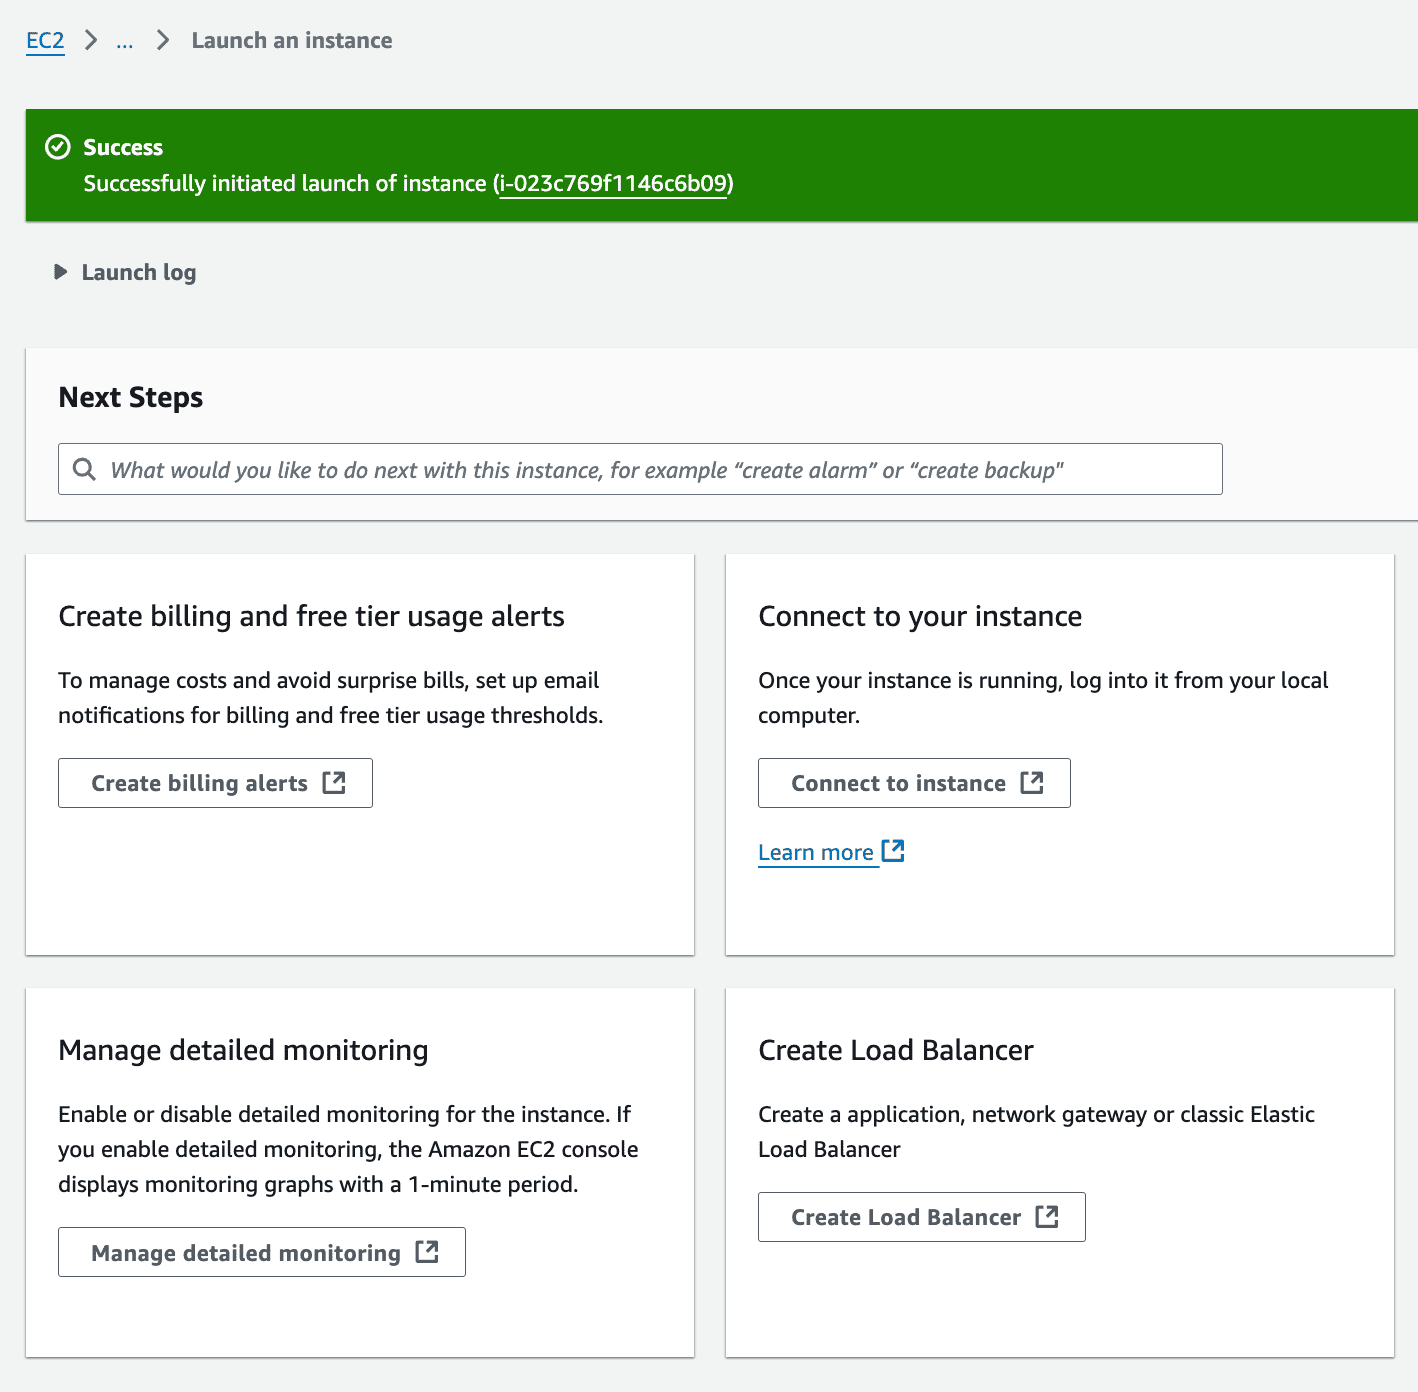
Now, you’re ready to connect to your EC2 instance:
# Run command IF you want your key to not be publicly viewable
chmod 400 "o2otel.pem"

# Connect to your instance using its Public DNS
ssh -i /path/to/your-key.pem ec2-user@your-instance-public-dns
In the OpenObserve UI, navigate to Data Sources → Linux to grab your custom curl command to install OpenObserve Collector.
The authentication token included in the command contains your base64 encoded credentials, which is used to authenticate your collector with the OpenObserve API. This ensures that only authorized users can send data to your specific OpenObserve account.
Execute the command.
You should now be able to see log and metrics data in OpenObserve. We will simulate some data in the next section to add some stress to the system and see what happens!
sudo nano /etc/otel-collector/config.yaml
The configuration file will look similar to this:
receivers:
  hostmetrics:
    collection_interval: 30s
    scrapers:
      cpu:
        metrics:
          system.cpu.time:
            enabled: true
      memory:
        metrics:
          system.memory.usage:
            enabled: true
          system.memory.utilization:
            enabled: true
      disk:
        metrics:
          system.disk.io:
            enabled: true
          system.disk.operations:
            enabled: true
      network:
        metrics:
          system.network.io:
            enabled: true

  filelog:
    include: ["/var/log/*.log"]
    start_at: beginning

processors:
  batch:
    timeout: 1s
    send_batch_size: 1024

exporters:
  otlphttp:
    endpoint: "https://cloud.openobserve.ai/api/default"
    headers:
      Authorization: "Basic <YOUR_AUTH_TOKEN>"
      stream-name: "default"

service:
  pipelines:
    metrics:
      receivers: [hostmetrics]
      processors: [batch]
      exporters: [otlphttp]
    logs:
      receivers: [filelog]
      processors: [batch]
      exporters: [otlphttp]
Some notes to keep in mind:
filelog:
  include: ["/var/log/*.log", "/path/to/your/custom/app.log"]
sudo systemctl restart otel-collector
sudo systemctl enable otel-collector

# Verify status and check logs for any issues
sudo systemctl status otel-collector
sudo journalctl -u otel-collector -f
To ensure that all dashboard panels are populated with plenty of meaningful data, we will generate both logs and metrics using a single script.
First, create the script file:
nano generate_load.sh
Then, paste the following script into the file:
#!/bin/bash

echo "Starting comprehensive system load generation..."

# Install required tools if not already installed
sudo yum install -y stress-ng sysstat

# Function to generate system logs during load generation
generate_logs() {
    logger "System load test started"
    logger "CPU intensive operation running"
    logger "Memory allocation in progress"
    logger "Disk I/O operations started"
    logger "Network activity simulation running"
    logger -p user.warning "High CPU usage detected"
    logger -p user.error "Memory threshold exceeded"
}

# Generate CPU load (multiple cores)
stress-ng --cpu 2 --cpu-method all --timeout 60s &

# Generate memory load (256 MB)
stress-ng --vm 1 --vm-bytes 256M --timeout 60s &

# Generate disk I/O (write and read operations)
dd if=/dev/zero of=/tmp/testfile bs=1M count=1024 oflag=direct &
dd if=/tmp/testfile of=/dev/null bs=1M &

# Generate network I/O (simulate network traffic)
for i in {1..10}; do
    curl -s https://www.google.com > /dev/null &
    wget -q https://www.google.com -O /dev/null &
done

# Monitor system metrics during load generation (every 10 seconds)
echo "Monitoring system metrics for 60 seconds..."
for i in {1..6}; do
    echo "=== System stats at interval $i/6 ==="

    # CPU stats
    echo "CPU Usage:"
    top -bn1 | grep "Cpu(s)" | sed "s/.*, *\([0-9.]*\)%* id.*/\1/" | awk '{print 100 - $1"%"}'

    # Memory stats
    echo "Memory Usage:"
    free -m

    # Disk stats
    echo "Disk Usage:"
    df -h

    # Generate logs at each interval to simulate activity in logs panel
    generate_logs

    sleep 10
done

# Cleanup temporary files created during disk I/O simulation
rm -f /tmp/testfile

echo "Load generation complete"
Finally, save and close the file.
chmod +x generate_load.sh
./generate_load.sh
This script will generate enough activity to populate various dashboard panels in OpenObserve.
Navigate to the Logs section in OpenObserve to verify that log entries are being ingested correctly:

Now, navigate to Streams, where you can view all ingested data, including Logs and Metrics in this case:
Now that you have some sample data to work with, let’s build dashboards to actually derive some insights from all this information.
Although you can create any number of customized dashboards and dashboard panels within OpenObserve, the easiest way to get started is to import pre-built dashboards from OpenObserve's repository:
This will create a comprehensive dashboard with panels for CPU usage, memory usage, disk I/O, network traffic, and more:
If you're not seeing logs or metrics in OpenObserve, or if you're encountering errors, here are some practical steps to help you resolve the issues.
The first step is to check the OpenTelemetry Collector logs for any errors that may have occurred during startup or operation:
sudo journalctl -u otel-collector -f | grep Error
This command will display any errors related to the collector. Look for issues such as misconfigurations, permission problems, or connectivity errors.
Ensure the OpenTelemetry Collector has sufficient permissions to read the necessary log files. The collector may encounter "permission denied" errors when trying to access specific system logs.
Check the permissions of the log files:
sudo ls -l /var/log/
If you see permission issues (e.g., permission denied), update the permissions of the specific log files:
# Adjust permissions for specific log files
sudo chmod 644 /var/log/cloud-init.log /var/log/cloud-init-output.log /var/log/tallylog
This will allow the collector to read these files and forward their contents to OpenObserve.
Whenever you make changes to the configuration file or adjust file permissions, it's essential to restart the OpenTelemetry Collector to apply those changes:
sudo systemctl restart otel-collector
After restarting, verify that the collector is running without issues:
sudo systemctl status otel-collector
If everything looks good, check if data is flowing into OpenObserve by reviewing both logs and metrics in the UI, as shown above.
⚠️ Be sure to shut down any EC2 instances you aren’t using (like the one we created in this example!) to avoid unnecessary charges.
Congratulations! You have successfully set up a comprehensive monitoring solution for your AWS EC2 instance using OpenObserve. With real-time log ingestion and detailed metrics collection in place, you now have the tools to derive deep insights into your infrastructure's performance and security.
What’s next? Here are some best practices to consider to stay ahead:
Ready to take your monitoring even further? Explore more features by following our OpenObserve Quickstart Guide, and reach out if you have any questions along the way!
Nitya is a Developer Advocate at OpenObserve, with a diverse background in software development, technical consulting, and organizational leadership. Nitya is passionate about open-source technology, accessibility, and sustainable innovation.


