How to Monitor AWS Lambda Logs Using CloudWatch & Kinesis Firehose

Nitya Timalsina
November 19, 2024
10 min read
Don’t forget to share!
Try OpenObserve Cloud today for more efficient and performant observability.
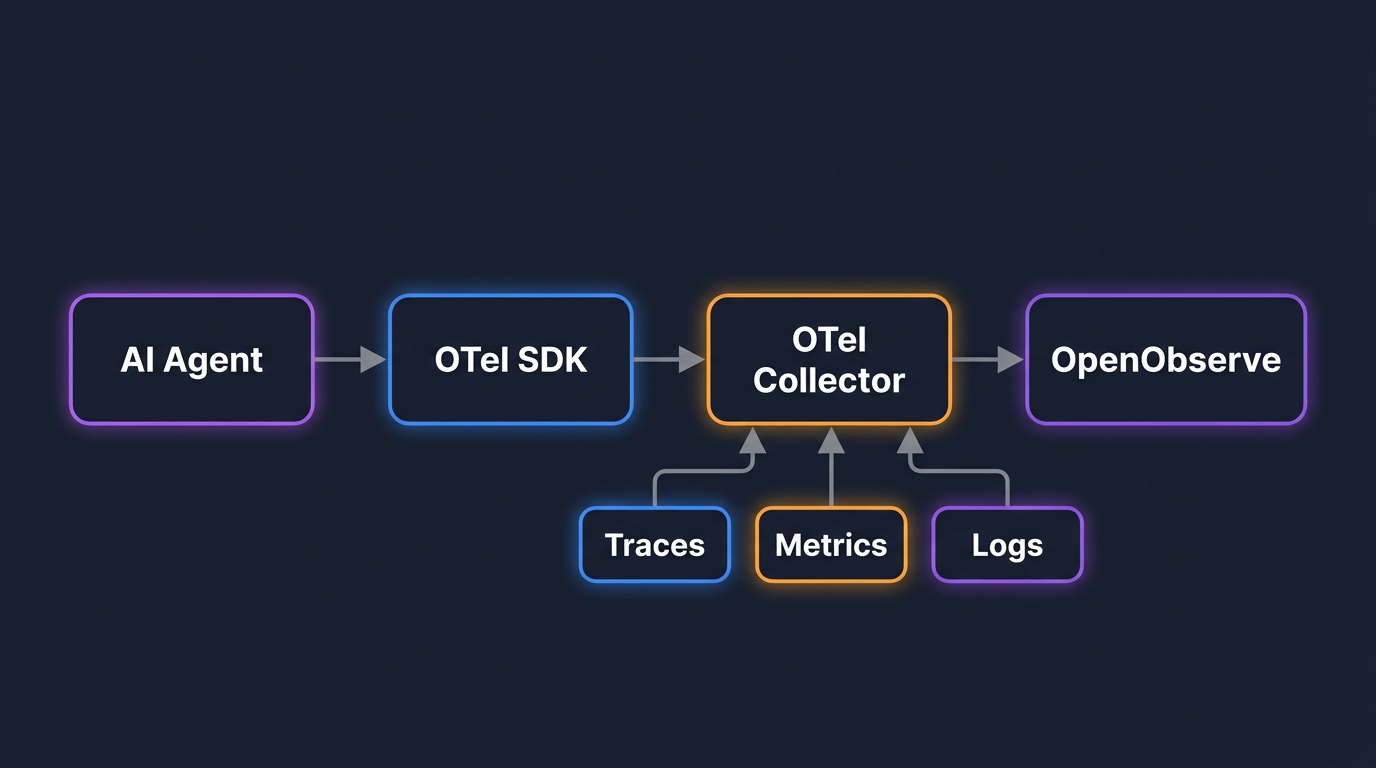
Monitoring AWS Lambda logs is essential for tracking performance, detecting errors, and optimizing resource usage. In this guide, we’ll set up an AWS Lambda function that processes files, logs events, and ultimately sends those logs to OpenObserve via CloudWatch and Amazon Kinesis Data Firehose.
Why monitor AWS Lambda logs in the first place? Essentially, monitoring AWS Lambda logs helps you:
So let’s get started!
First, we will create a simple Lambda function that simulates a real-world scenario where files are uploaded and processed by Lambda, generating structured logs at different levels (INFO, WARNING, ERROR):
import json
import logging
import time
import random
import os

# Set up logging based on environment variable for log level (OPTIONAL)
log_level = os.getenv('LOG_LEVEL', 'INFO')
logger = logging.getLogger()
logger.setLevel(log_level)

# Simulate a file processing system with multiple log levels
def process_file(file_metadata):
    logger.info(f"Starting file processing for file: {file_metadata['file_name']}")

    # Simulate processing time
    time.sleep(random.uniform(0.5, 2))

    # Log different levels of messages based on file size
    file_size = file_metadata['file_size']

    if file_size > 1000:
        logger.warning(f"File {file_metadata['file_name']} is large ({file_size}MB). Processing might take longer.")

    if random.choice([True, False]):
        logger.error(f"Error occurred while processing file {file_metadata['file_name']}.")
        raise Exception(f"Failed to process file {file_metadata['file_name']}")

    logger.info(f"File {file_metadata['file_name']} processed successfully.")
    return {"status": "success", "message": f"File {file_metadata['file_name']} processed successfully."}

def lambda_handler(event, context):
    try:
        # Log incoming event
        logger.info(f"Received event: {json.dumps(event)}")

        # Extract file metadata from event
        file_metadata = event.get('file_metadata', {})

        # Call process_file function
        result = process_file(file_metadata)

        # Log success
        logger.info(f"Process result: {result}")

        return {
            'statusCode': 200,
            'body': json.dumps(result)
        }

    except Exception as e:
        logger.error(f"Error during execution: {str(e)}")
        return {
            'statusCode': 500,
            'body': json.dumps({"error": str(e)})
        }
| Key | Value |
|---|---|
| LOG_LEVEL | INFO |
Although optional, customizing logging with environment variables like LOG_LEVEL allows you to dynamically control log verbosity without redeploying your function.
For example, in production environments, you may want fewer logs (INFO level), but during debugging or testing phases, you may want more detailed logs (DEBUG level). This flexibility is crucial for maintaining efficient observability while reducing unnecessary noise in production logs.
Now that our Lambda function is ready to go, let’s set up Kinesis Firehose to forward logs from CloudWatch to OpenObserve.
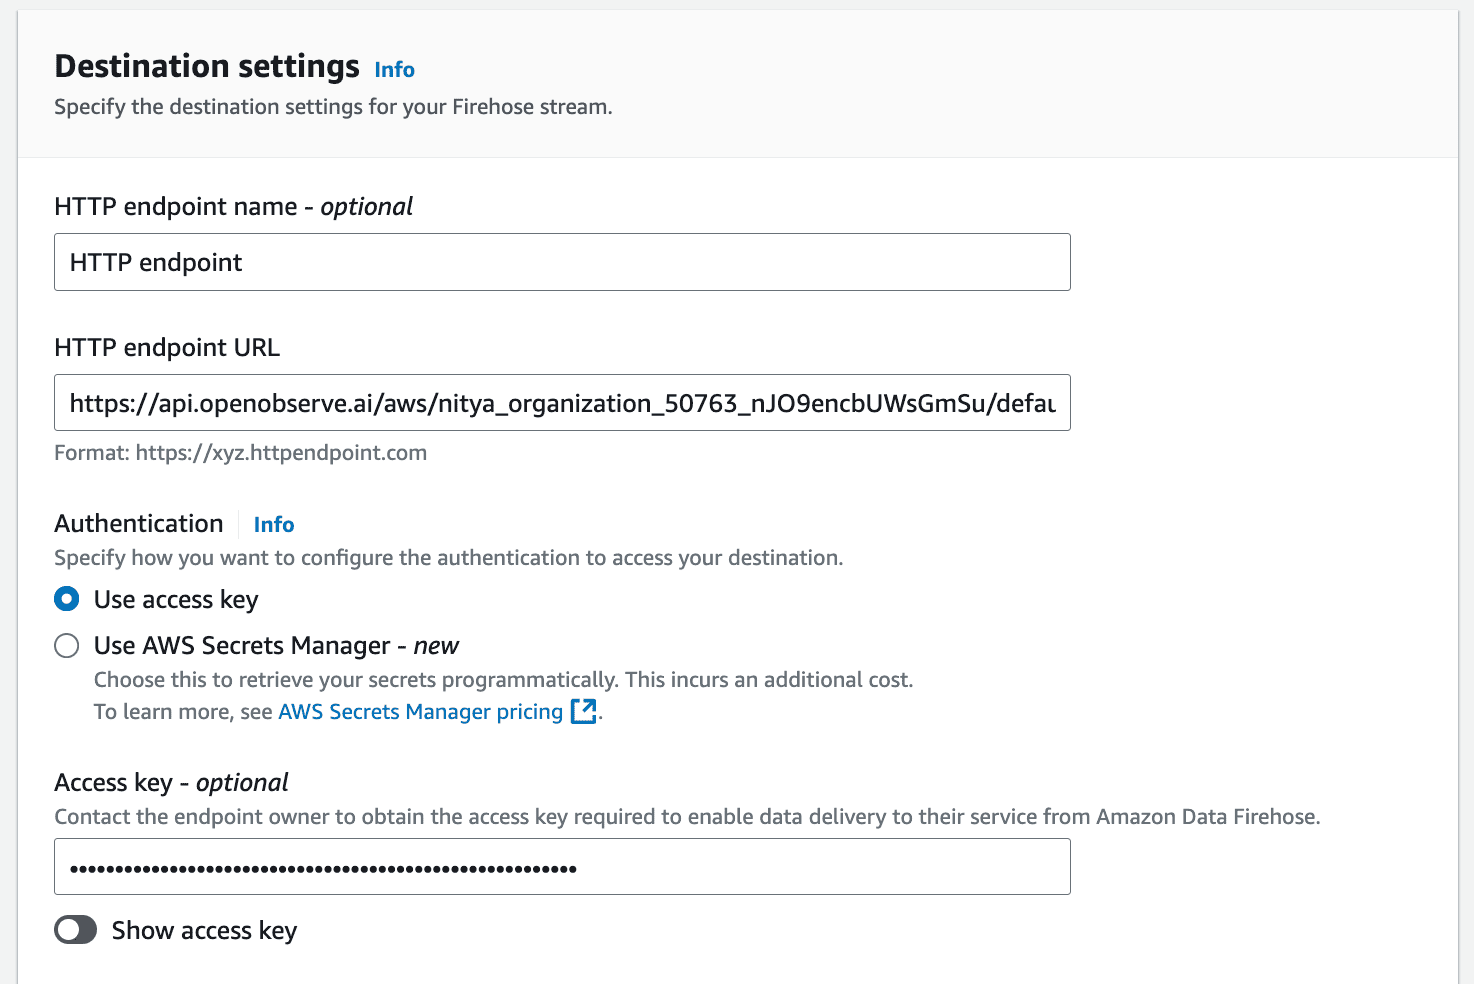
Backup settings are crucial in case something goes wrong with data delivery or processing:
Now that we have set up our delivery stream, we need to subscribe our Lambda function’s CloudWatch Logs group to this stream so that logs are forwarded from CloudWatch to OpenObserve via Kinesis Firehose.
To allow CloudWatch Logs to send data into your Kinesis Firehose stream, you must first create an IAM role with appropriate permissions using a custom trust policy.
{
    "Version": "2012-10-17",
    "Statement": [
        {
            "Effect": "Allow",
            "Principal": {
                "Service": "logs.amazonaws.com"
            },
            "Action": "sts:AssumeRole"
        }
    ]
}
This allows CloudWatch Logs (logs.amazonaws.com) to assume this role when sending data into Kinesis Firehose.
This ensures that all logs generated by your Lambda function are automatically forwarded from CloudWatch Logs to OpenObserve via Kinesis Firehose.
As a result, we are now able to start seeing logs coming into OpenObserve:
Now, we will invoke the Lambda function using realistic test cases to simulate a high volume of logs being generated and sent to OpenObserve.
First things first, to test that everything is working correctly, invoke your Lambda function with detailed test cases simulating real-world scenarios:
{
  "file_metadata": {
    "file_name": "document.pdf",
    "file_size": 500
  }
}
{
  "file_metadata": {
    "file_name": "large_video.mp4",
    "file_size": 1500
  }
}
{
  "file_metadata": {
    "file_name": "corrupt_file.txt",
    "file_size": null
  }
}
Optionally, you can also leverage a wide variety of test templates available within the AWS Lambda Console to test additional scenarios suitable for your specific Lambda function(s):
Once you've invoked your Lambda function a few times with different test cases, you should be able to see some meaningful logs within OpenObserve:
You can now run queries on these logs or create custom visualizations and dashboards for further analysis and continuous monitoring. You have created a robust and scalable system to monitor logs for any of your Lambda functions!
Lambda Extensions offer another way to capture AWS Lambda logs with their own sets of pros and cons. We will cover those details in an upcoming blog post, along with the nuances of each approach.
By using Amazon Kinesis Data Firehose in this example, we have leveraged a scalable service that integrates seamlessly with CloudWatch Logs without modifying runtime behavior. However, there is a broader world of AWS Lambda monitoring to be explored, and we will dive deeper into an alternative approach using Lambda Extensions in a future article.
Today, you have set up an efficient pipeline using Amazon Kinesis Data Firehose to forward AWS Lambda logs from CloudWatch into OpenObserve without needing any custom collectors or agents. You have also configured environment variables in your Lambda function for better observability with custom logs at various levels (INFO, WARNING, ERROR). Finally, you have transported log data to OpenObserve for real-time monitoring and continuous visualization of key log data.
As you can already see, this setup provides complete visibility into your serverless applications while minimizing complexity—enabling you to create an efficient and easily scalable observability workflow.
Want to learn more about optimizing the observability of your Lambda functions and serverless applications? Get started with OpenObserve today, and explore the possibilities.
Nitya is a Developer Advocate at OpenObserve, with a diverse background in software development, technical consulting, and organizational leadership. Nitya is passionate about open-source technology, accessibility, and sustainable innovation.