How to monitor AWS RDS Logs and events with AWS Cloudwatch and Kinesis Data Firehose

Chaitanya Sistla
December 19, 2024
4 min read
Don’t forget to share!
Try OpenObserve Cloud today for more efficient and performant observability.
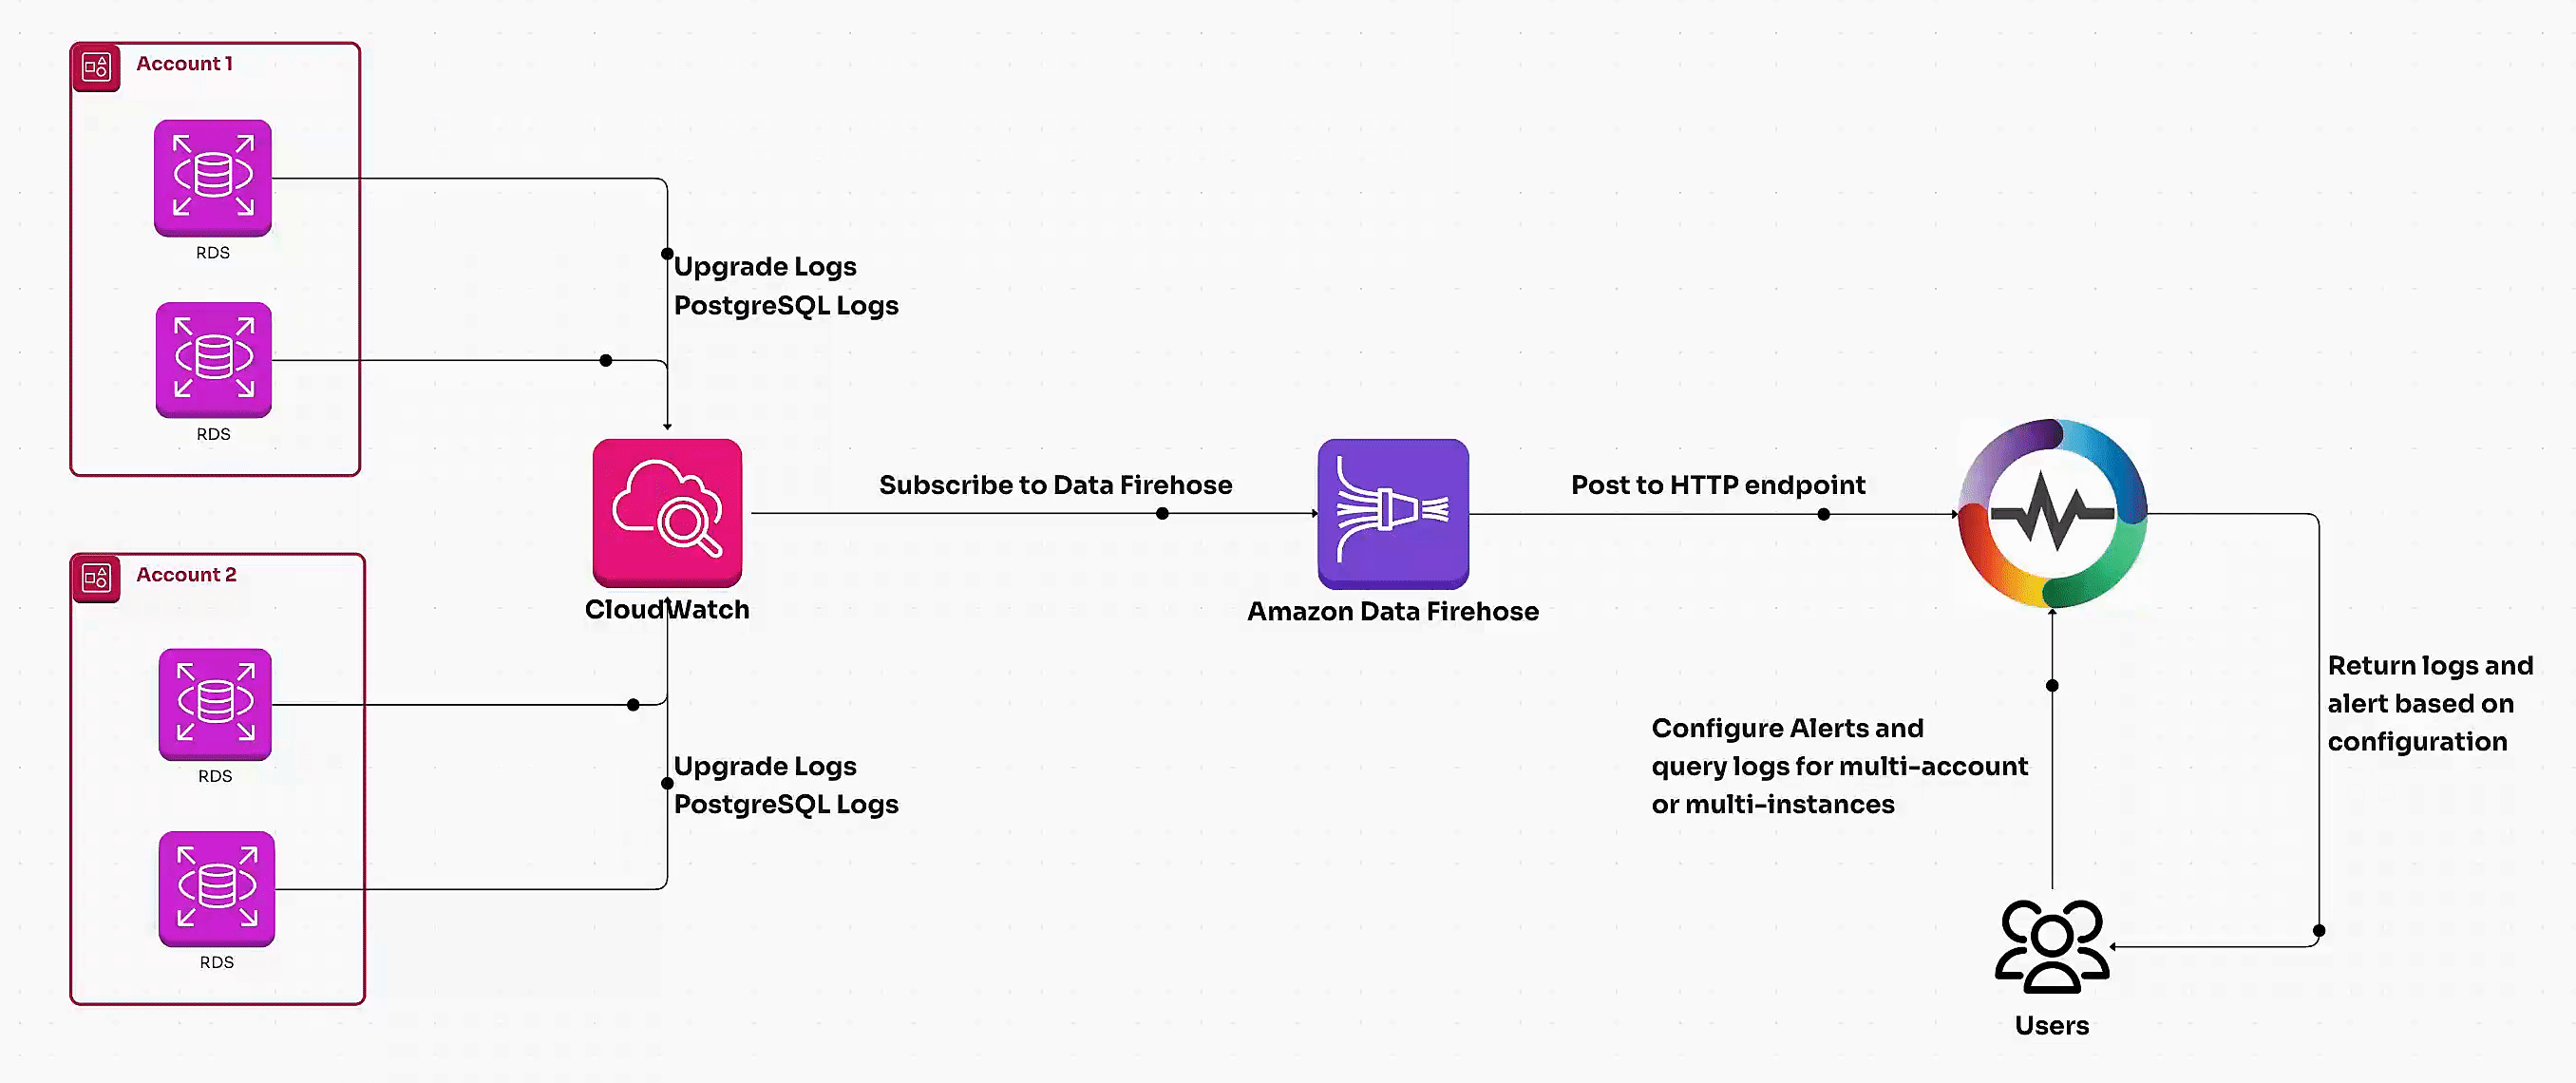
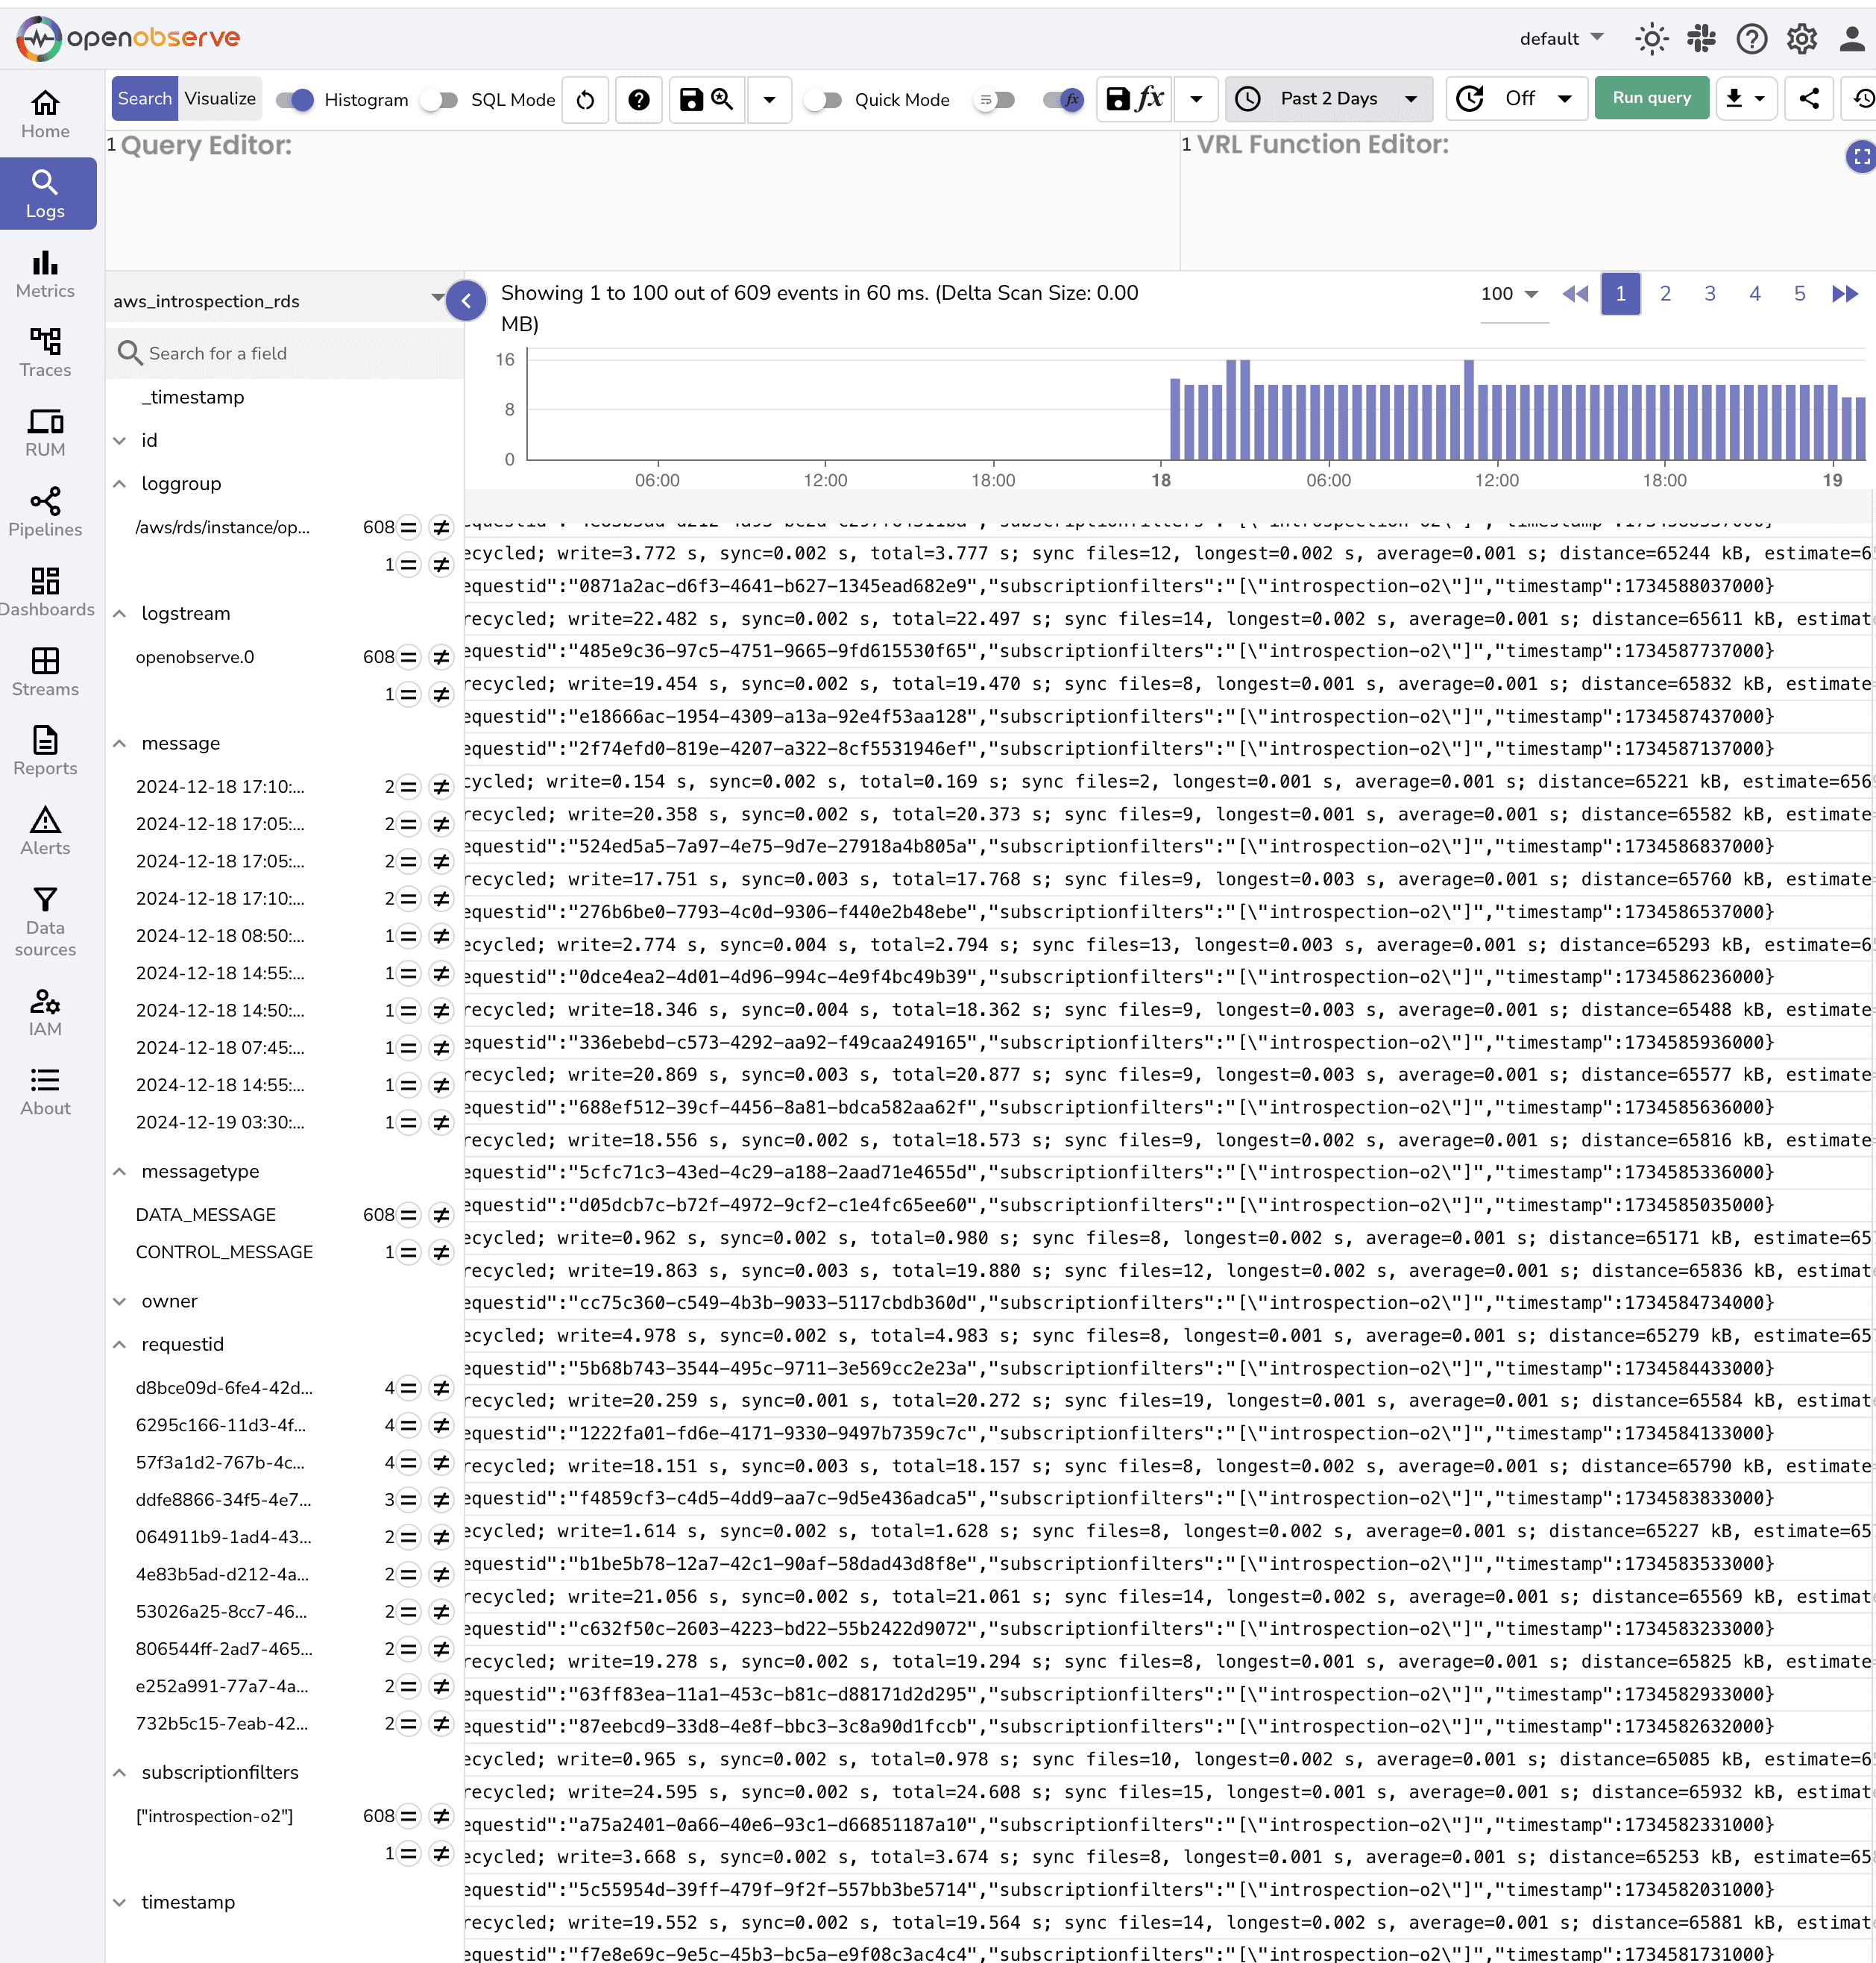
Effective monitoring of AWS RDS logs is vital to ensuring the reliability, performance, and scalability of your database systems, especially when managing multiple AWS accounts and RDS instances. This guide provides a step-by-step walkthrough for ingesting, analyzing, and visualizing AWS RDS logs to enhance your database monitoring strategy.
RDS logs offer invaluable insights into your database's health, performance, and behavior. By leveraging these logs, you can:
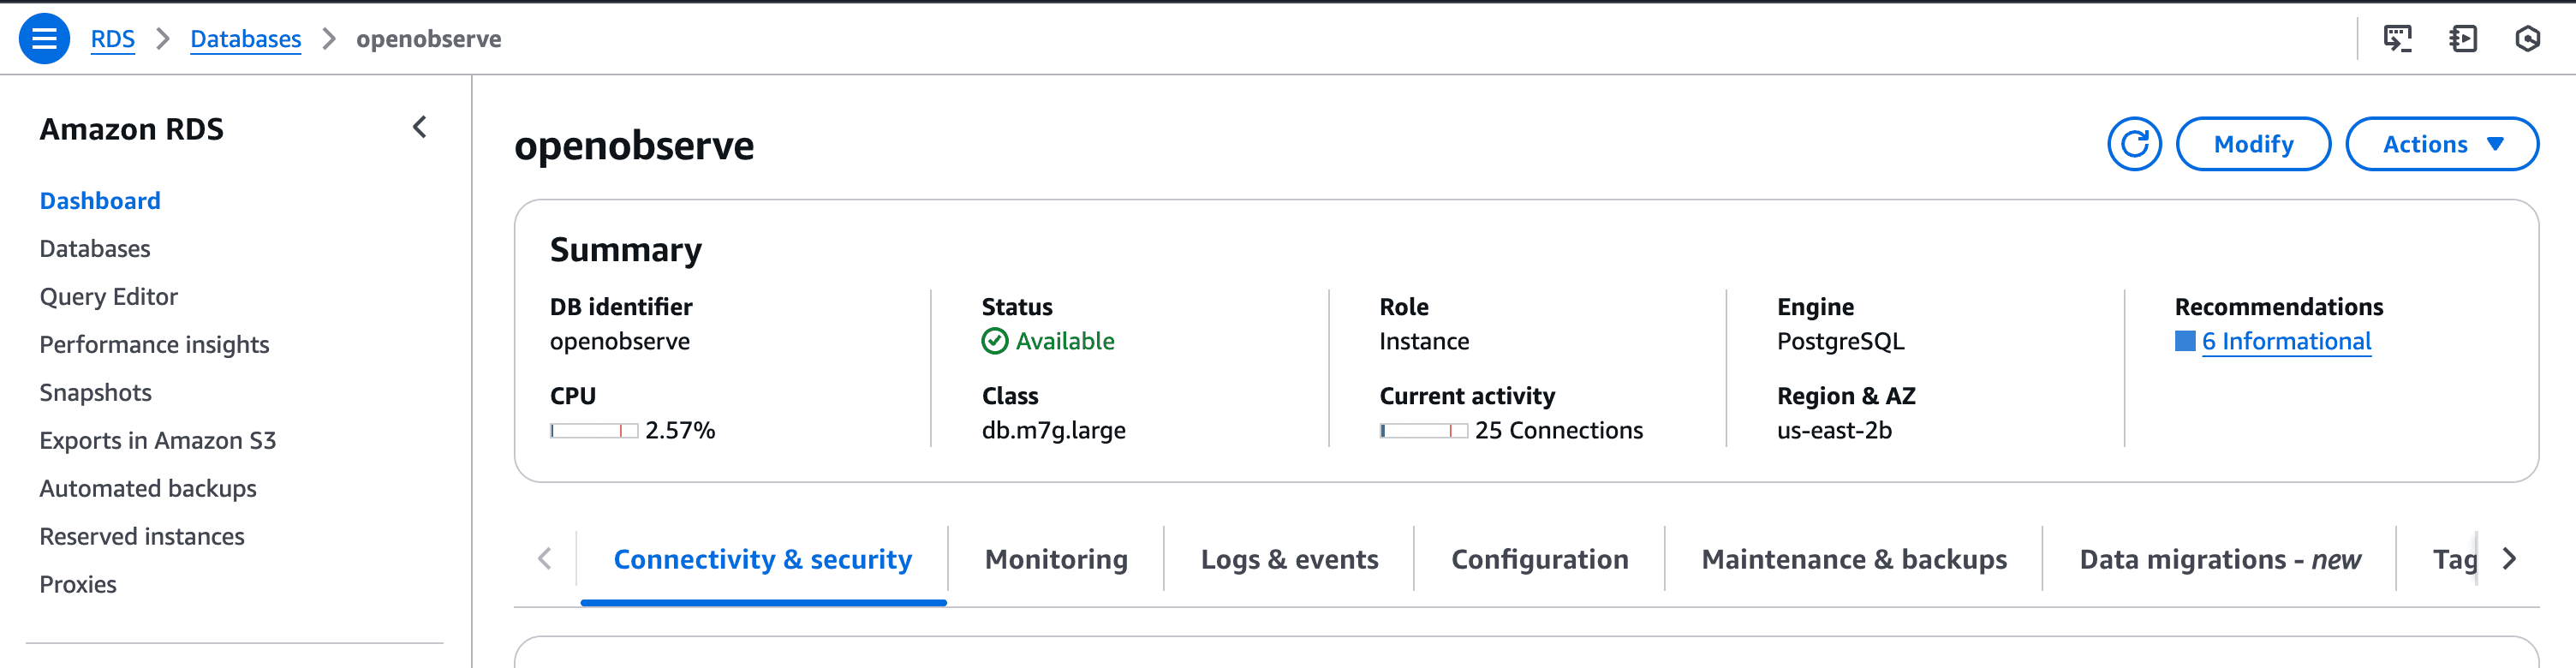
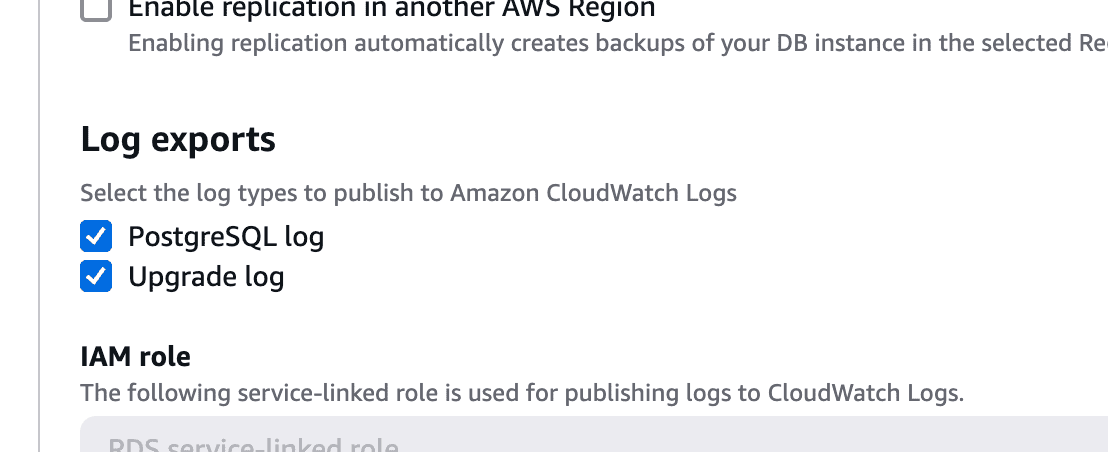
Before starting, ensure:
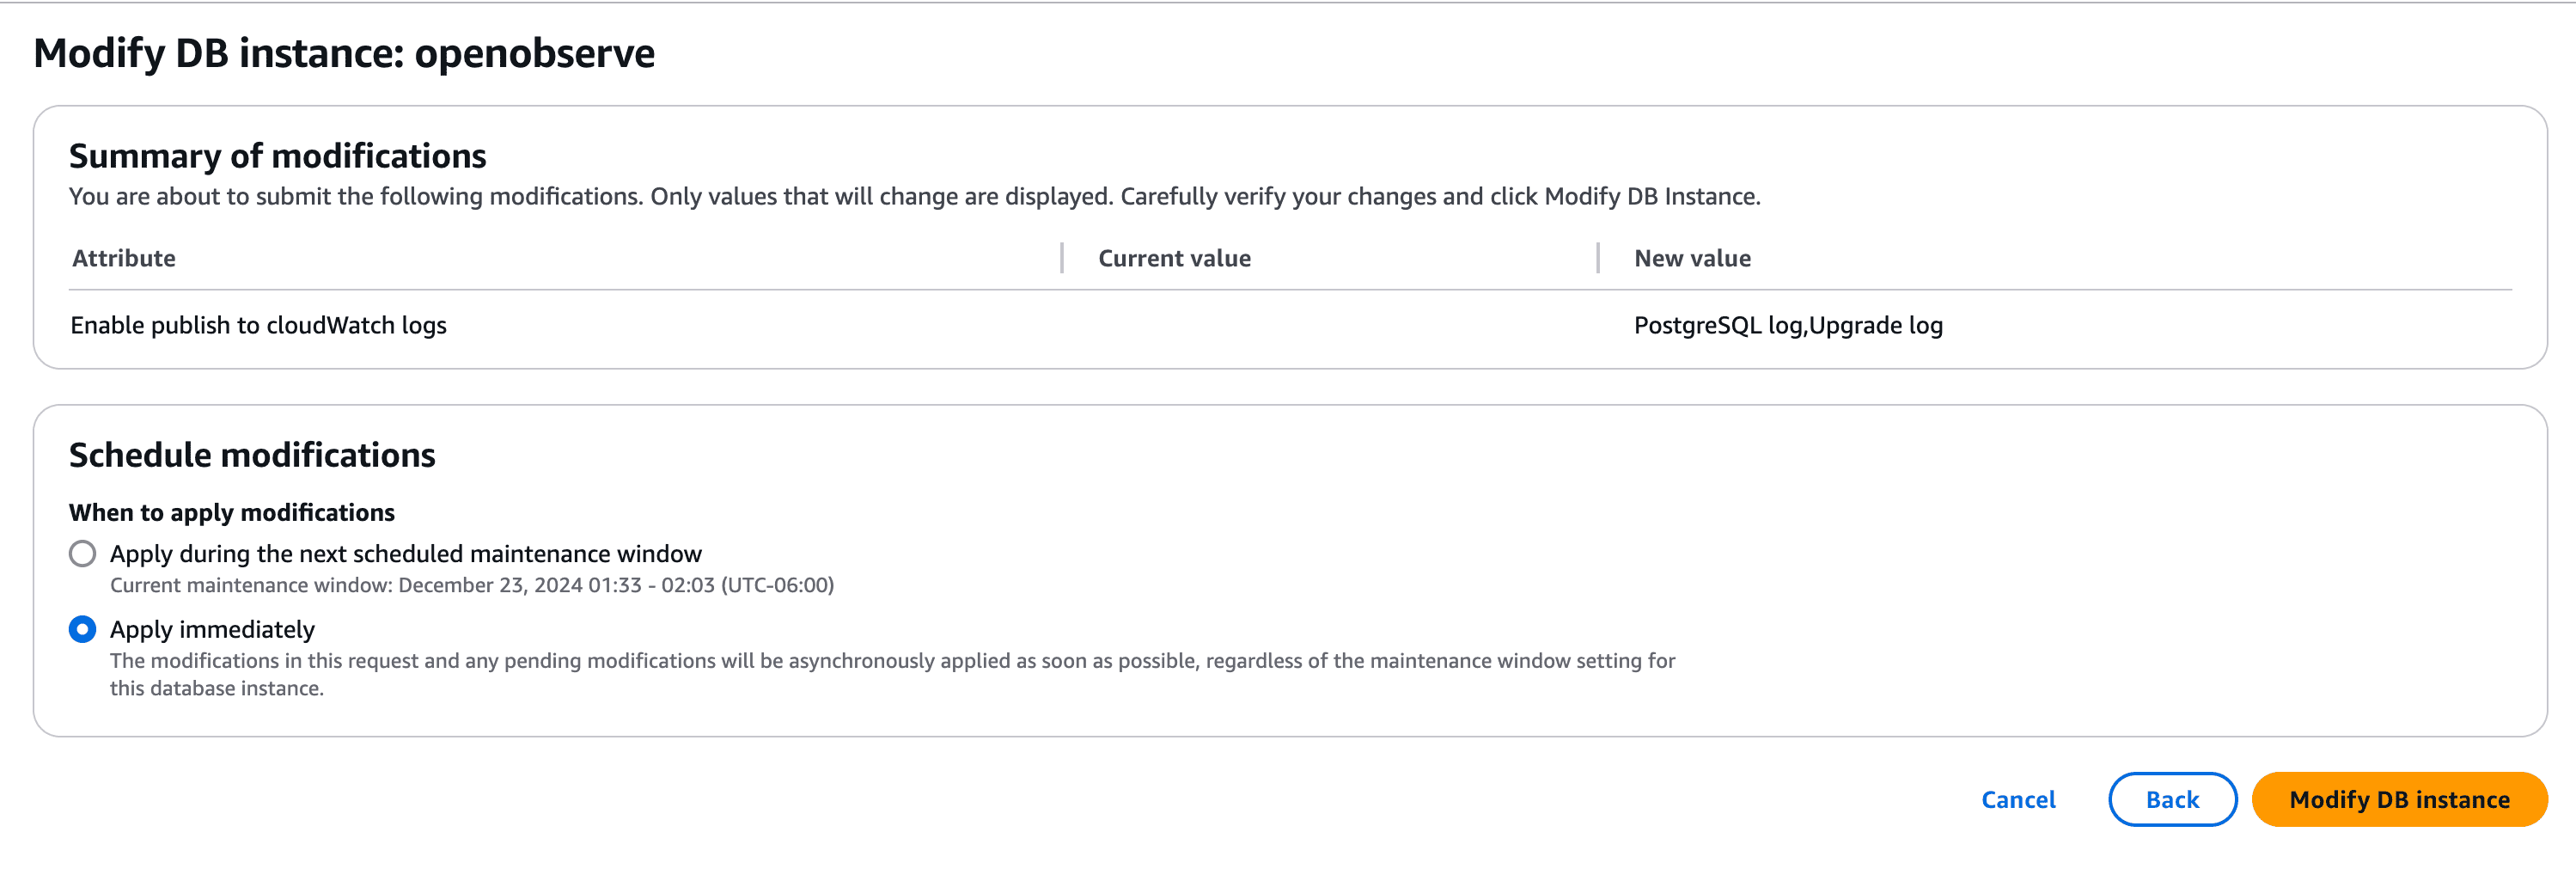
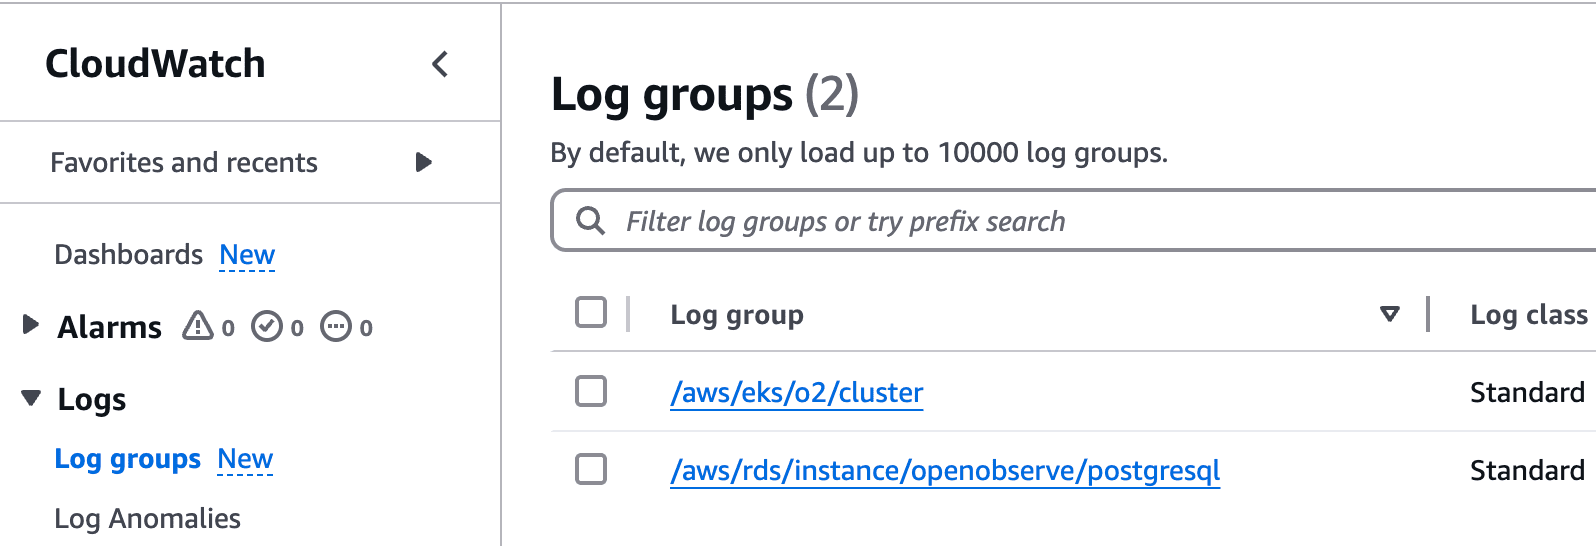
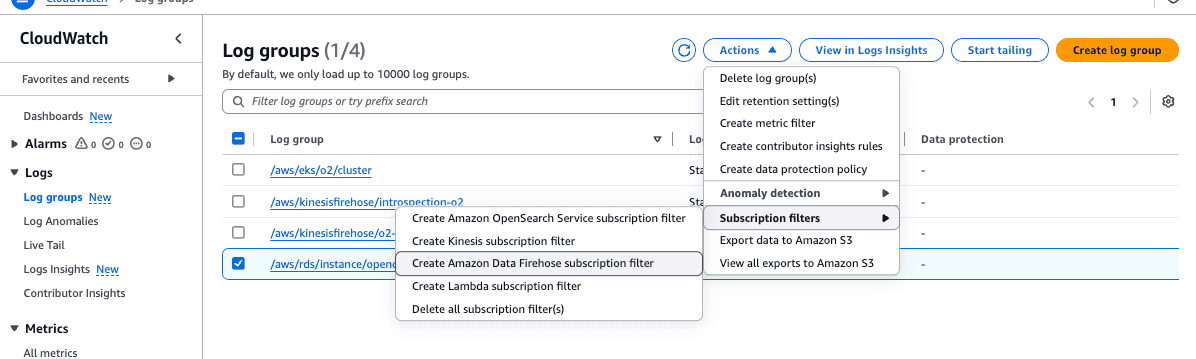
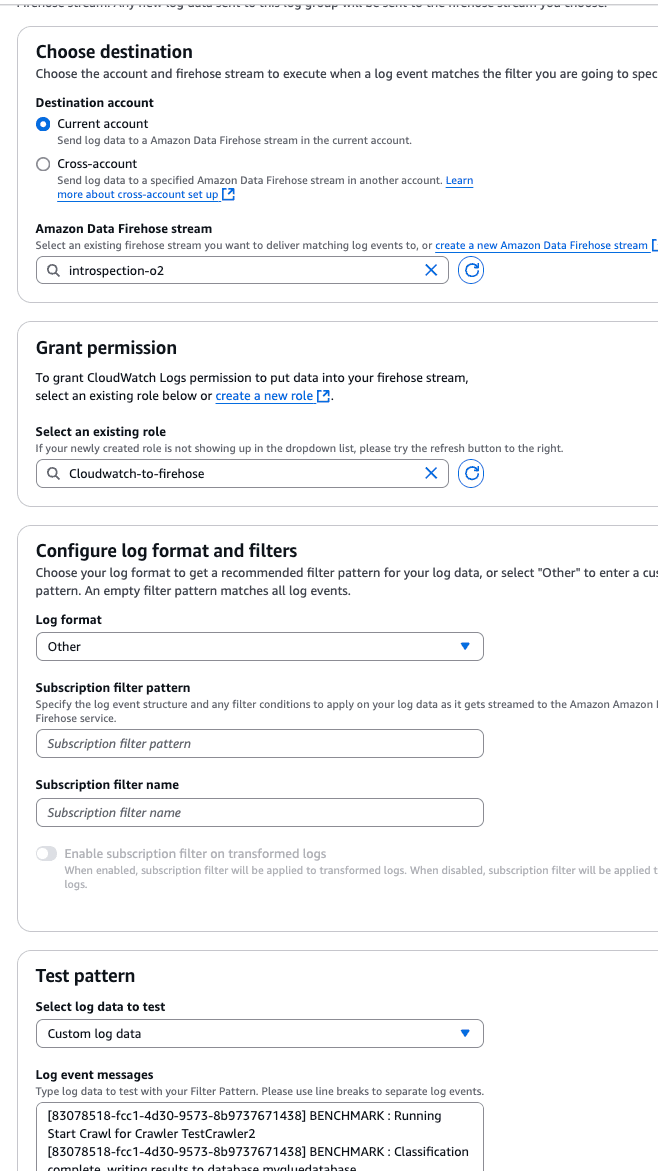
CloudWatch streams metrics via Kinesis, which acts as a transport mechanism. Follow these steps:
RDSlogStream). 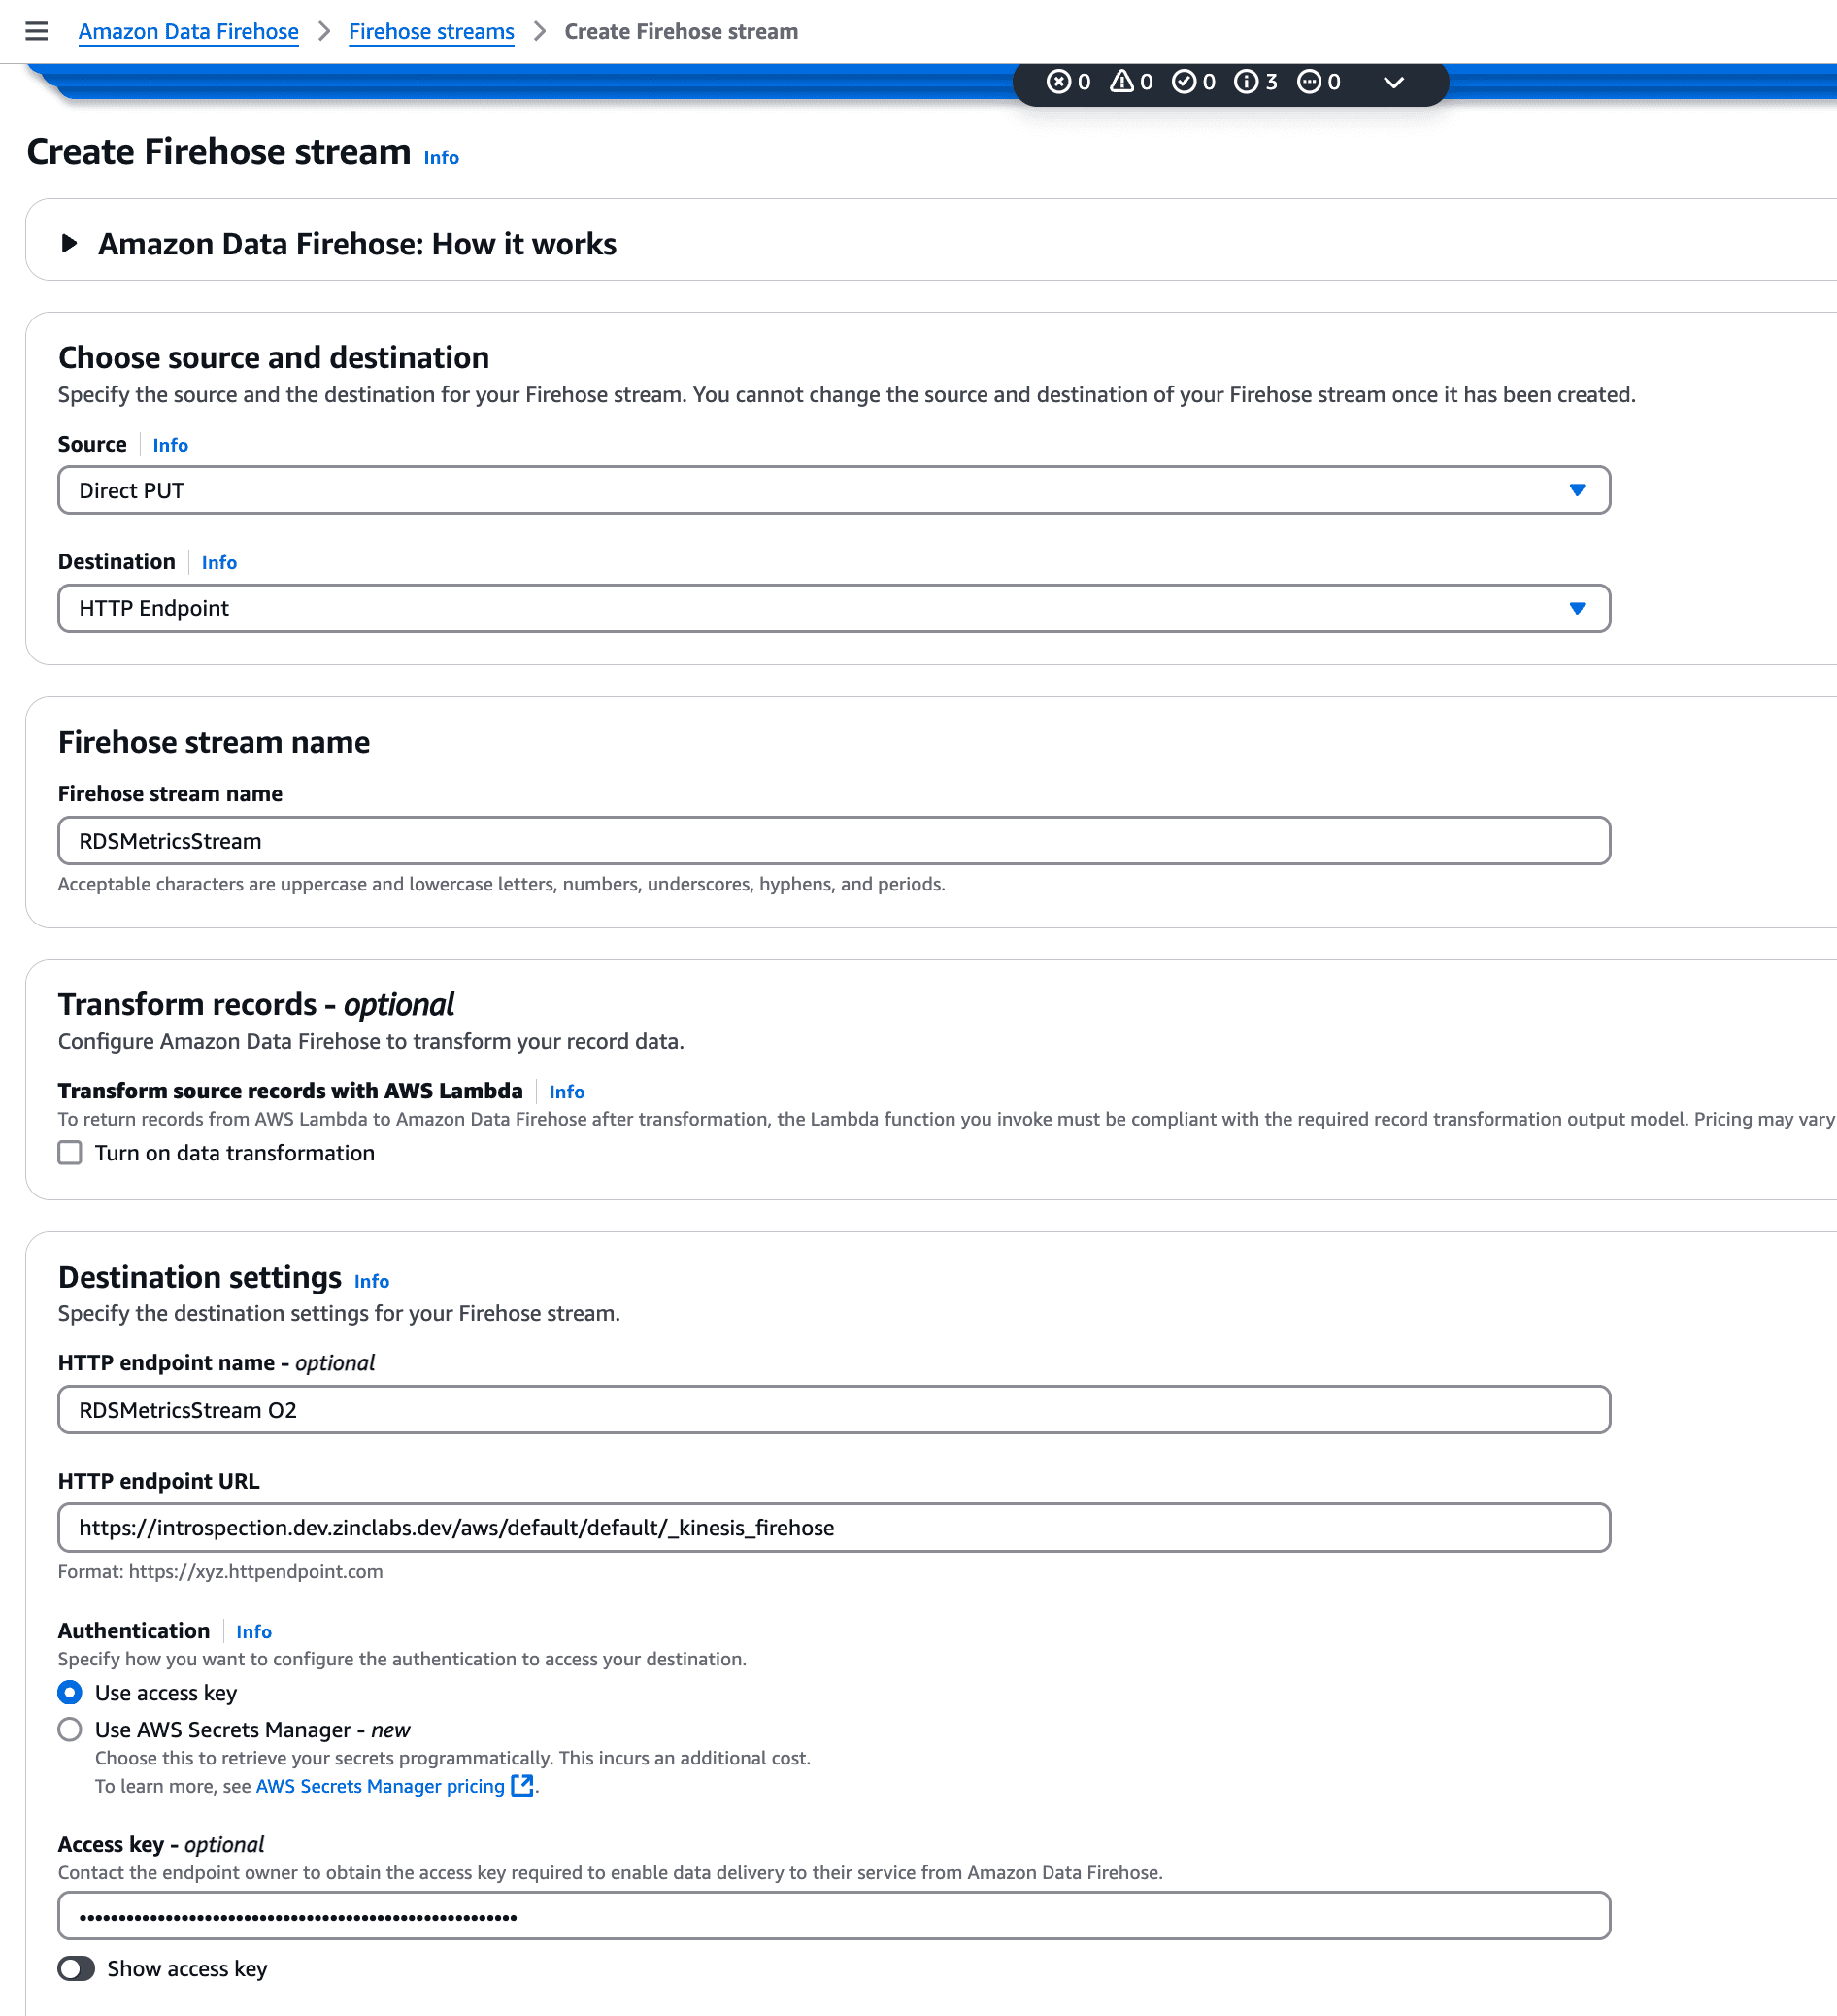
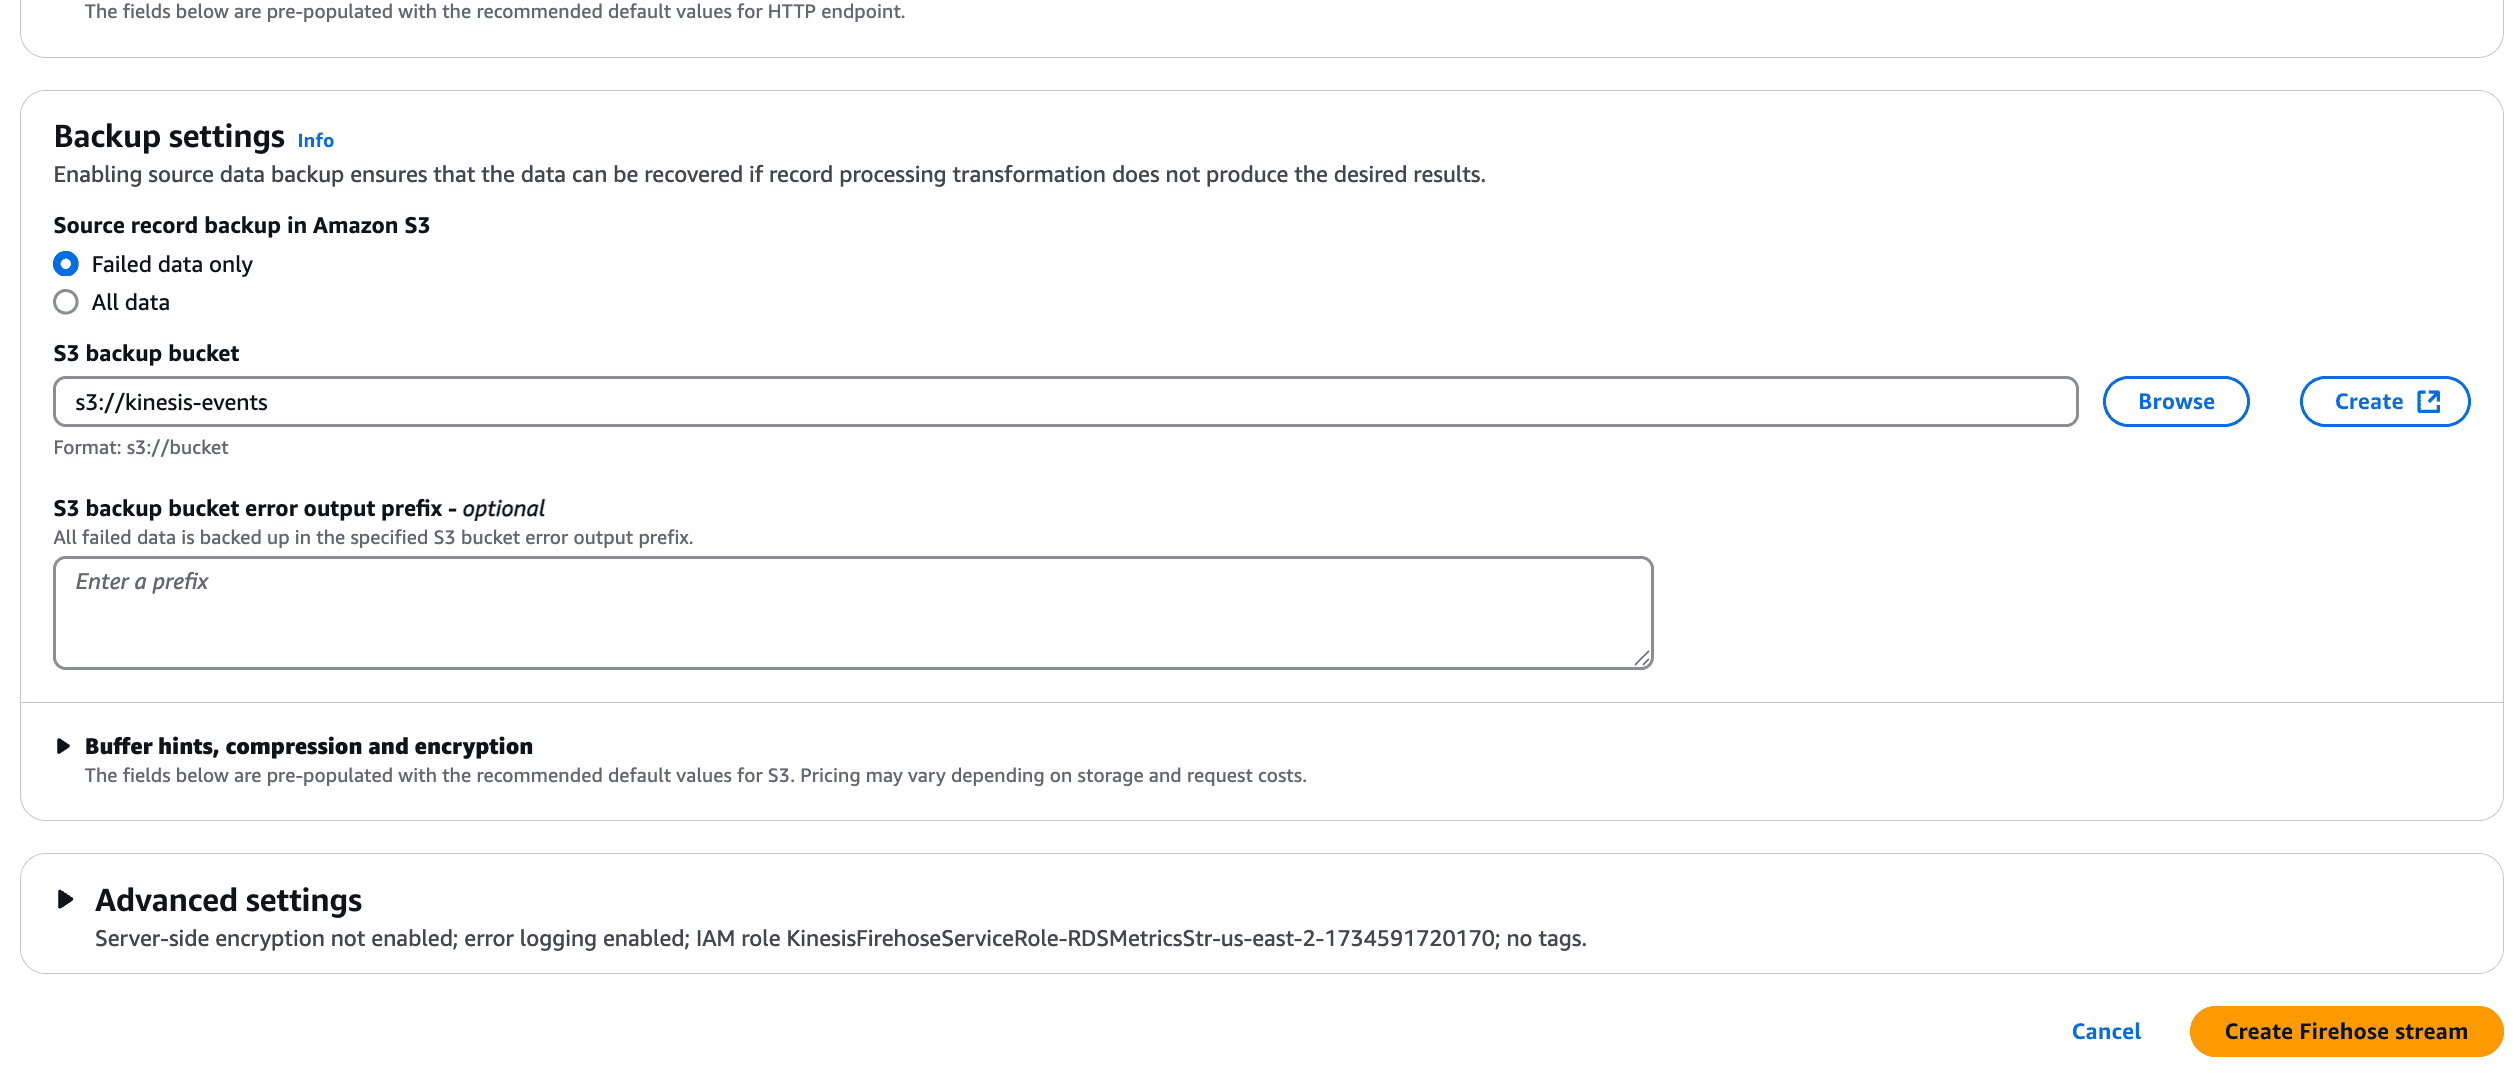
Refer to this guide for detailed Kinesis configuration steps.
| Feature/Aspect | With OpenObserve | Without OpenObserve |
|---|---|---|
| Centralized Monitoring | Logs from multiple AWS accounts consolidated in one view | Logs scattered across individual AWS accounts |
| Proactive Issue Detection | Automated alerts on log anomalies and errors | Manual inspection required to detect issues options. |
| Detailed Query Insights | Analyze slow query logs for performance optimization | Limited to basic metrics without granular details |
| Advanced Security Auditing | Access logs analyzed for unauthorized activities | Minimal visibility into security-related events |
By following these steps, you can set up an end-to-end monitoring solution for AWS RDS logs using CloudWatch and OpenObserve. This approach ensures:
Ready to optimize your database performance and simplify your observability workflows? Visit our website to learn more details about how the platform works.
Chaitanya Sistla is a Principal Solutions Architect with 17X certifications across Cloud, Data, DevOps, and Cybersecurity. Leveraging extensive startup experience and a focus on MLOps, Chaitanya excels at designing scalable, innovative solutions that drive operational excellence and business transformation.