How to Monitor Azure Kubernetes Service (AKS) with OpenObserve: End-to-End Setup

Manas Sharma
November 21, 2025
16 min read
Don’t forget to share!
Try OpenObserve Cloud today for more efficient and performant observability.
Running Azure Kubernetes Service (AKS) clusters comes with its own set of challenges, and monitoring is often at the top of that list. While Azure provides built-in monitoring through Azure Monitor and Log Analytics, many teams find themselves dealing with fragmented views, high costs, and complex configurations. You might have metrics in one place, logs in another, and traces somewhere else entirely. Sound familiar?
This is where OpenObserve changes the game. Instead of juggling multiple tools and paying premium prices for Azure Log Analytics, you get a unified observability platform that brings logs, metrics, and traces together in one place. The best part? Setting it up is straightforward, and the cost savings are significant.
In this guide, we'll walk you through deploying the OpenObserve Collector in your AKS cluster. This pre-configured OpenTelemetry collector comes with best practices built in, giving you out-of-the-box monitoring capabilities without the hassle. Whether you're a technical architect looking for implementation details or a decision maker evaluating monitoring solutions, this guide has you covered.
By the end, you'll have complete visibility into your AKS cluster with metrics, logs, events, and even automatic trace capture for your applications.
Prefer to jump straight to the setup? Skip to the deployment guide.
If you're currently using Azure's built-in monitoring, you're dealing with fragmented views, rising costs, and complex configurations. Here's why OpenObserve makes more sense:
Unified Observability: Azure splits your data across Monitor, Log Analytics, and Application Insights. OpenObserve brings logs, metrics, and traces into one platform with a single UI. Less context switching, faster troubleshooting.
Cost Efficiency: Azure Log Analytics pricing scales quickly. OpenObserve uses object storage with columnar compression, reducing costs significantly without compromising on query performance or functionality.
Extended Retention: Need compliance-friendly retention? OpenObserve's efficient storage lets you keep data longer without expensive hot storage tiers or complex replica setups. Your data stays queryable without the sticker shock.
Multi-Cloud and Hybrid Ready: Running workloads across Azure, on-prem, and other clouds? OpenObserve provides a single monitoring backend for everything. No more blind spots from managing separate systems for each environment.
Developer Friendly: OpenObserve prioritizes simplicity. Intuitive setup, accessible query language, and dashboards that make sense from day one. Spend less time fighting your tools, more time understanding your systems.
The bottom line: OpenObserve delivers complete observability in one package while Azure requires multiple services. You get flexibility without vendor lock-in, predictable costs without query surcharges, and unified visibility without fragmentation.
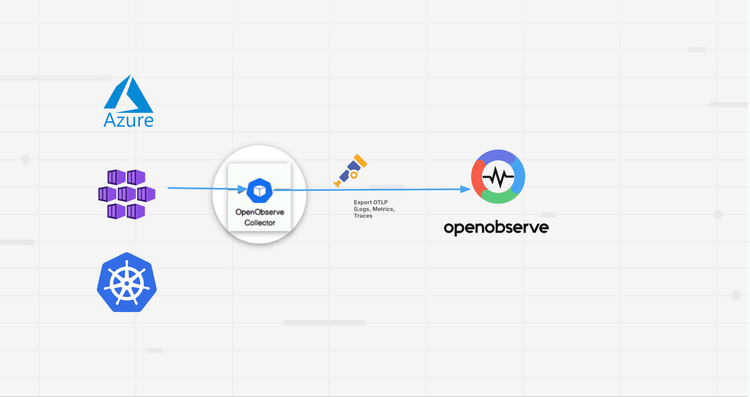
The OpenObserve Collector sits at the heart of your monitoring setup. Think of it as a pre-configured OpenTelemetry Collector that's been optimized with best practices for Kubernetes environments. Instead of spending hours configuring receivers, processors, and exporters, you get a ready-to-use solution that just works.
The collector isn't just another agent you deploy and forget. It's designed specifically to capture all the signals you need from your Kubernetes cluster without manual configuration. When you deploy it, you immediately get metrics collection from your cluster, event gathering for real-time monitoring, log aggregation from all your pods and containers, and automatic trace capture using OpenTelemetry's auto-instrumentation capabilities.
The OpenObserve Collector uses a two-tier architecture that balances efficiency with functionality. The Agent component runs as a DaemonSet, meaning one pod on each node in your cluster. These agents sit close to your workloads, collecting logs and metrics locally with minimal overhead. They're the eyes and ears on every node.
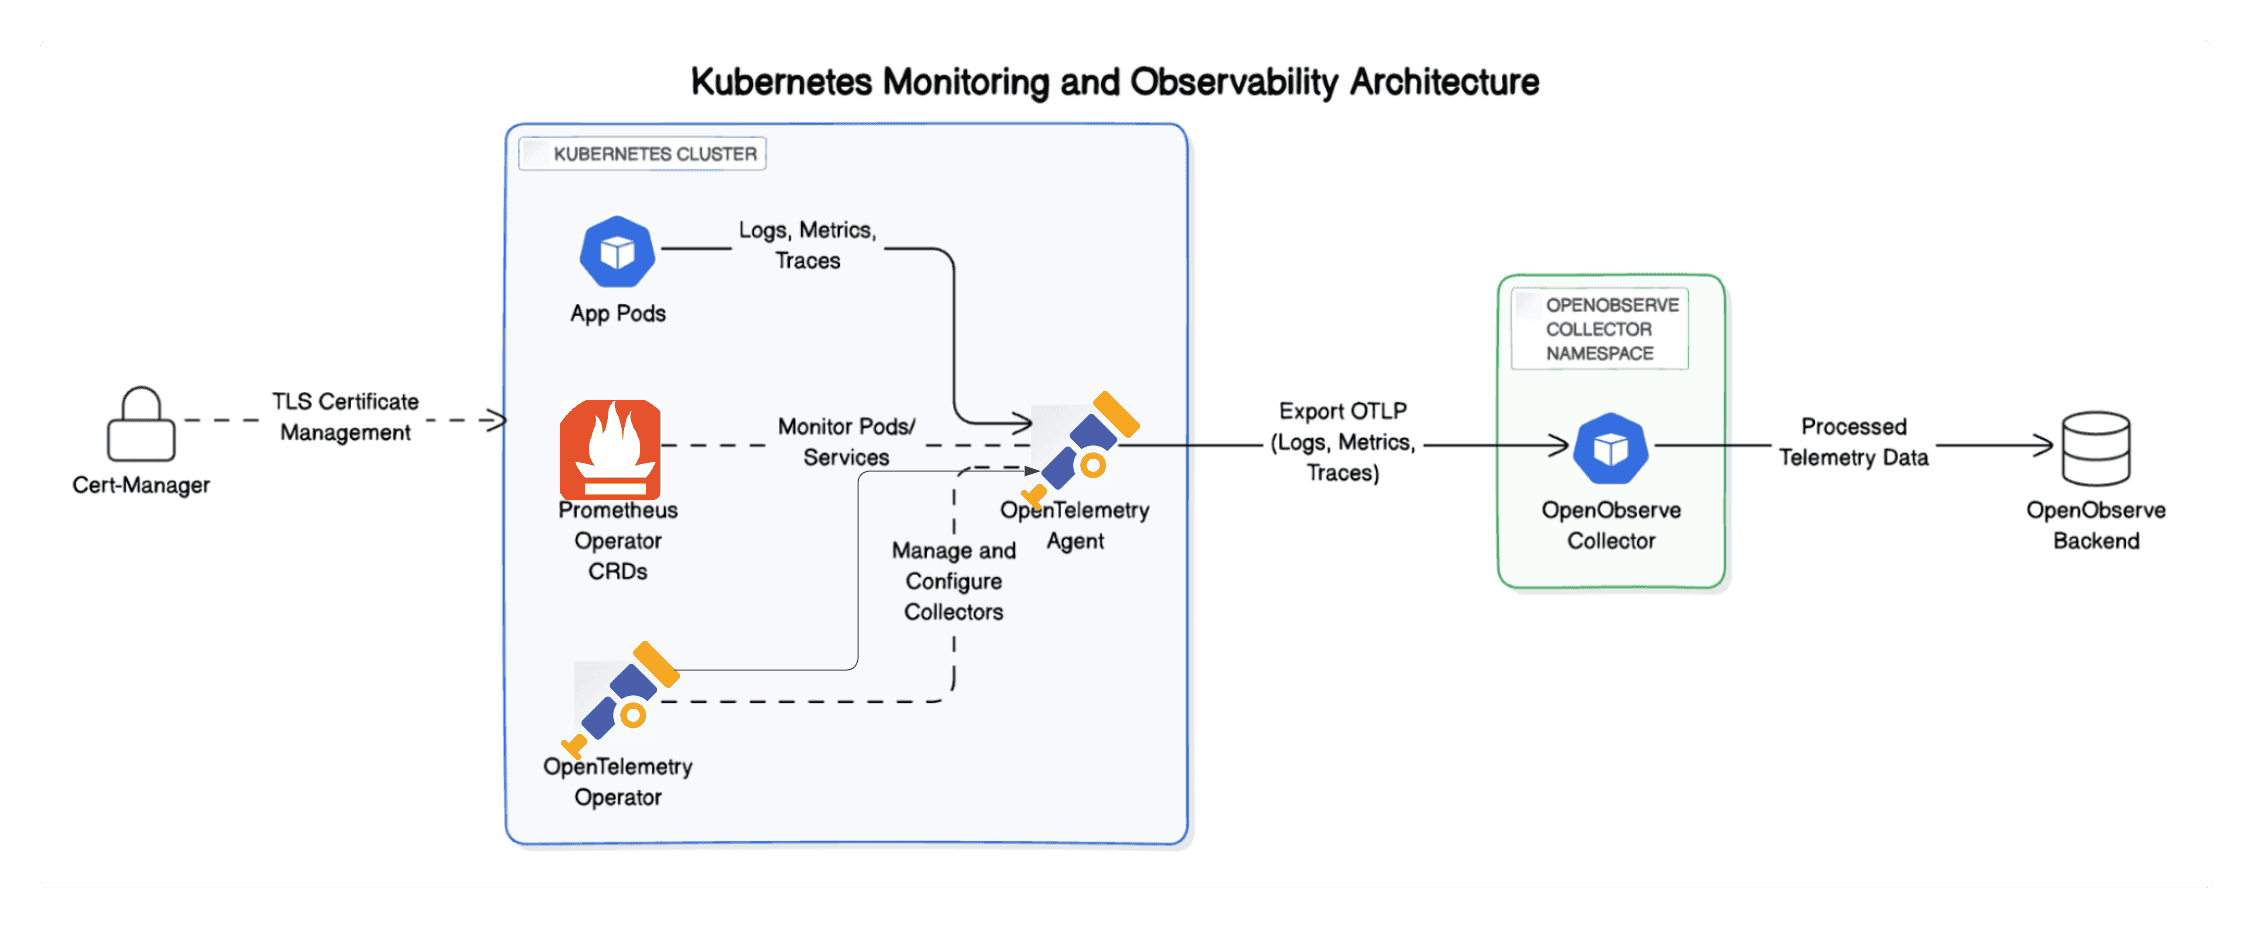
The Gateway component runs as a Deployment and acts as a centralized processing hub. All the data from your agents flows here for processing, enrichment, and export to your OpenObserve instance. This separation keeps the agents lightweight while allowing the gateway to handle heavier processing tasks without impacting your application nodes.
From the moment you deploy the collector, it starts gathering critical observability data. You get cluster-level metrics like CPU, memory, and disk utilization across nodes, pods, and containers. Kubernetes events flow automatically, giving you visibility into pod scheduling, failures, and other cluster activities. Container logs are aggregated without touching your application code. And if you enable it, auto-instrumentation captures distributed traces from your applications without requiring you to modify a single line of code.
The official Helm charts for deploying the collector are maintained in the OpenObserve Helm Chart repository, where you can also explore advanced configuration options if you need them.
Before we jump into the installation, make sure you have these essentials ready:
AKS Cluster: You need an active Azure Kubernetes Service cluster up and running. Any supported AKS version works.
Helm 3.x: Helm is the package manager we'll use to deploy the collector. Install it on your local machine if you haven't already.
kubectl Access: Your kubectl command-line tool should be configured to communicate with your AKS cluster. Test this with kubectl get nodes to verify connectivity.
OpenObserve Instance : Either self-hosted or using OpenObserve Cloud.
Now comes the demo part. We'll deploy the OpenObserve Collector in our AKS cluster step by step. Each command serves a specific purpose in building your monitoring infrastructure.
You can find the below steps in the Data sources section as well once you log in to OpenOsberve
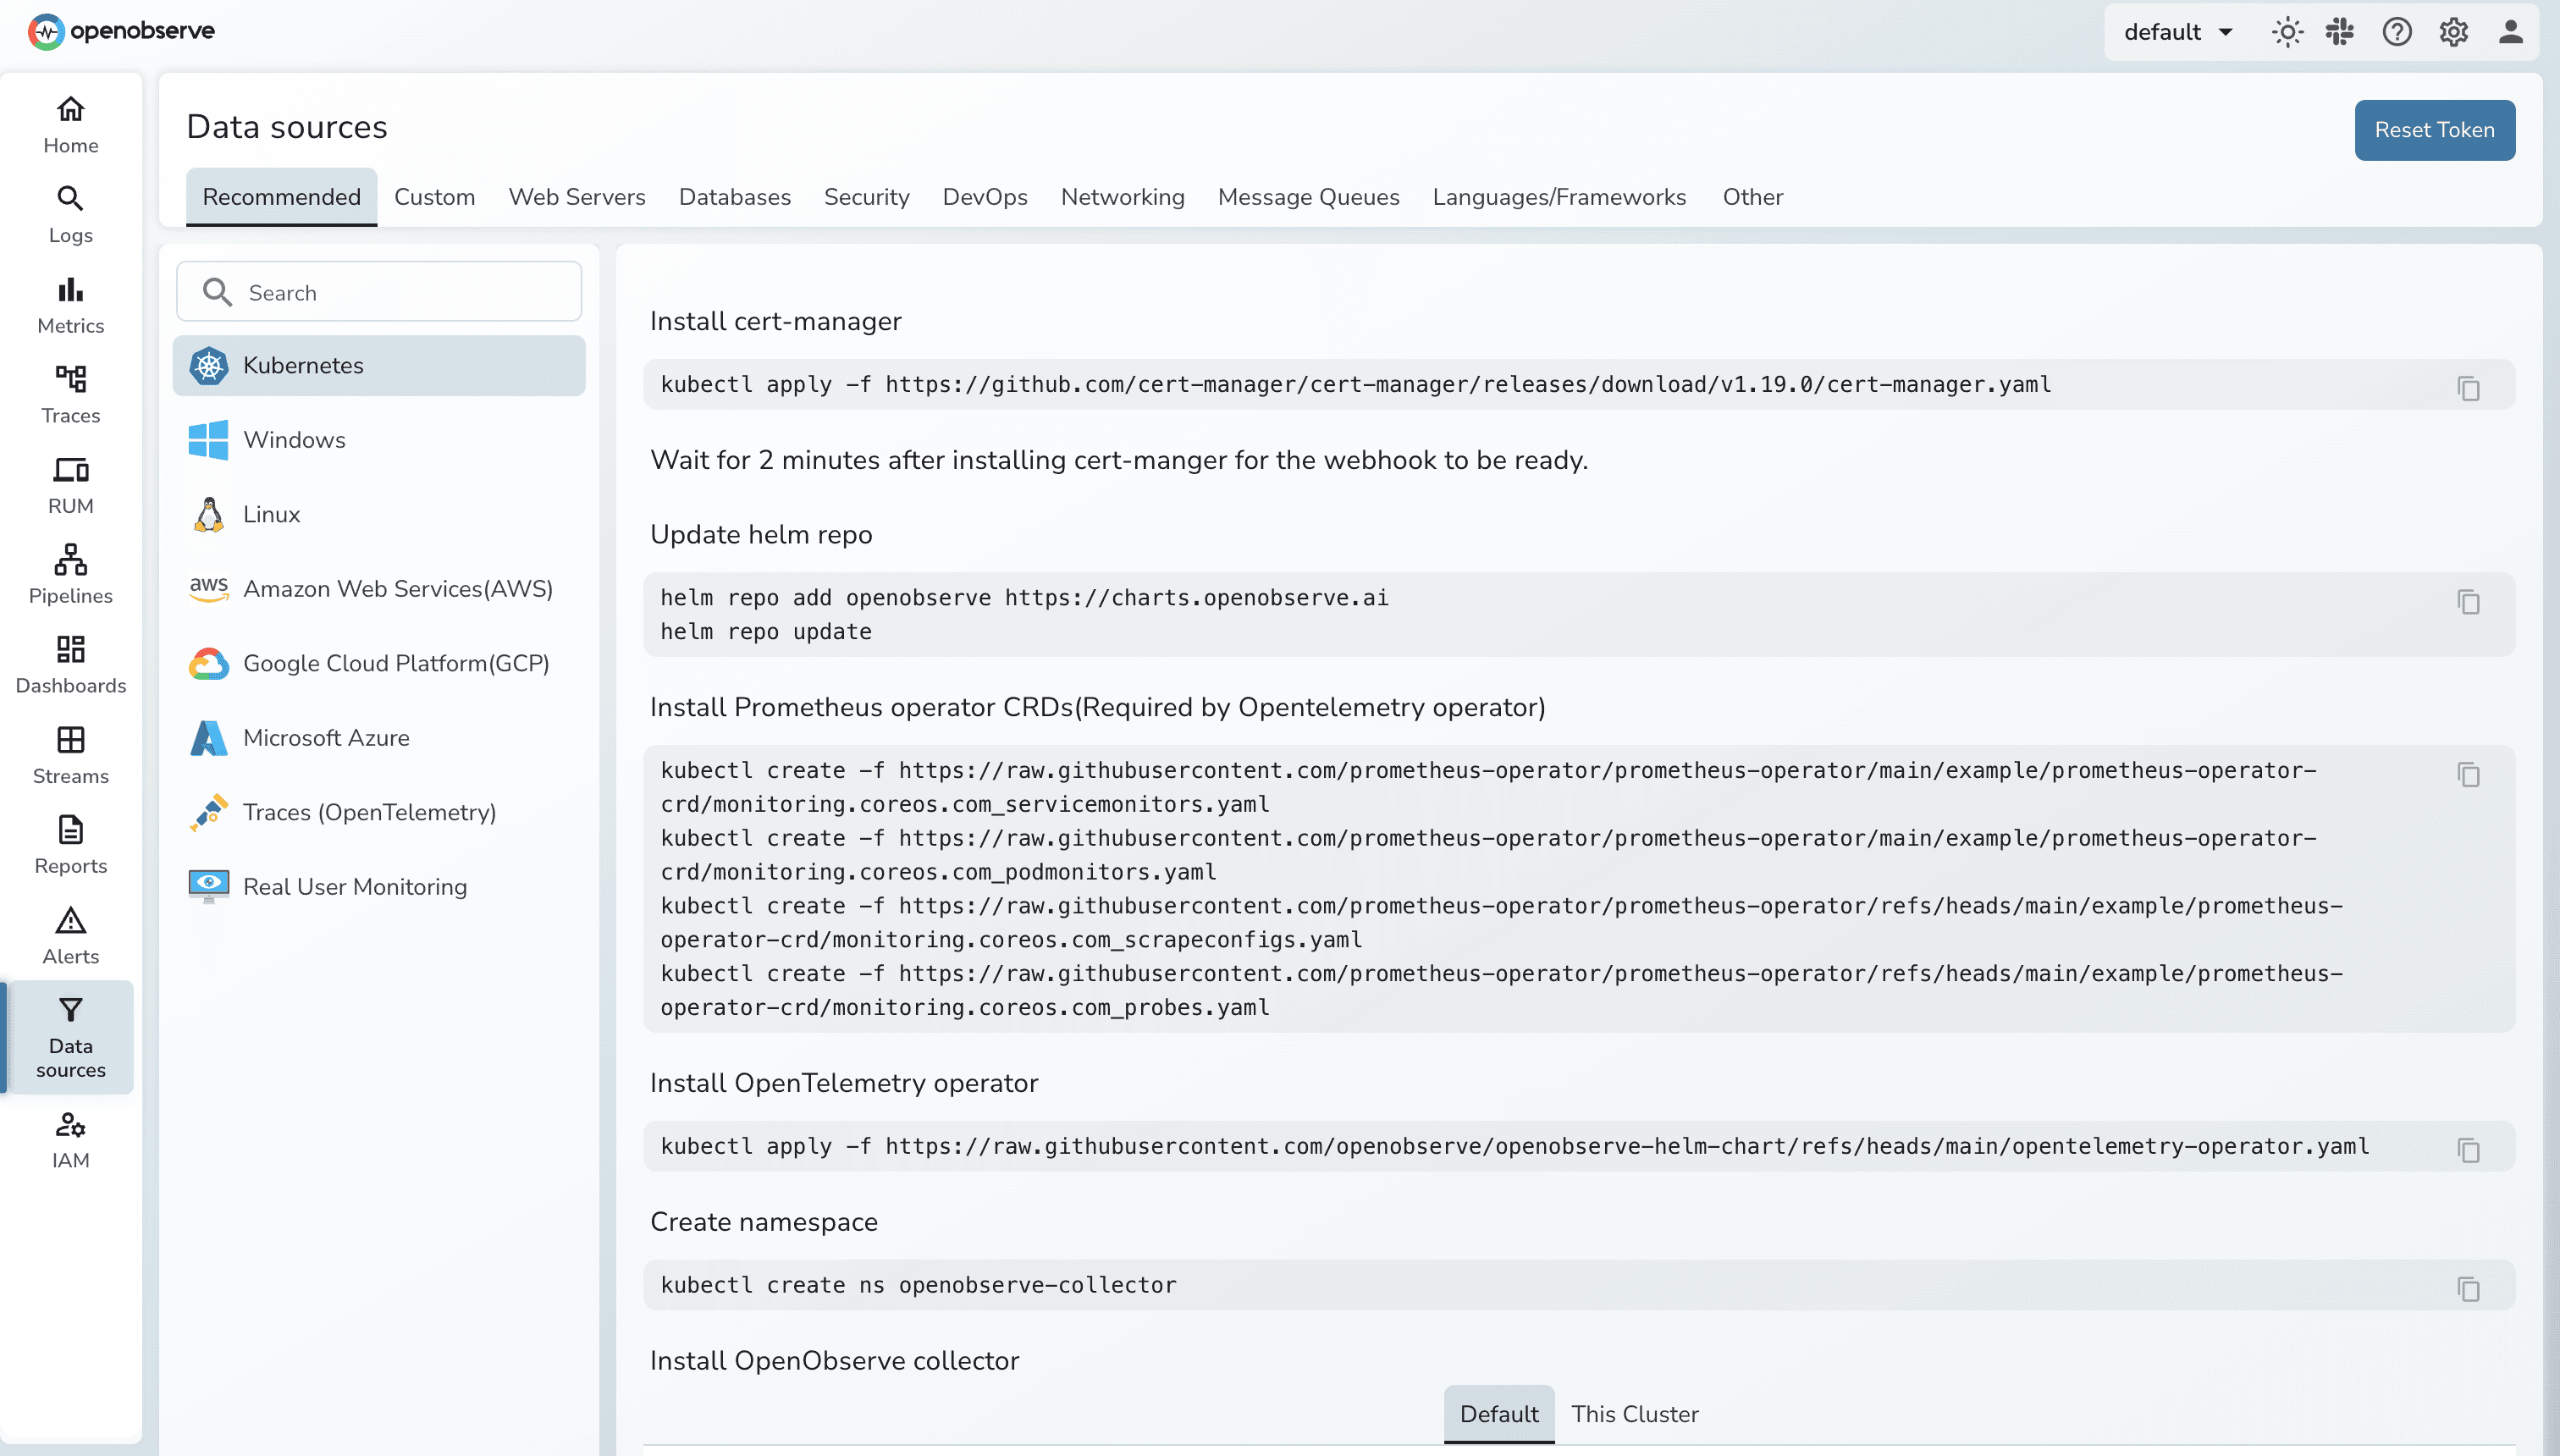
Cert-Manager automates the management of TLS certificates within Kubernetes. We need it to secure communication between the collector components and your cluster resources.
kubectl apply -f https://github.com/cert-manager/cert-manager/releases/download/v1.13.1/cert-manager.yaml
This installs Cert-Manager in your cluster. It will handle certificate creation and rotation automatically, ensuring secure connections between services without manual intervention.
Helm repositories host charts (packages) for Kubernetes applications. Adding the OpenObserve repository gives you access to the collector chart.
helm repo add openobserve https://charts.openobserve.ai
This command registers the OpenObserve Helm repository with your local Helm installation. Think of it as adding a new app store to your package manager.
The Prometheus Operator introduces CustomResourceDefinitions (CRDs) like ServiceMonitors and PodMonitors. These are Kubernetes-native ways to define which services and pods should be scraped for metrics.
kubectl apply -f https://raw.githubusercontent.com/prometheus-operator/prometheus-operator/main/example/prometheus-operator-crd/monitoring.coreos.com_servicemonitors.yaml

kubectl apply -f https://raw.githubusercontent.com/prometheus-operator/prometheus-operator/main/example/prometheus-operator-crd/monitoring.coreos.com_podmonitors.yaml
These CRDs enable the collector to discover and scrape metrics from your pods and services automatically. No manual configuration needed for each new service you deploy.
The OpenTelemetry Operator manages OpenTelemetry Collector instances in Kubernetes. It's essential for the auto-instrumentation features we'll discuss later.
kubectl apply -f https://github.com/open-telemetry/opentelemetry-operator/releases/latest/download/opentelemetry-operator.yaml
This operator will be responsible for injecting auto-instrumentation into your application pods when you enable it, capturing traces without code changes.
Isolating the collector in its own namespace helps with organization and makes it easier to manage permissions and resource quotas.
kubectl create ns openobserve-collector
This creates a dedicated namespace called openobserve-collector where all the collector components will live.
This is the main deployment step. You'll install the collector using Helm with configuration pointing to your OpenObserve instance.
Important: Copy the command below from the Data Sources section of your OpenObserve console once you log in. That version will have your authentication token pre-filled.
helm --namespace openobserve-collector \
  install o2c openobserve/openobserve-collector \
  --set exporters."otlphttp/openobserve".endpoint=http://localhost:5080/api/default  \
  --set exporters."otlphttp/openobserve".headers.Authorization="Basic <auth_token>"  \
  --set exporters."otlphttp/openobserve_k8s_events".endpoint=http://localhost:5080/api/default  \
  --set exporters."otlphttp/openobserve_k8s_events".headers.Authorization="Basic <auth_token>"
This command configures the collector to send telemetry data to your OpenObserve endpoint using the OTLP HTTP protocol. The authorization token ensures secure communication. Make sure this token is the base64-encoded credentials provided by OpenObserve.
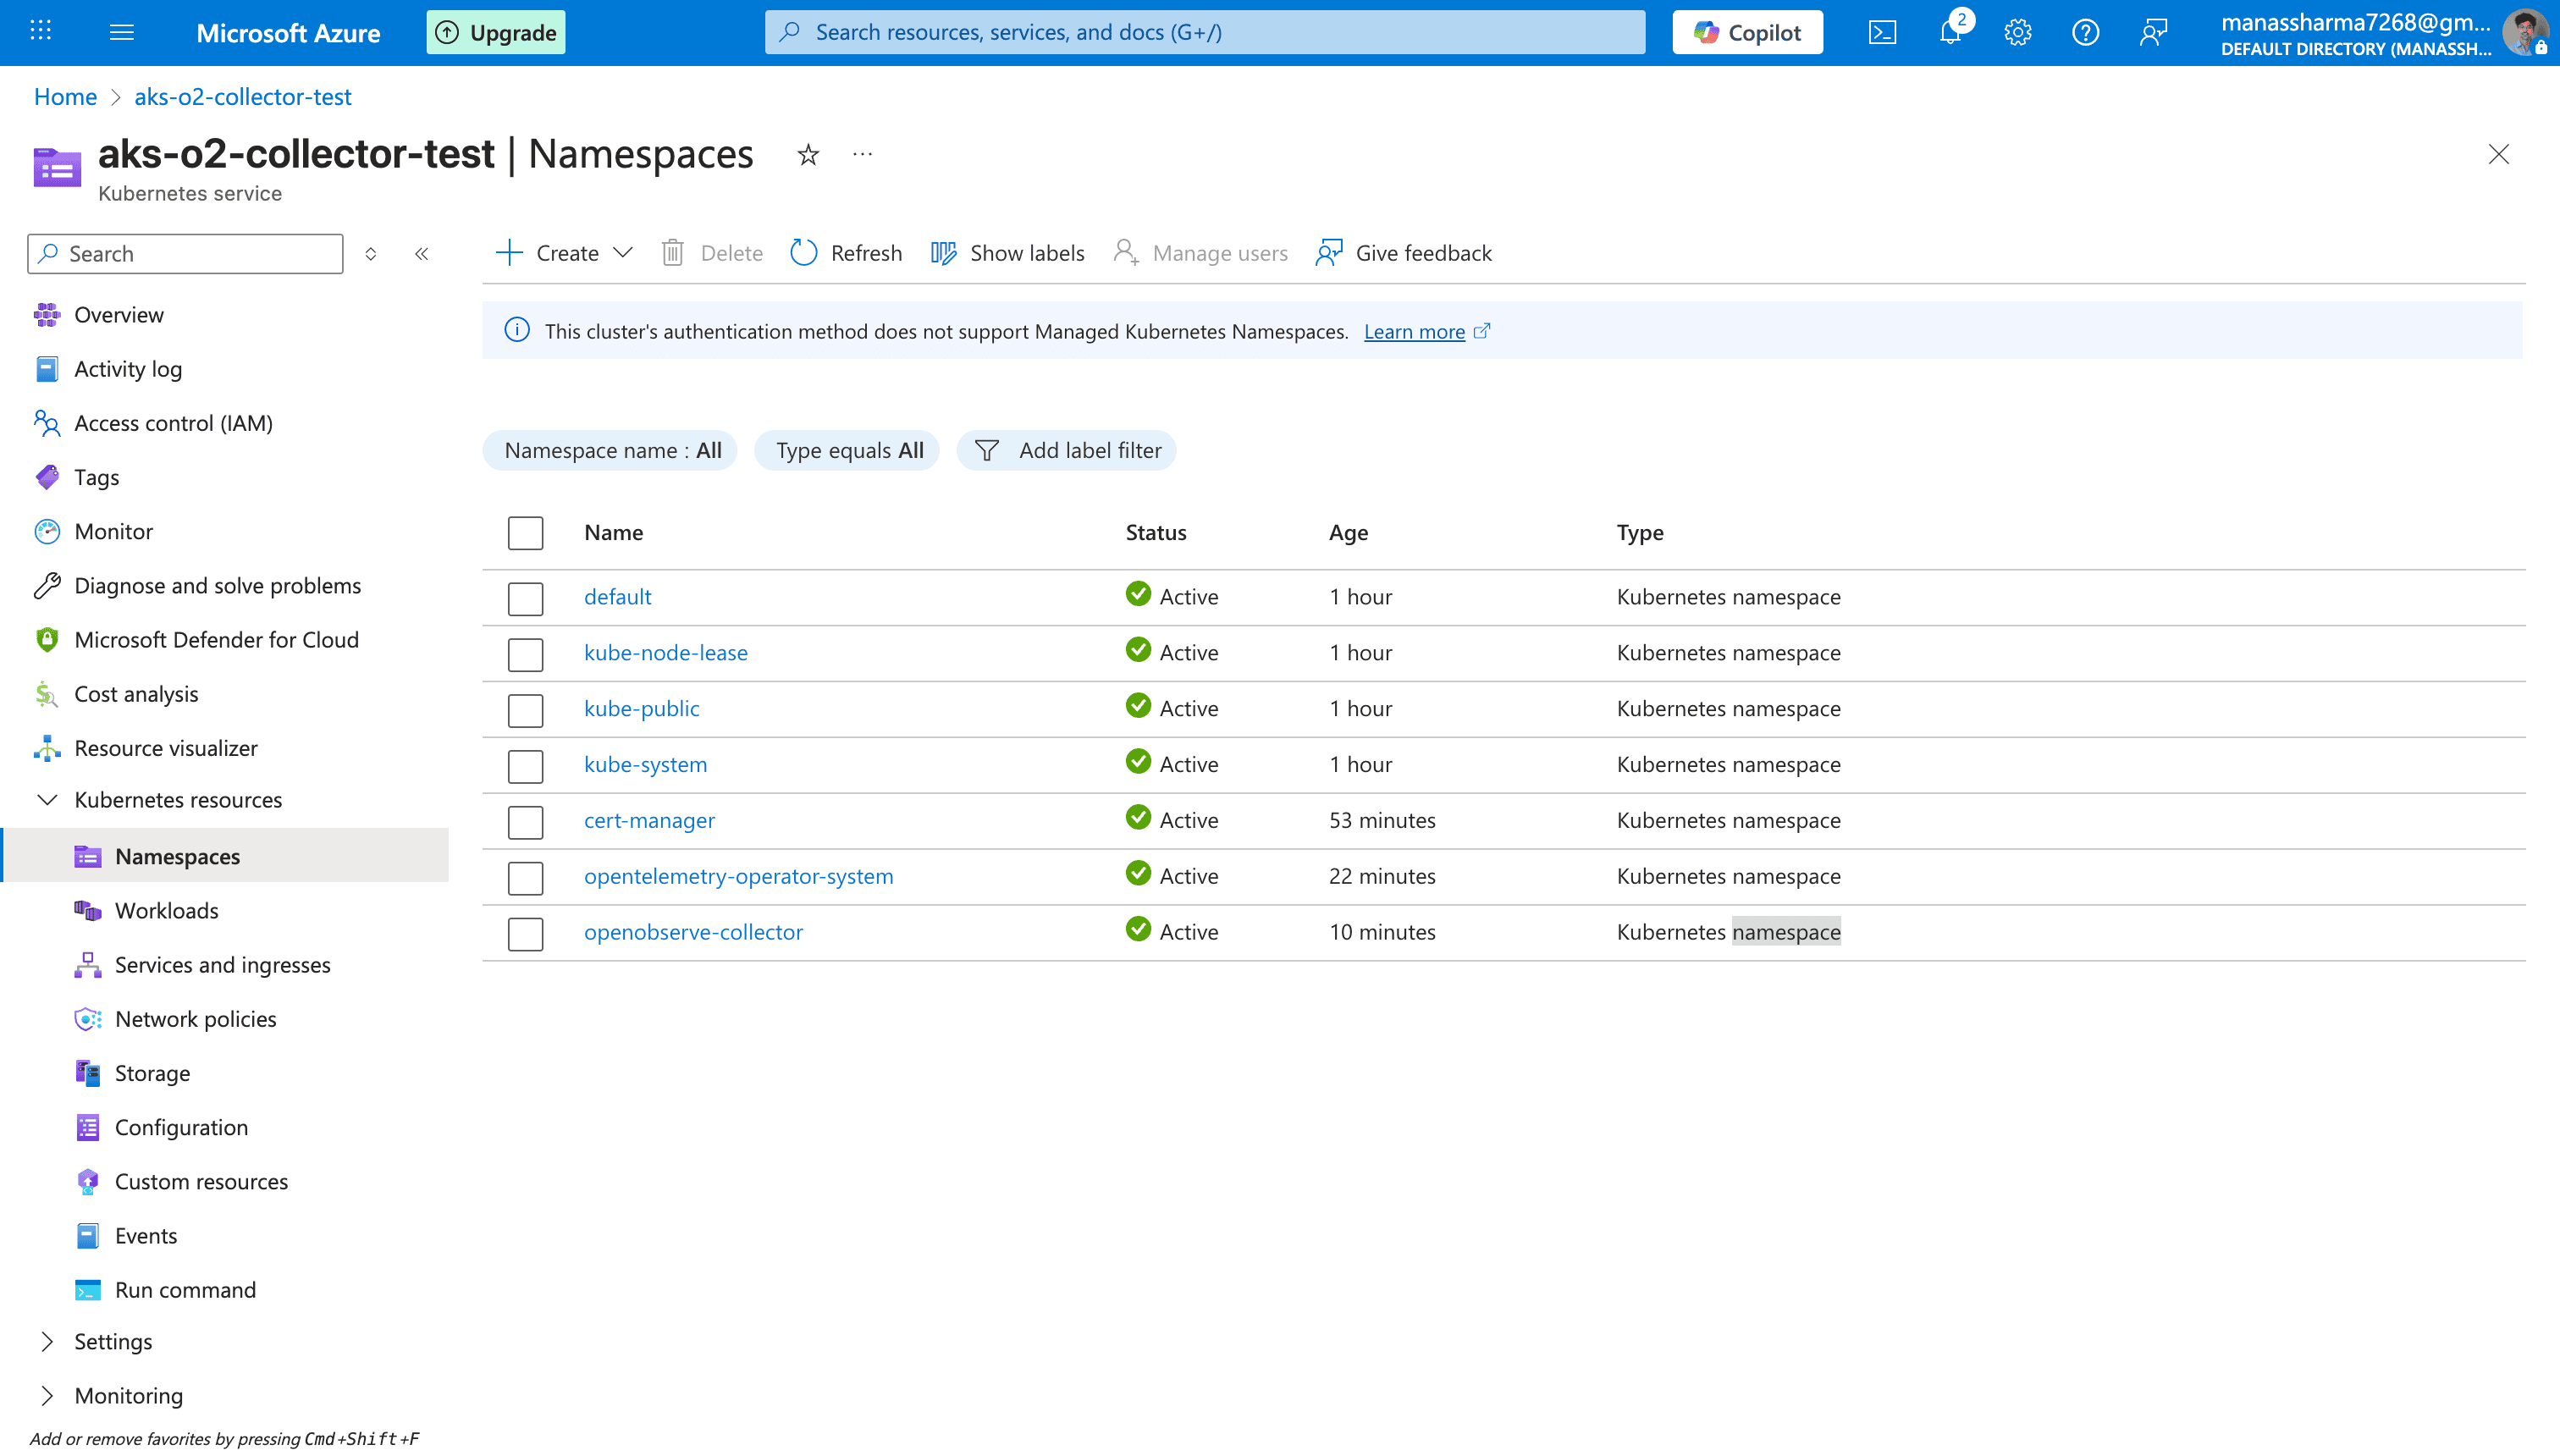
After installation completes, check for a message as below:
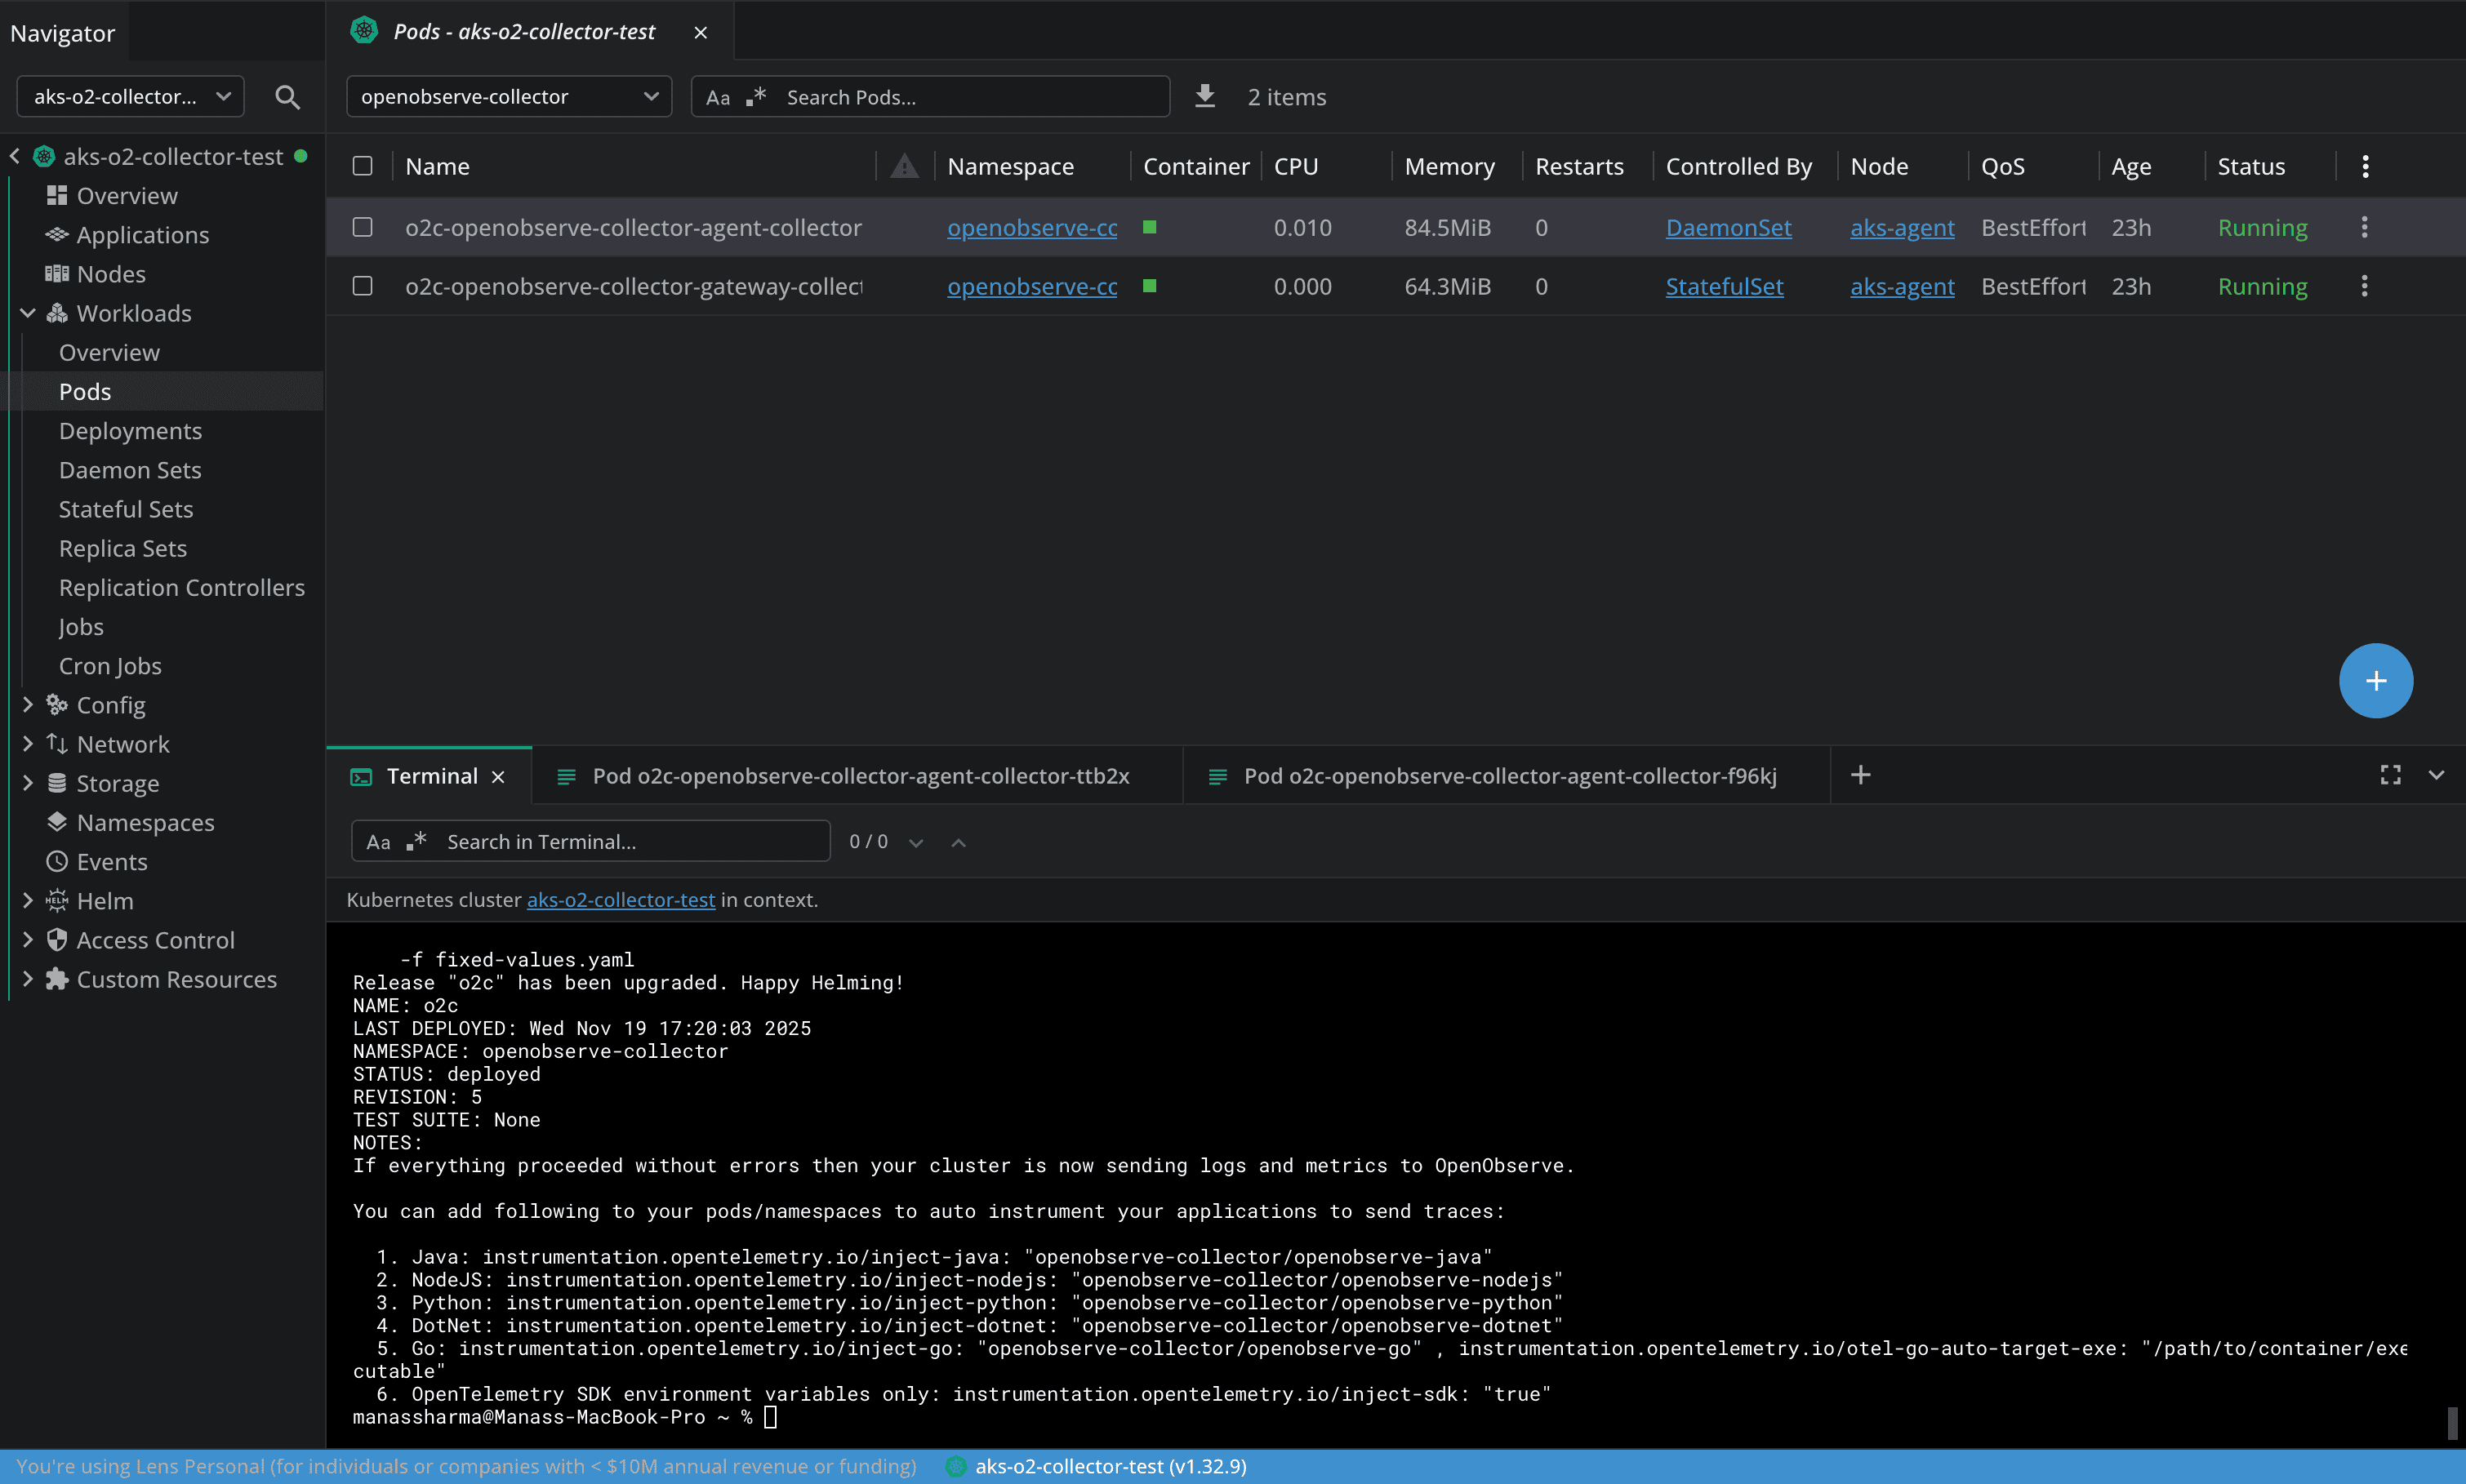
kubectl get pods -n openobserve-collector
You should see collector pods in the Running state. Look for both the agent pods (one per node) and the gateway pod. If you see pods in CrashLoopBackOff or Error states, inspect the logs:
kubectl logs -f <pod-name> -n openobserve-collector
Common issues to watch for include authentication errors (check your token), network connectivity problems (ensure your cluster can reach your OpenObserve endpoint), or resource constraints (the collector needs sufficient CPU and memory).
If pods aren't starting, first check the pod events with kubectl describe pod <pod-name> -n openobserve-collector. Look for image pull errors or scheduling issues. If authentication fails, verify your token is correctly base64-encoded and hasn't expired. For network issues, test connectivity from within the cluster using a debug pod with curl or wget.
Now that your collector is running, let's talk about what you can actually see. The OpenObserve Collector gives you comprehensive visibility into your AKS cluster across multiple dimensions. Here's what you'll be monitoring:
| Monitoring Aspect | Description |
|---|---|
| Resource Utilization | The collector tracks CPU, memory, and disk usage across nodes, pods, and containers. This means you can easily spot resource bottlenecks and ensure efficient resource allocation. No more guessing where your cluster resources are going. Get real-time insights to optimize performance and prevent overloads before they impact your applications. |
| Storage Insights | Storage health is critical in Kubernetes environments. The collector monitors the status and capacity of your persistent volumes (PVs) and their claims (PVCs). It keeps tabs on read and write operations, ensuring your applications have the storage they need without any surprises. You'll know when volumes are approaching capacity or experiencing performance issues. |
| Network Performance | Understanding network traffic is essential for troubleshooting and optimization. The collector monitors bandwidth usage, including data received and transmitted across your pods and nodes. This visibility helps you identify network bottlenecks, unusual traffic patterns, or connectivity issues affecting your applications. |
| Logging and Event Monitoring | Logs and events are your first line of defense when troubleshooting. The collector captures container logs automatically, along with Kubernetes events like pod scheduling, failures, restarts, and configuration changes. This gives you a clear timeline of what's happening in your cluster, making it much easier to diagnose problems and understand application behavior. |
With the OpenObserve Collector running, you have all the insights needed to manage your Kubernetes environment effectively. The data flows continuously to your OpenObserve instance, ready for querying and visualization.
Collecting data is one thing, but making sense of it is where the real value lies. OpenObserve provides pre-built Kubernetes monitoring dashboards that you can import directly from the community repository. These dashboards are production-ready and designed to give you immediate insights without spending hours building visualizations.
The only prerequisite? The OpenObserve Collector needs to be deployed and sending data to your OpenObserve instance (whether self-hosted or cloud). Once that's in place, you can import these dashboards and start monitoring right away.
Now, let's talk about dashboards! Each pre-built dashboard offers a unified view of your Kubernetes metrics, making it super easy to monitor your cluster's health.
Here are a few dashboards you can check out:
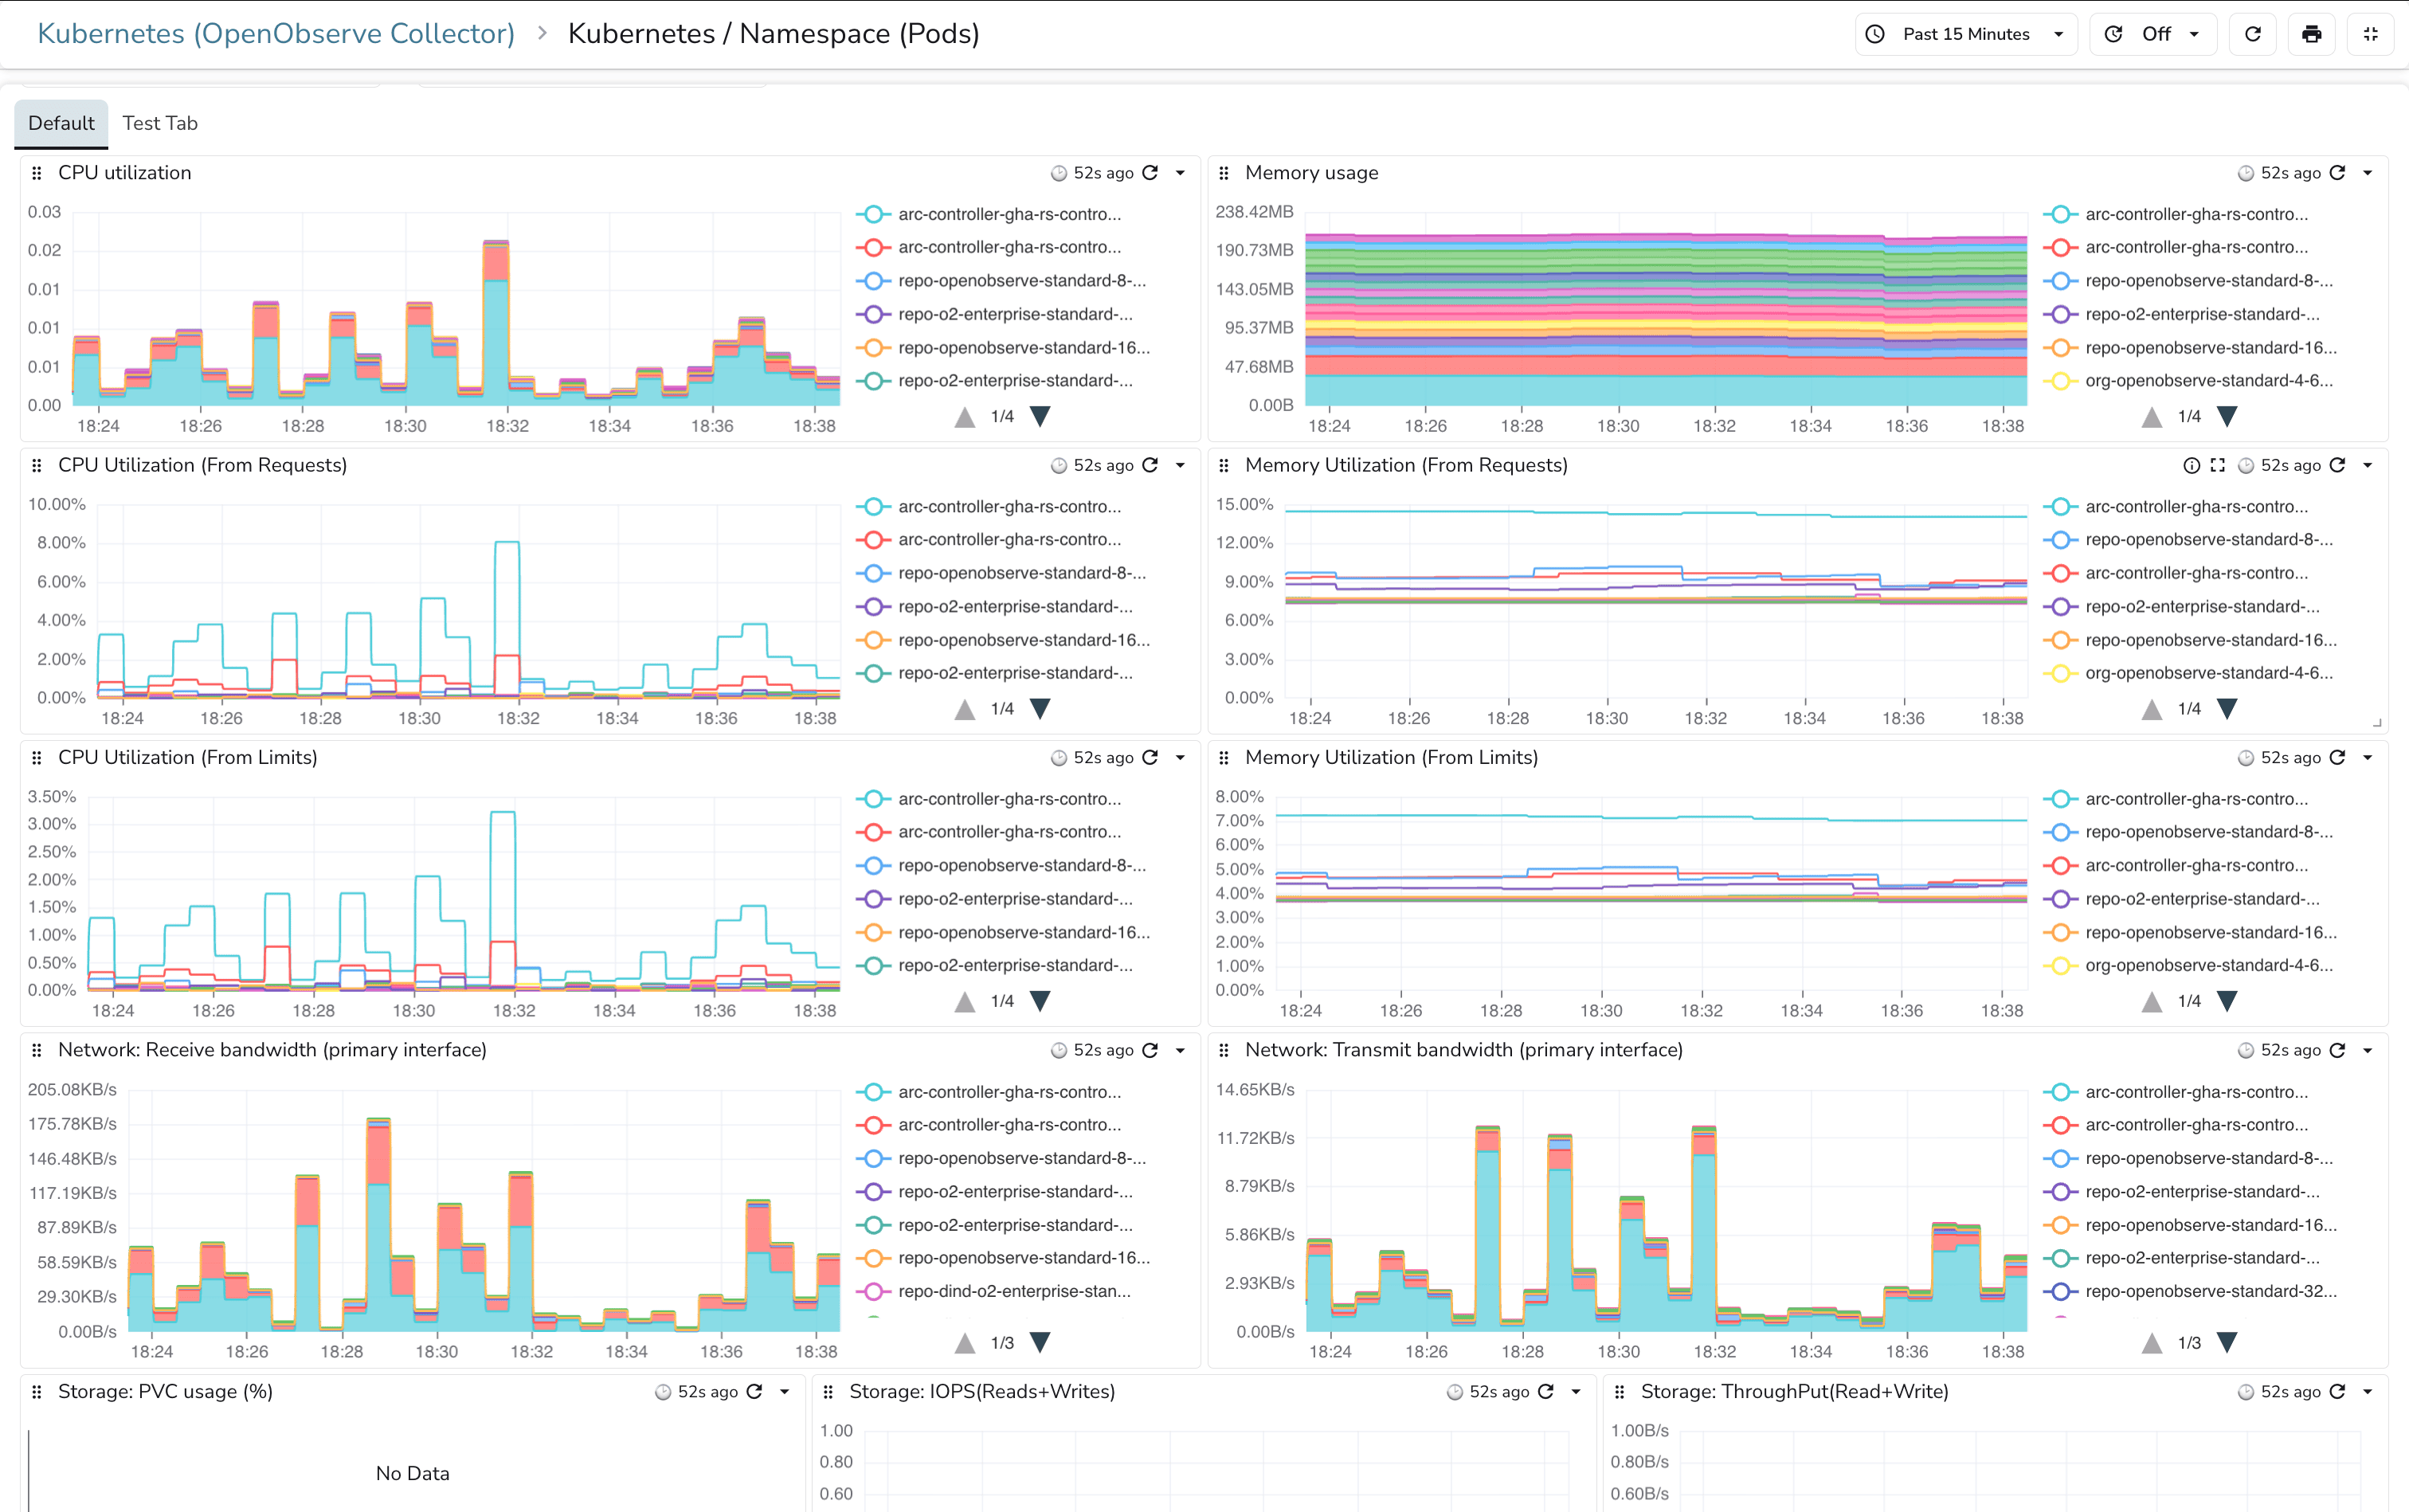
Kubernetes Namespace (Pods) Dashboard: Monitor the resource consumption of pods within specific namespaces. This dashboard helps you understand which pods are consuming the most resources in each namespace, making capacity planning and troubleshooting much easier.
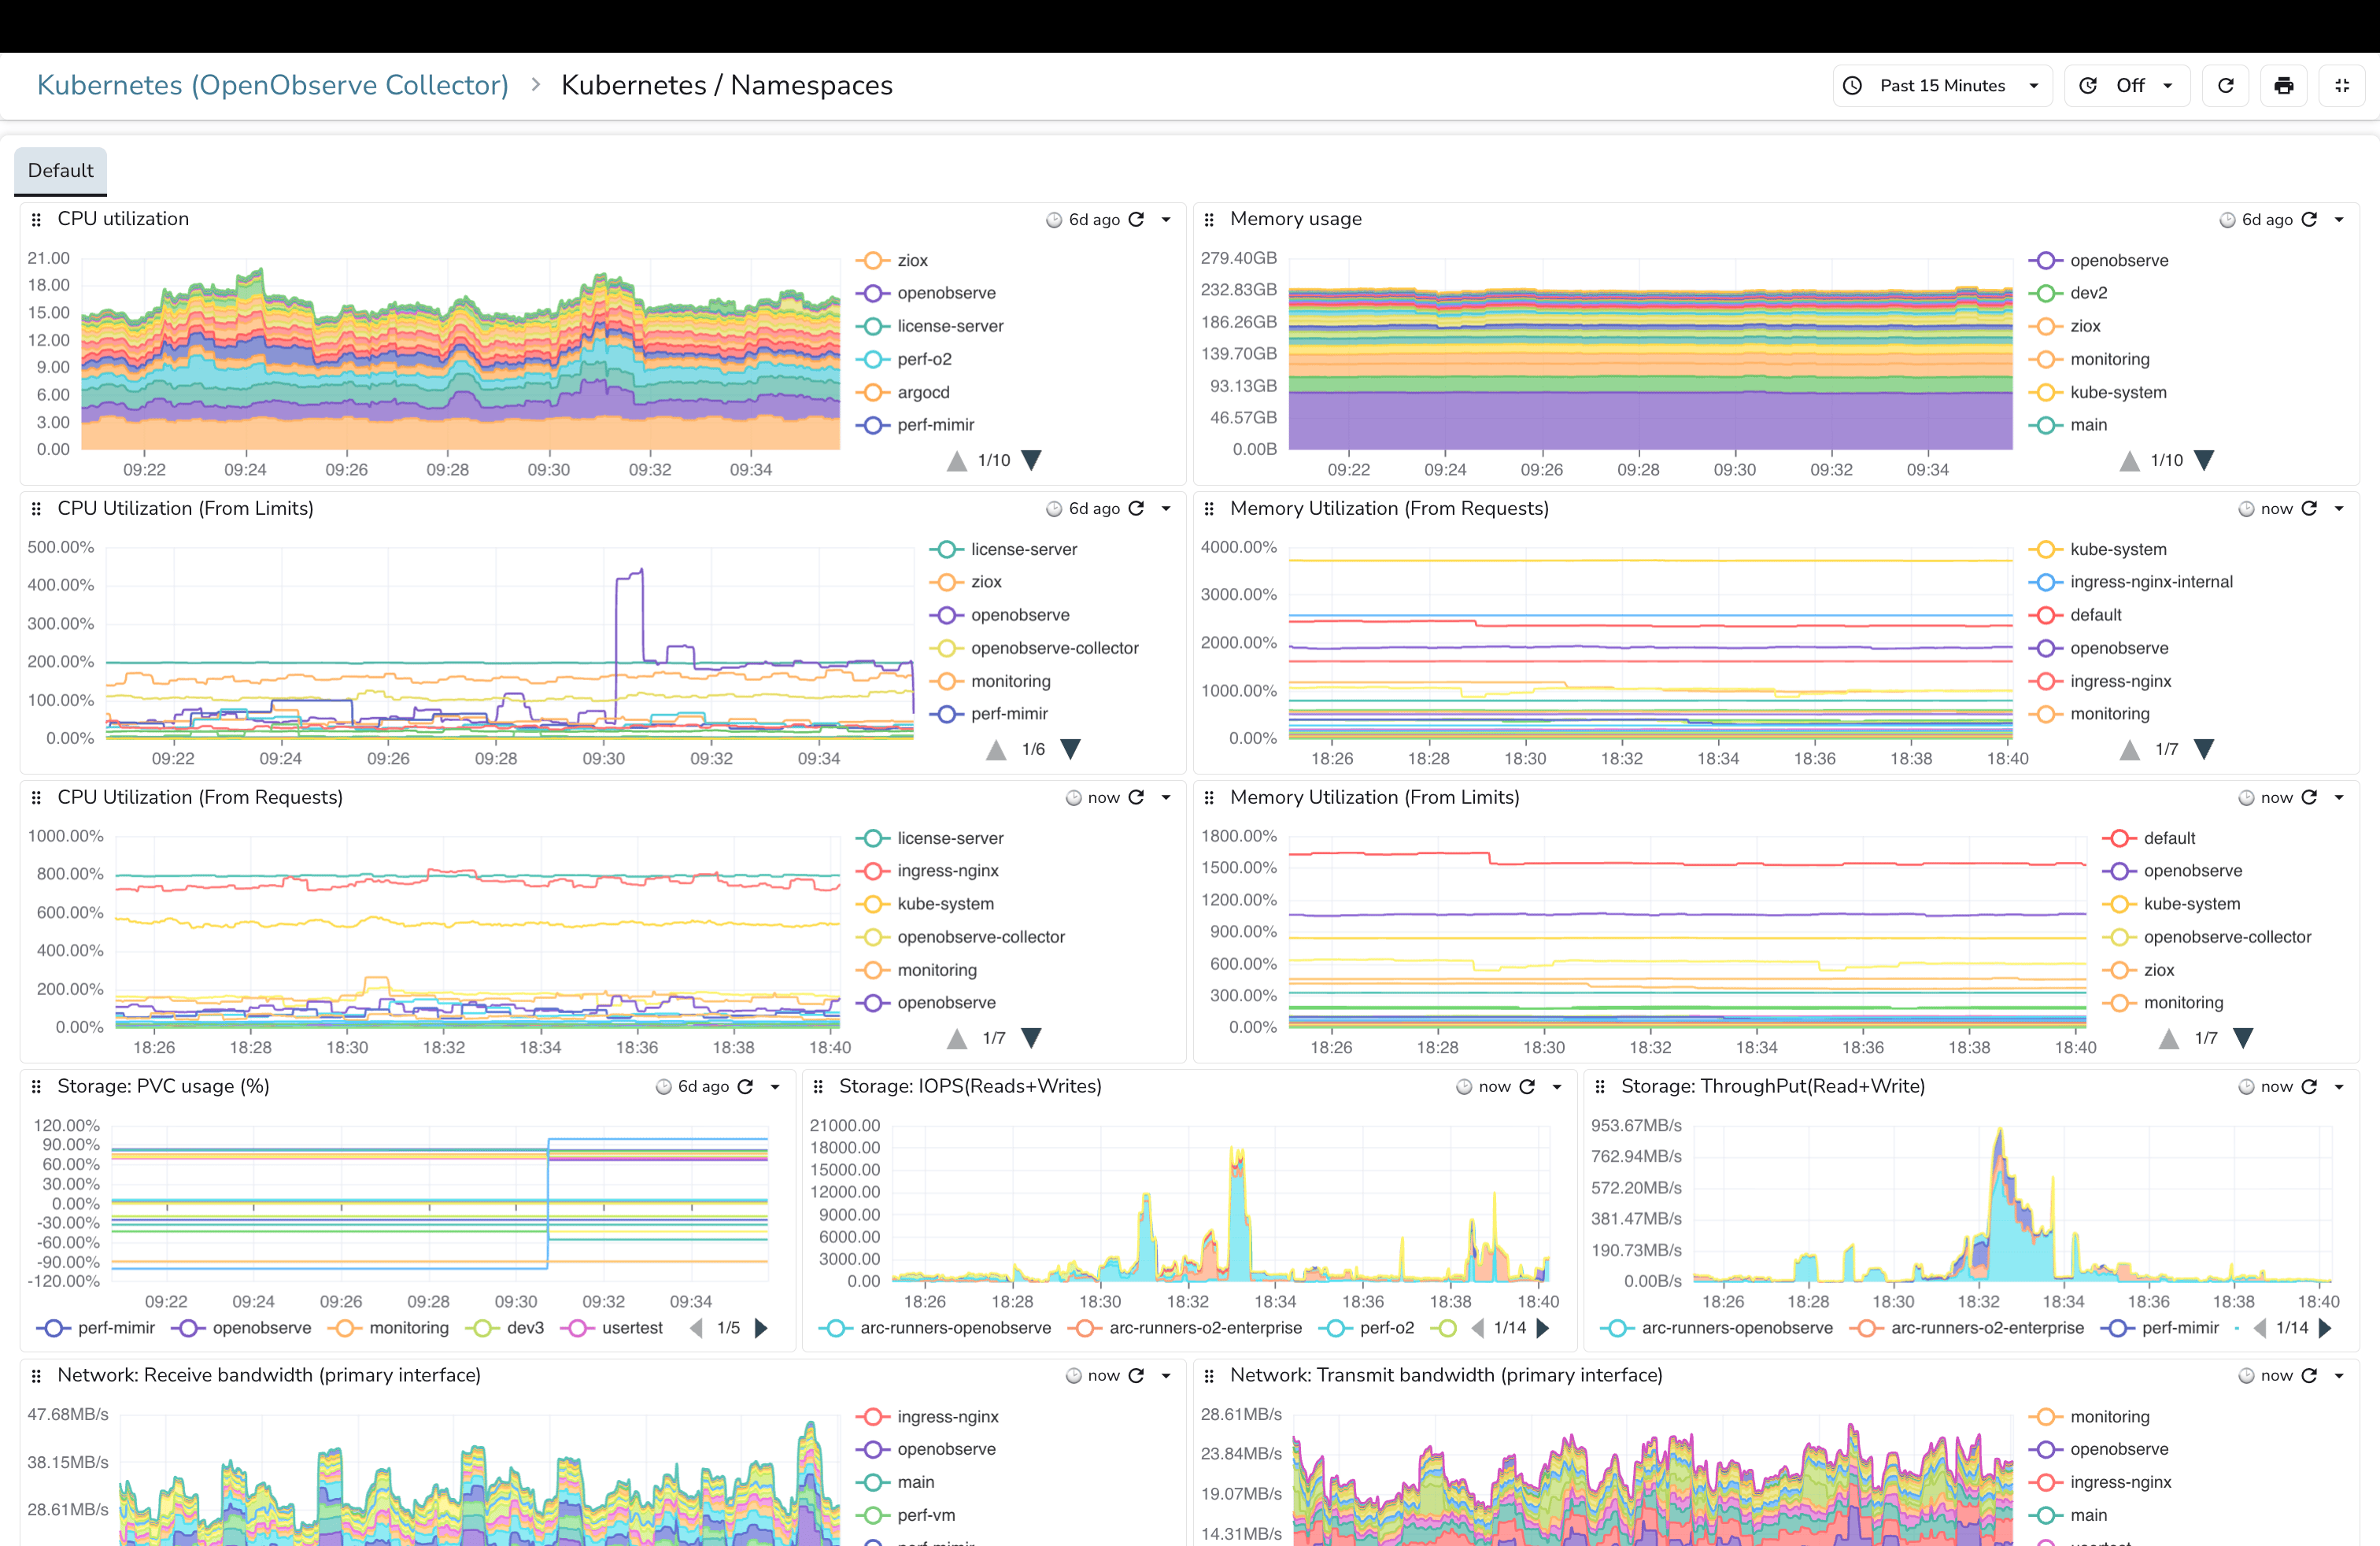
Kubernetes Namespaces Dashboard: Get a bird's eye view of resource allocation and usage across different namespaces. Perfect for multi-tenant clusters where you need to track resource distribution and identify namespaces that might need attention.
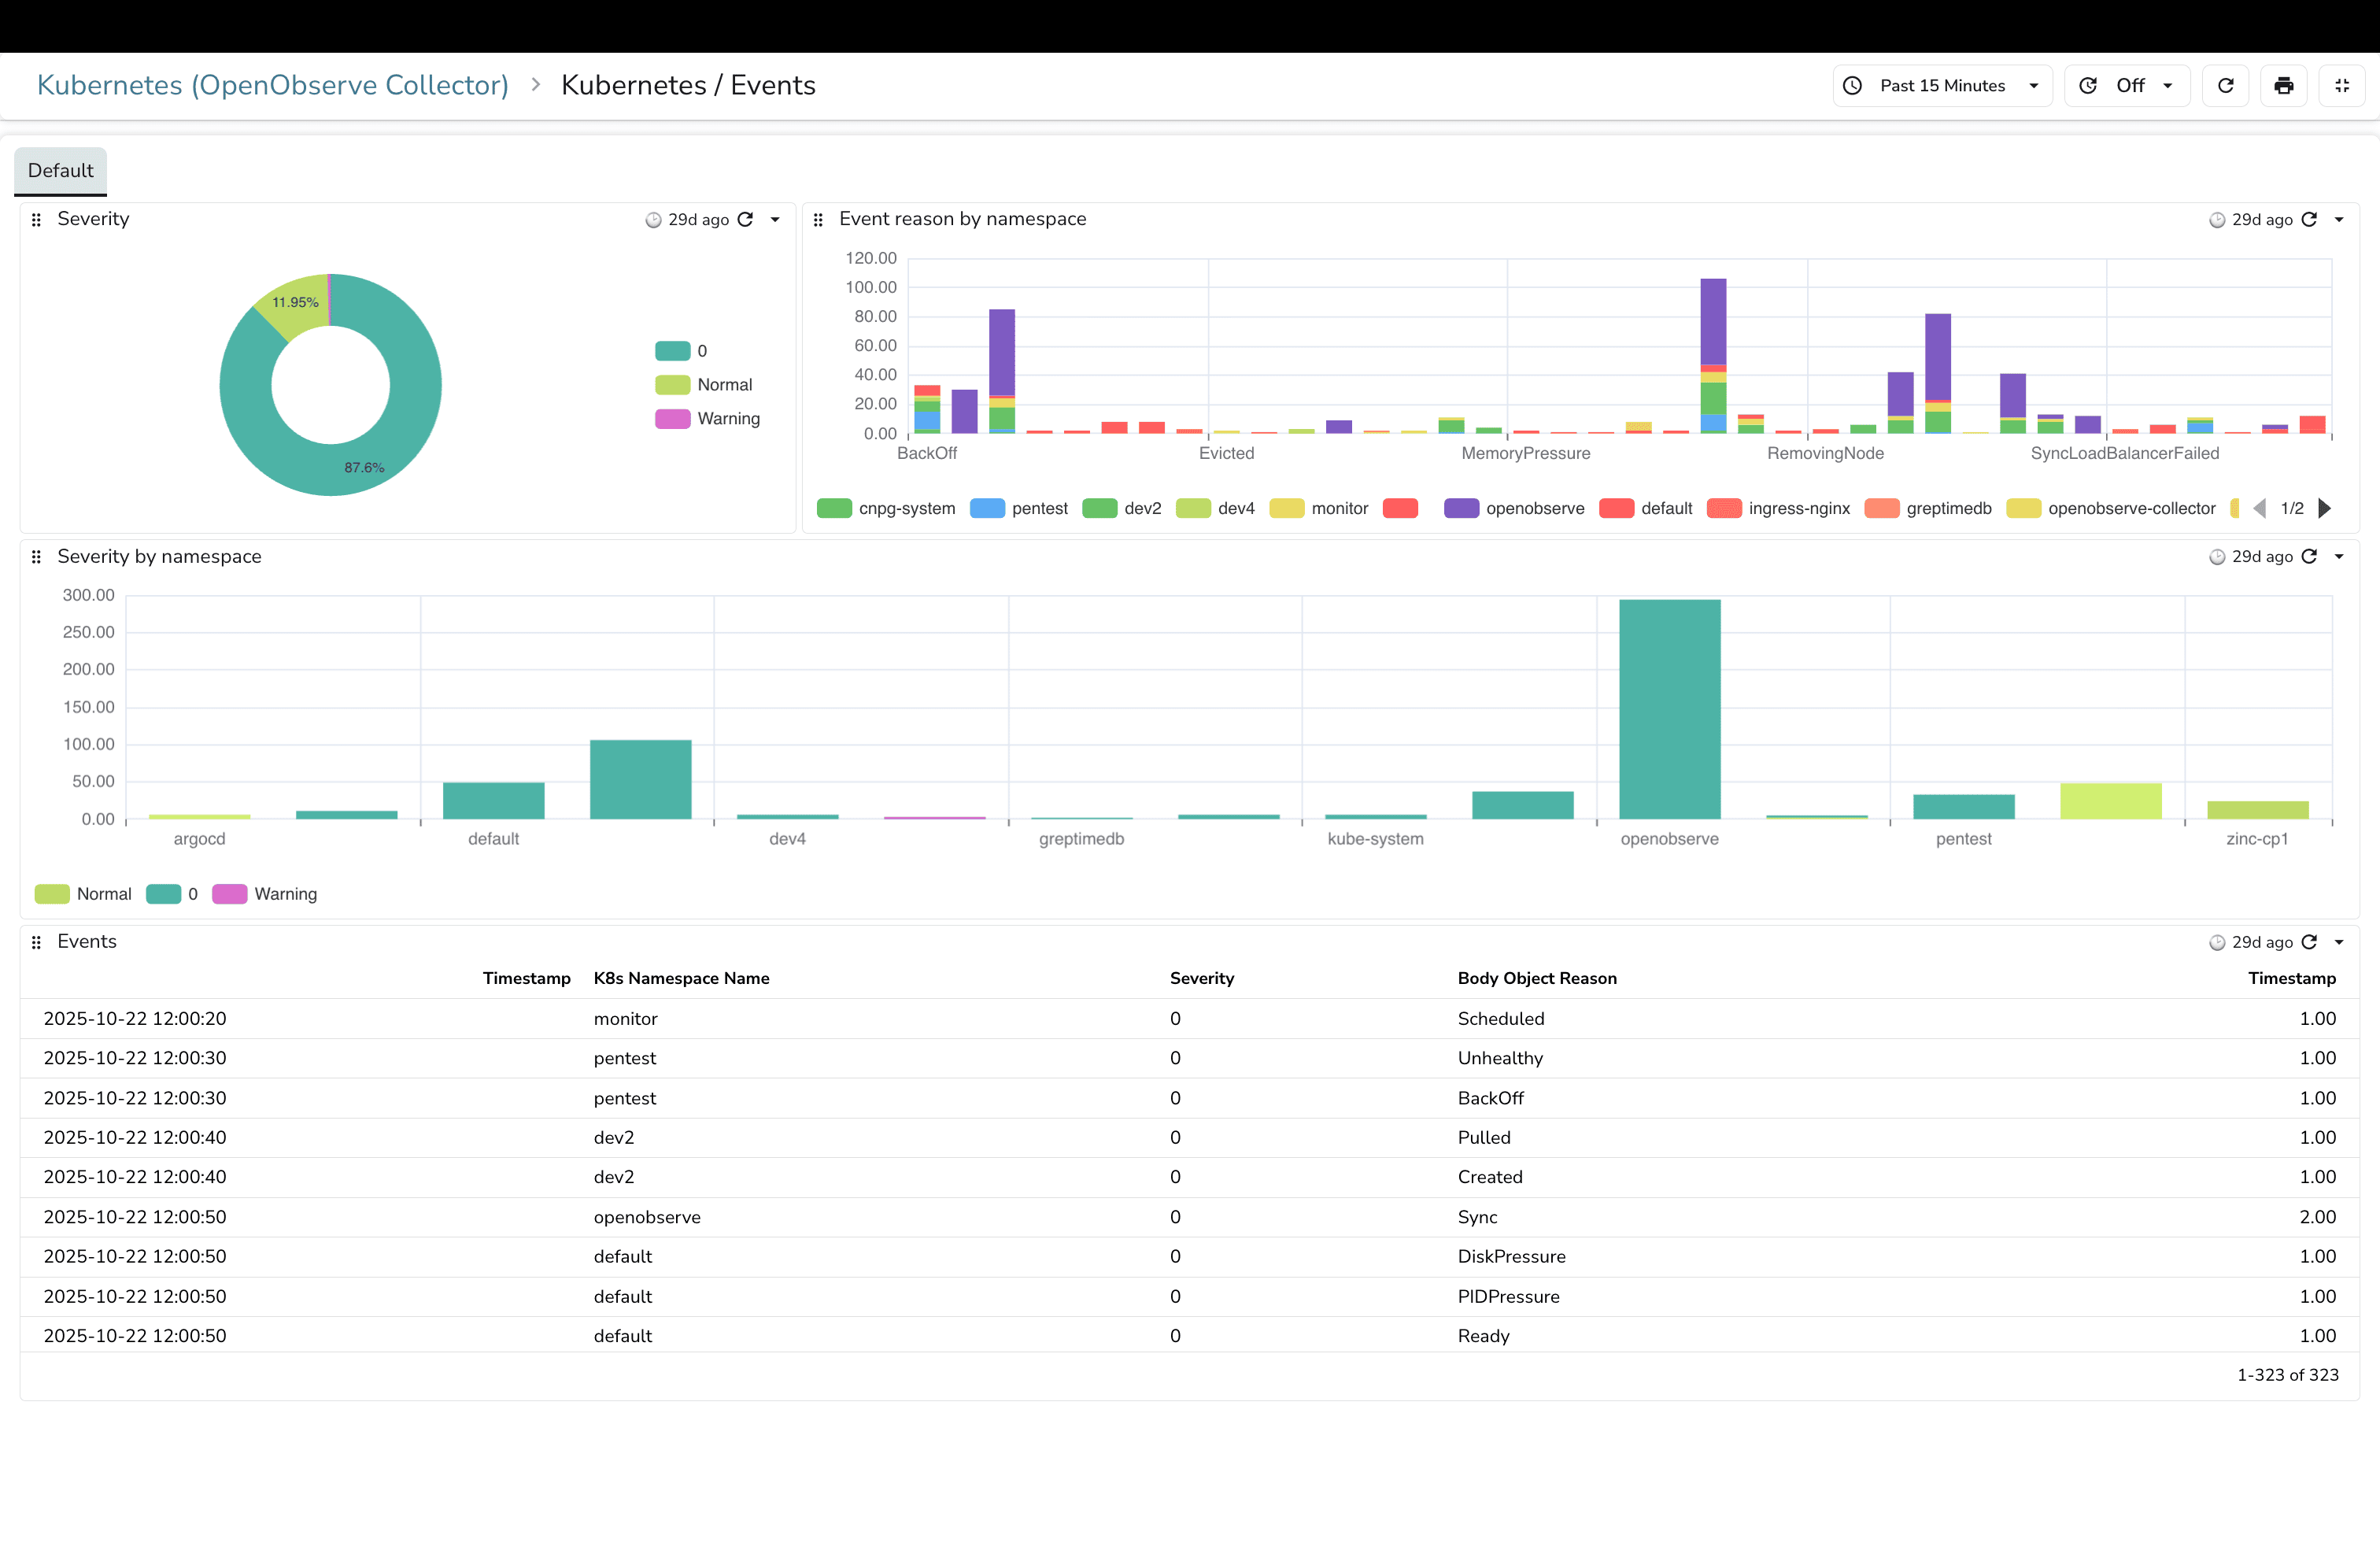
Kubernetes Events Dashboard: Display events occurring within your Kubernetes cluster along with their severity levels. This dashboard acts as your cluster's activity log, showing you pod failures, scheduling issues, configuration changes, and other critical events in real time.
Kubernetes Node (Pods) Dashboard: Monitor the performance and resource usage of pods running on each node. This view helps you identify nodes under stress, understand pod distribution, and make informed decisions about scaling or node maintenance.
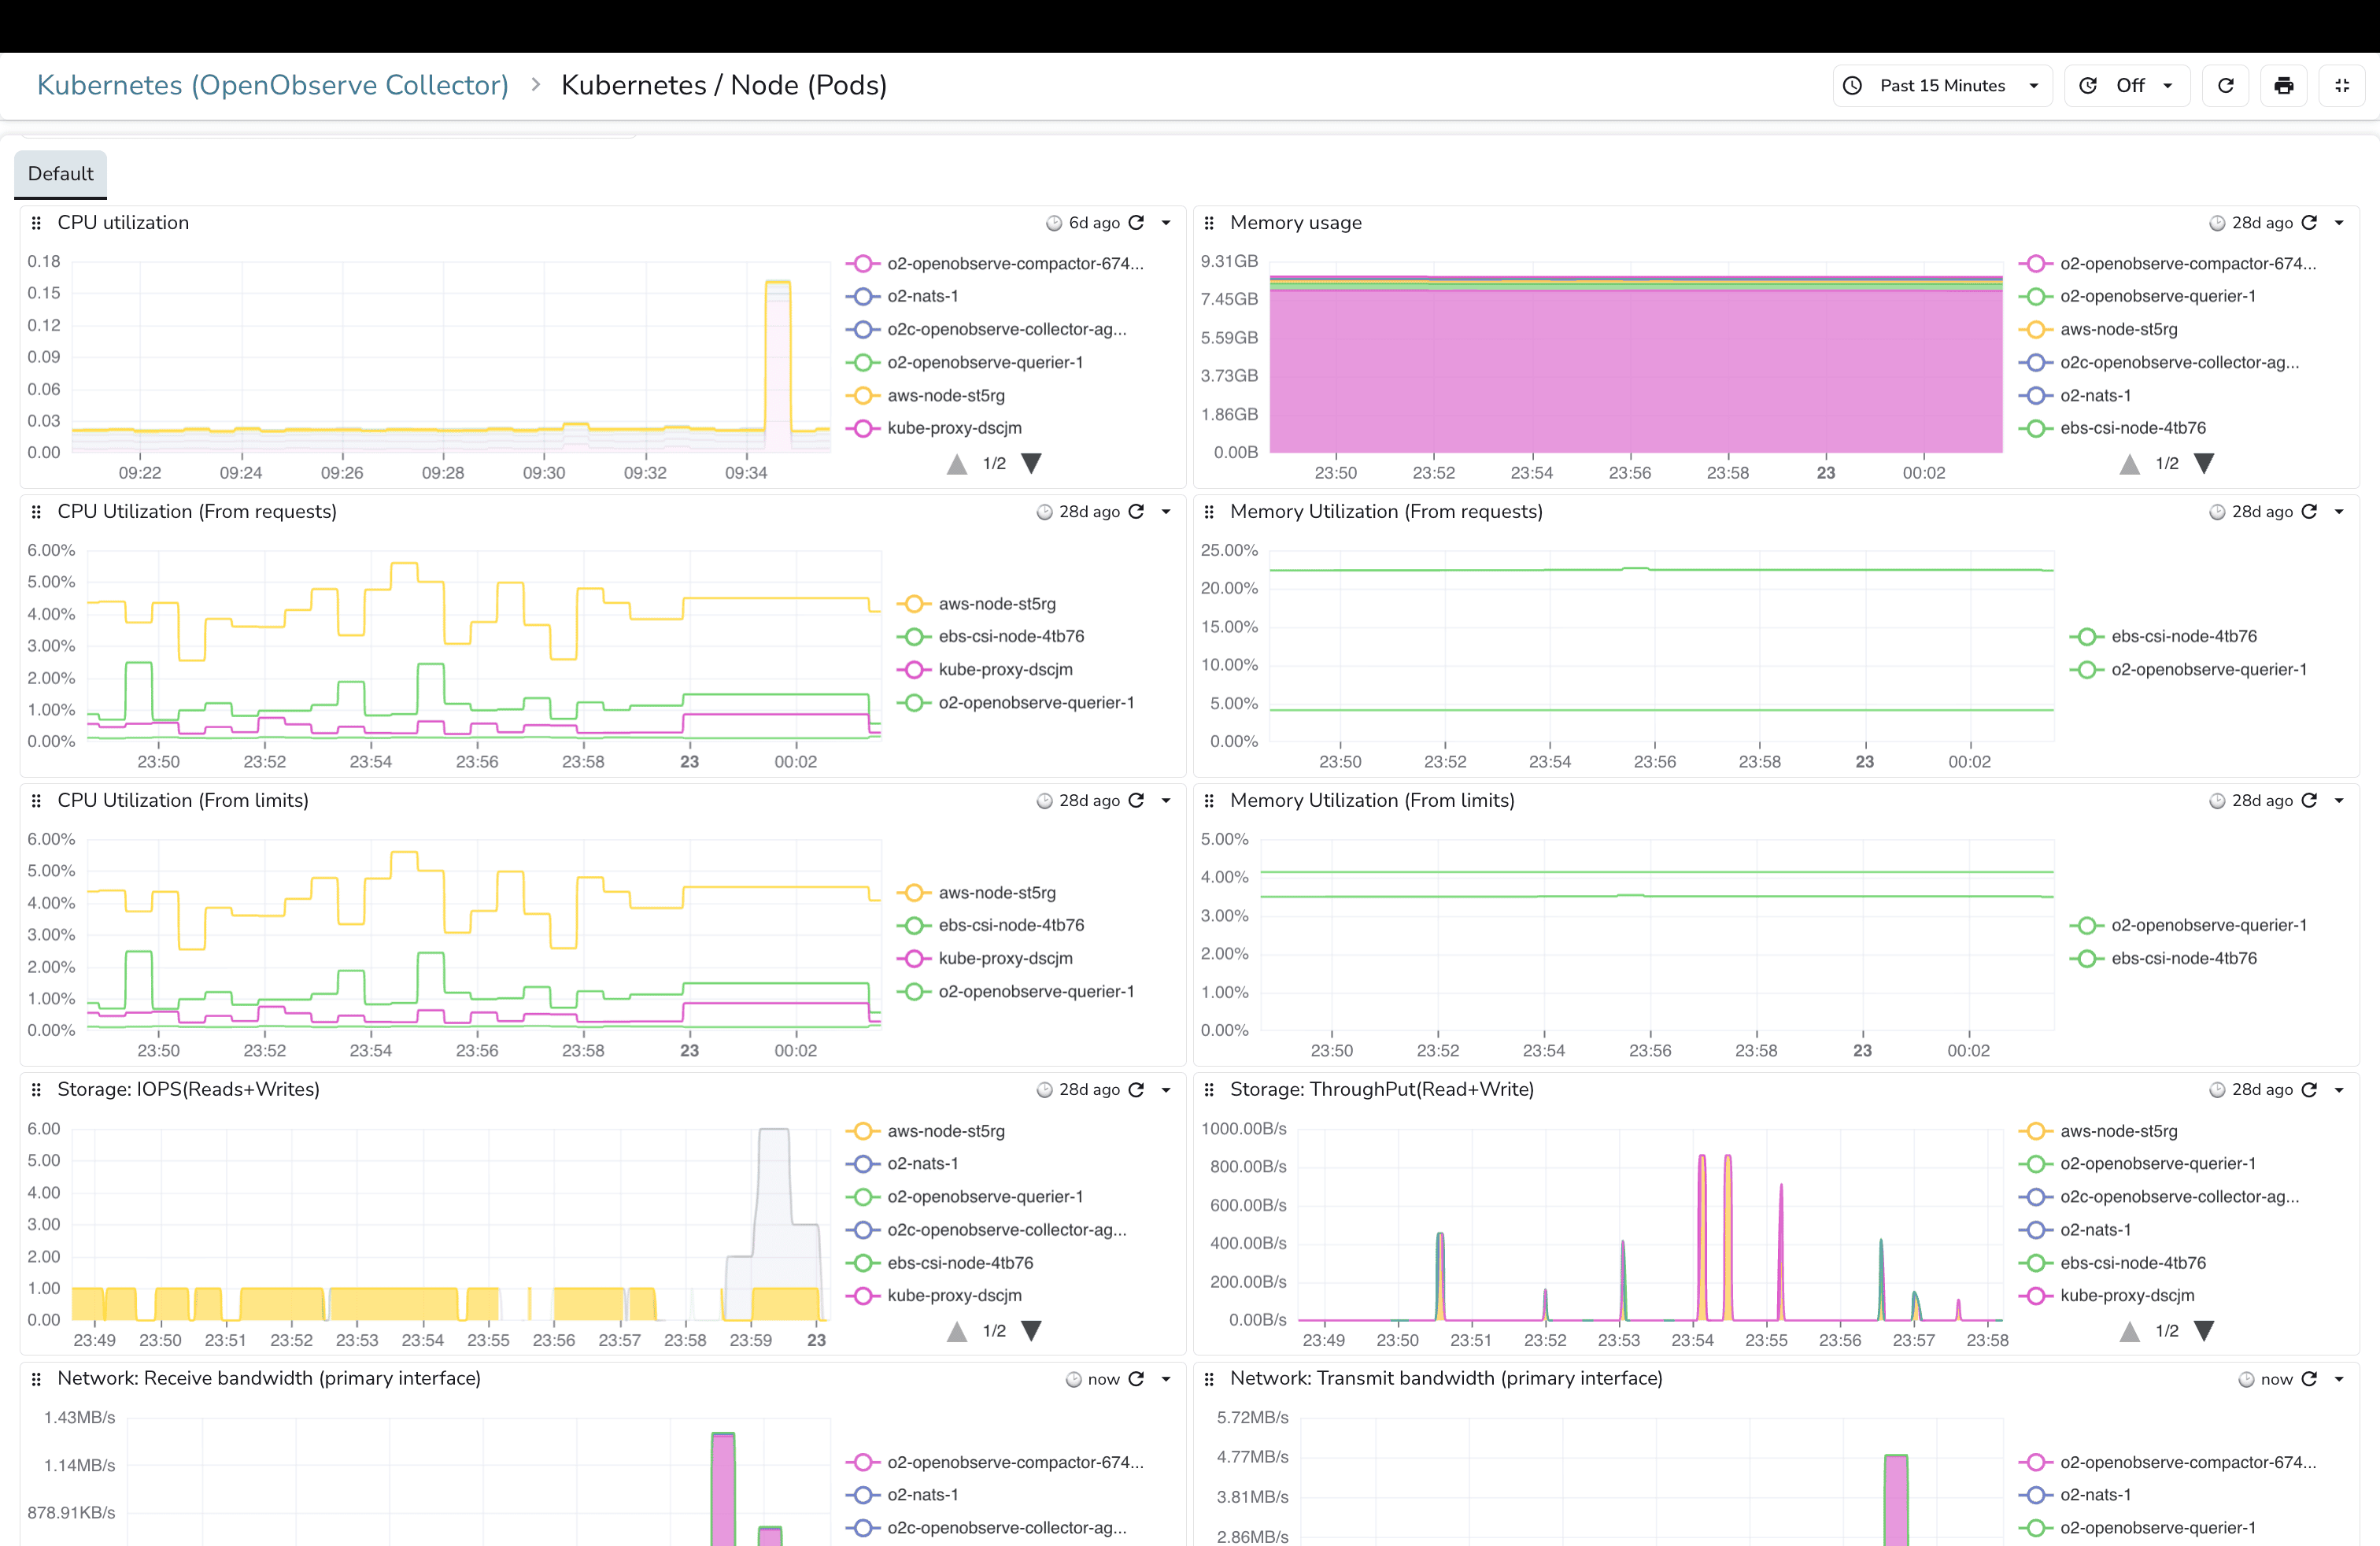
And there are more dashboards available in the OpenObserve community dashboards repository. You can explore dashboards for specific use cases, import them with a single click, and customize them to fit your needs.
Here's where things get really interesting. Beyond logs and metrics, distributed tracing gives you visibility into how requests flow through your microservices. Traditionally, implementing tracing means instrumenting your application code, adding libraries, and configuring exporters. That's time-consuming and error-prone.
OpenObserve Collector supports auto-instrumentation using OpenTelemetry, which means you can capture traces without modifying your application code at all. You simply add annotations to your Kubernetes pod or namespace configurations, and the OpenTelemetry Operator handles the rest.
Auto-instrumentation works across multiple programming languages. Here's how to enable it:
Java Applications:
instrumentation.opentelemetry.io/inject-java: "openobserve-collector/openobserve-java"
.NET Applications:
instrumentation.opentelemetry.io/inject-dotnet: "openobserve-collector/openobserve-dotnet"
NodeJS Applications:
instrumentation.opentelemetry.io/inject-nodejs: "openobserve-collector/openobserve-nodejs"
Python Applications:
instrumentation.opentelemetry.io/inject-python: "openobserve-collector/openobserve-python"
Go Applications (Uses eBPF):
instrumentation.opentelemetry.io/inject-go: "openobserve-collector/openobserve-go"
instrumentation.opentelemetry.io/otel-go-auto-target-exe: "/path/to/container/executable"
These annotations tell the OpenTelemetry Operator to inject the necessary instrumentation libraries into your application containers at runtime. The traces are then automatically sent to OpenObserve through the collector.
For a complete example of auto-instrumentation in action, check out the HotCommerce repository, which demonstrates end-to-end tracing in a microservices application. You can also dive deeper into auto-instrumentation setup in this detailed guide on OpenObserve's blog.
While deploying the OpenObserve Collector directly in your AKS cluster is the recommended approach for most use cases, there's another option worth mentioning for teams who prefer a more Azure-native integration.
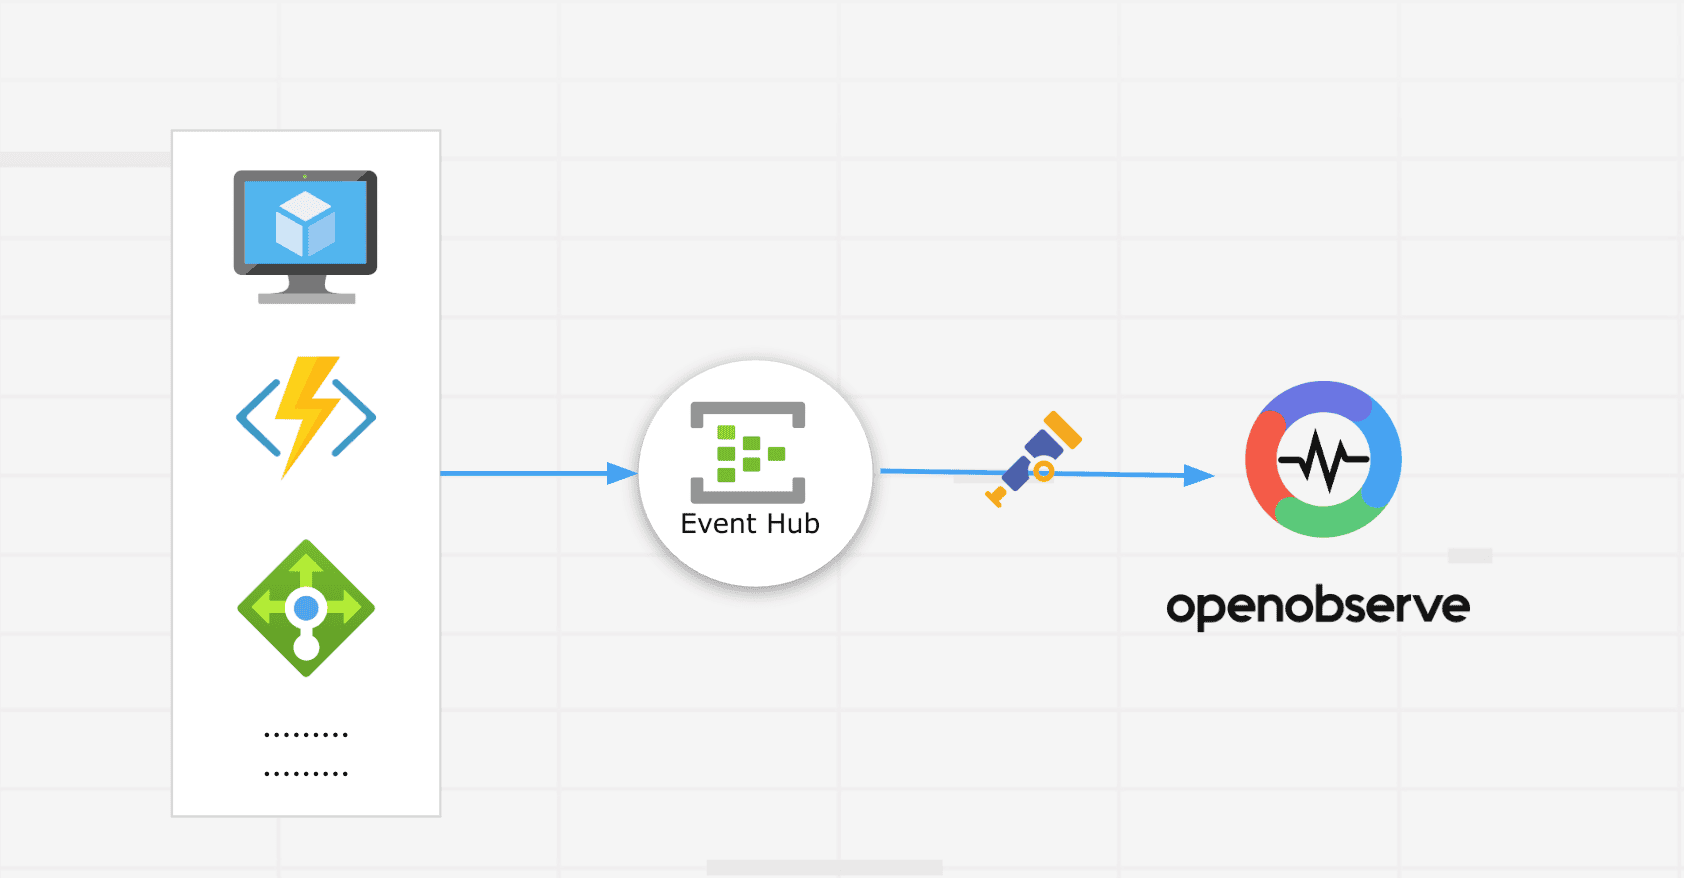
You can collect telemetry data using Azure Event Hub, then route it to OpenObserve using the OpenTelemetry Azure EventHub Receiver. This approach doesn't require deploying any agents or collectors within your cluster itself. All the telemetry flows through Azure's native services before reaching OpenObserve.
This method works well if you're already heavily invested in Azure's ecosystem and want to leverage existing Event Hub infrastructure. However, it does create more dependency on Azure services.
For teams interested in this approach, we've covered it in detail in our guide on monitoring Azure resources with EventHub Receiver.
Azure Kubernetes Service monitoring doesn't have to be complex or expensive. While AKS provides built-in monitoring through Azure Monitor and Log Analytics, these tools often leave teams dealing with fragmented views, high costs, and limited flexibility.
OpenObserve changes that equation. With the OpenObserve Collector, you get a unified platform for logs, metrics, and traces without the setup overhead. The collector deploys in minutes, comes pre-configured with best practices, and starts gathering observability data immediately. No complex configurations, no scattered tools, just comprehensive monitoring that works.
The value proposition is clear. Teams still relying solely on Azure's built-in analytics and monitoring are missing out on a unified view that brings all their observability signals together. Azure's approach keeps logs, metrics, and traces in separate silos, making troubleshooting slower and more frustrating.
Cost is another major factor. Azure Log Analytics pricing scales quickly, especially with larger clusters and extended retention requirements. OpenObserve's architecture leverages object storage with columnar compression, delivering significant cost savings without compromising on functionality or query performance.
Then there's the hybrid and multi-cloud reality. Many organizations run workloads across Azure, on-premises infrastructure, and sometimes other cloud providers. Managing separate monitoring systems for each environment creates blind spots and operational overhead. OpenObserve provides a single monitoring backend that works everywhere, giving you comprehensive, unified observability regardless of where your workloads run.
You now have everything you need to deploy OpenObserve in your AKS cluster. The steps we've covered will get you from zero to full observability in under an hour. Deploy the collector, verify data is flowing, import the pre-built dashboards, and you're monitoring your cluster like a pro.
Get Started with OpenObserve Today! Sign up for a free cloud trial
Q: Can I use OpenObserve alongside existing Azure Monitor?
Yes, absolutely. OpenObserve can run in parallel with Azure Monitor without any conflicts. Many teams start by deploying OpenObserve for specific clusters or namespaces while keeping Azure Monitor in place during the transition. This lets you compare the experience and gradually migrate at your own pace. The OpenObserve Collector doesn't interfere with Azure's monitoring agents.
Q: What's the difference between the OpenObserve Collector gateway and agent components?
The agent component runs as a DaemonSet, which means one pod on every node in your cluster. Agents collect logs and metrics locally from the node they're running on, keeping overhead low. The gateway component runs as a Deployment (typically with a few replicas for redundancy) and acts as a centralized processing layer. All agent data flows to the gateway, which handles enrichment, filtering, and export to your OpenObserve instance. This architecture balances efficiency with centralized control.
Q: Does OpenObserve support monitoring multiple AKS clusters?
Yes, OpenObserve excels at multi-cluster monitoring. You can deploy the collector in each AKS cluster you want to monitor, and all clusters send data to the same OpenObserve instance. Use different organization names or stream names to separate data by cluster. This gives you a single pane of glass for all your AKS clusters, whether they're in the same Azure region, different regions, or even different Azure subscriptions.
Q: What happens if the OpenObserve Collector goes down? Will I lose data?
The collector includes buffering capabilities. If connectivity to your OpenObserve instance is temporarily lost, the collector queues data locally and sends it once connectivity is restored. However, if the collector pods themselves crash, you might lose some data during that window. For production environments, ensure you've allocated sufficient resources to the collector and consider setting up alerts on collector pod health.
Q: Can I customize which metrics and logs the collector gathers?
Yes, the OpenObserve Collector is highly configurable. While the default configuration covers most use cases, you can customize the Helm chart values to add additional receivers, modify filtering rules, or change which metrics are collected. The OpenObserve Helm Chart repository includes detailed configuration documentation for advanced customization scenarios.
Manas is a passionate Dev and Cloud Advocate with a strong focus on cloud-native technologies, including observability, cloud, kubernetes, and opensource. building bridges between tech and community.


