Databricks, powered by Apache Spark, is a vital platform for data professionals managing large-scale data processing, machine learning, and analytics. Its distributed architecture generates a wealth of logs that can reveal critical insights—or obscure them if not monitored effectively. Untracked logs can hide job failures, performance bottlenecks, or unexpected cost increases, leaving you reacting rather than proactively managing your environment.
OpenObserve, an open-source observability platform, provides a robust solution to monitor Databricks logs in real time, offering clarity and efficiency. This guide emphasizes Databricks Express Setup for a quick, managed start, while detailing distinct steps for those using their own AWS, Azure, or GCP accounts. With straightforward instructions and a practical sample app, we’ll show you how to streamline log monitoring with OpenObserve. Let’s dive in and unlock the power of your Databricks logs.
Why Monitoring Databricks Logs Matters
Databricks logs are your key to operational visibility:
- Troubleshooting: Quickly identify errors like OutOfMemoryError or task failures.
- Performance Optimization: Detect inefficiencies such as slow tasks or data skew to enhance Spark jobs.
- Cost Management: Spot resource overuse to control cloud expenses.
- Compliance: Maintain auditable event logs for governance and regulatory requirements.
Without effective monitoring, you’re left manually sifting through logs—a time-consuming task. OpenObserve simplifies this with real-time insights, whether you’re using Express Setup or a custom cloud account.
Prerequisites
For Express Setup (Primary Focus)
- An active Databricks workspace via Express Setup, with serverless compute enabled (supports both SQL and Python).
- An operational OpenObserve instance (cloud or self-hosted, setup detailed in Step 1).
For Existing Cloud Account Scenario
- A Databricks workspace linked to your AWS, Azure, or GCP account.
- Access to cloud storage (e.g., S3, ADLS, GCS) with configuration permissions.
General Requirements
- Basic familiarity with Databricks and Spark.
Step 1: Understanding Databricks Log Types
Databricks generates logs from multiple components, each serving a distinct purpose:
- Driver Logs: Capture job orchestration and application outputs, such as notebook results or app-level messages.
- Executor Logs: Detail task execution across worker nodes, including task-specific errors or warnings.
- Event Logs: Track cluster lifecycle events, like scaling, startups, or terminations.
- Custom Logs: Reflect user-defined messages from your Spark code or scripts.
Express Setup
- Logs are stored in Databricks’ managed environment, accessible via the API. With Express Setup’s serverless compute, logs aren’t directly exposed like traditional clusters but can be retrieved programmatically for monitoring with OpenObserve.
Cloud Account
- Logs are routed to your designated cloud storage—AWS S3, Azure ADLS, or GCP GCS—requiring manual configuration.
OpenObserve Account
To monitor these logs, you’ll need an OpenObserve instance. Here’s how to set it up:
- Visit the OpenObserve downloads page.
- Choose your preferred option:
- Cloud: Sign up for a managed OpenObserve instance with a straightforward registration process—no infrastructure setup required. Ideal for quick starts and minimal maintenance.
- Self-Hosted: Download and deploy OpenObserve on your own servers (e.g., via Docker or Kubernetes) for full control. Follow the detailed installation instructions on the downloads page for setup on your preferred environment.
- After signup or deployment, log in to your OpenObserve instance to retrieve your endpoint and credentials. Log into OpenObserve and follow these steps:
- From the left menu, select Data Sources > Custom > Logs > Curl.
- Extract Details:
- Endpoint: (replace
<your_organization_id>; update default to cloudflare_logs).
https://api.openobserve.ai/api/<your_organization_id>/cloudflare_logs/_json
- Credentials: Username (e.g., nitya@openobserve.ai) and password (e.g., 802gZ3uo4N5S917s6Med).
Replace the example values with yours. Your OpenObserve setup is ready—on to the next step!
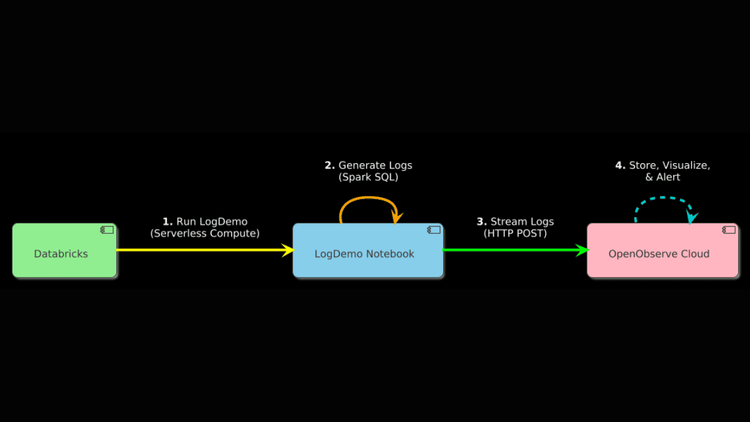
Step 2: Generating and Streaming Logs to OpenObserve
Let’s create a Python app to generate logs and send them directly to OpenObserve, using serverless compute in Express Setup, which supports both SQL and Python.
Setup and Execution
Create the Notebook
- In Databricks, go to "Workspace" in the left sidebar.
- Click "Create" > "Notebook."
- Name it "LogDemo," select Python as the language, and click "Create."
Connect Notebook to Serverless Compute
- At the top of the notebook, locate the "Connect" dropdown (right of the notebook name).
- Select "Serverless" from the dropdown. If it’s stopped, Databricks will start it when you run the script (may take a minute).
- Verify: Ensure it’s connected (status shows "Connected" and compute resource is green).
Add the Sample Code
- Paste this script into the notebook cell:
%python
# Create the LogDemo view
spark.sql("""
CREATE OR REPLACE TEMPORARY VIEW LogDemo AS
SELECT
    'Starting data processing with 20 partitions' AS message,
    current_timestamp() AS timestamp
UNION ALL
SELECT
    'Initial processing stage completed' AS message,
    current_timestamp() + INTERVAL 2 SECONDS AS timestamp
UNION ALL
SELECT
    CASE WHEN RAND() < 0.4 THEN 'Processing failed: unexpected data issue'
         ELSE 'Successfully counted 1 million rows' END AS message,
    current_timestamp() + INTERVAL 4 SECONDS AS timestamp
UNION ALL
SELECT
    'Processing finalized' AS message,
    current_timestamp() + INTERVAL 6 SECONDS AS timestamp
""")

# Fetch logs and format as JSON
log_data = spark.sql("""
WITH LogData AS (
    SELECT
        CASE
            WHEN message LIKE '%failed%' THEN 'ERROR'
            ELSE 'INFO'
        END AS level,
        message,
        timestamp,
        'databricks' AS source
    FROM LogDemo
    ORDER BY timestamp
)
SELECT
    to_json(array_agg(
        struct(
            level,
            message,
            timestamp,
            source
        )
    )) AS json_payload
FROM LogData
""")

# Extract the JSON payload
json_payload = log_data.collect()[0]['json_payload']

# Send logs to OpenObserve using Python requests
import requests

url = 'https://api.openobserve.ai/api/[your-organization]/databricks_logs/_json'
headers = {
    'Authorization': 'Basic [your-base64-credentials]',
    'Content-Type': 'application/json'
}
response = requests.post(url, headers=headers, data=json_payload)

# Display the response
response_text = response.text
display(response_text)
- Purpose: Generates logs (INFO, ERROR) with a 40% failure rate, formats them as JSON, and sends them to OpenObserve using the HTTP API.
- Customize:
- Replace [your-organization] with your OpenObserve organization name.
- Replace [your-base64-credentials] with your Base64-encoded OpenObserve credentials (e.g., run echo -n "your-email@example.com:your-password" | base64 to generate).
Run the Notebook
- Click "Run All" (top-right).
- Run multiple times to capture both success (~60% chance) and failure (~40% chance) scenarios. Each run generates and sends a new set of logs.
How Logs Are Transported
- Express Setup:
- The "LogDemo" script runs on your serverless compute resource. It uses spark.sql to create a temporary view with log messages, formats them as JSON, and sends them directly to OpenObserve via an HTTP POST request using requests. Logs are visible in the notebook output (via display(response_text)) and sent to OpenObserve for monitoring.
- Cloud Account:
- The script runs on your cluster’s driver node, following the same process. If log delivery is enabled, logs are also written to the driver’s log files (e.g., log4j-active.log) and flushed to cloud storage (e.g., S3, ADLS, GCS) every 5 minutes, viewable in the "Logs" tab.
Review the Logs
- Check logs:
- Express Setup: View the notebook output for the HTTP response:
- If successful, you’ll see a response like {"status":"success"}.
- If failed, you’ll see an error (e.g., {"status":"error","message":"Unauthorized"})—check your OpenObserve credentials.
- Cloud Account: Same as Express Setup for the HTTP response, plus check "Compute" > your cluster > "Logs" tab or storage (e.g., s3://your-bucket/databricks-logs/<cluster-id>/driver/log4j-active.log) for additional logs.
Step 3: Verify Log Streaming in OpenObserve
Verify Streaming
- In OpenObserve, go to "Logs" in the left sidebar.
- Search source:databricks to see logs like “INFO: Starting data processing....”
Troubleshooting
- If logs don’t appear:
- Check the notebook output for errors (e.g., HTTP 401/403 indicates incorrect credentials).
- Verify your OpenObserve URL, organization name, and credentials.
- Ensure "LogDemo" ran successfully and generated logs.
- To automate, schedule the "LogDemo" notebook as a job:
- Go to "Workflows" > "Create Job."
- Select the "LogDemo" notebook, set a schedule (e.g., every 5 minutes), and save.
Final Thoughts
Whether you’re leveraging Databricks Express Setup for a fast, managed experience or using your own AWS, Azure, or GCP account for customized control, OpenObserve equips you to monitor logs with precision. This guide has walked you through setting up OpenObserve, generating a test app, and streaming data directly to OpenObserve—tailored to your environment. With these tools, you’re ready to troubleshoot, optimize, and manage costs with confidence.
With your Databricks logs streaming into OpenObserve, you can further process them using pipelines, visualize them using interactive dashboards, or set up custom alerts to proactively assess and mitigate potential issues with your application.
Want to learn more or need assistance? Join our Slack community or reach out directly.