“OpenObserve helped us migrate from Datadog in under an hour... reducing observability costs by 4x.”

4x
Lower observability cost

< 1 hour
Migrated off Datadog

Flat pricing
No month-end surprises
Transform, enrich, redact, reduce.
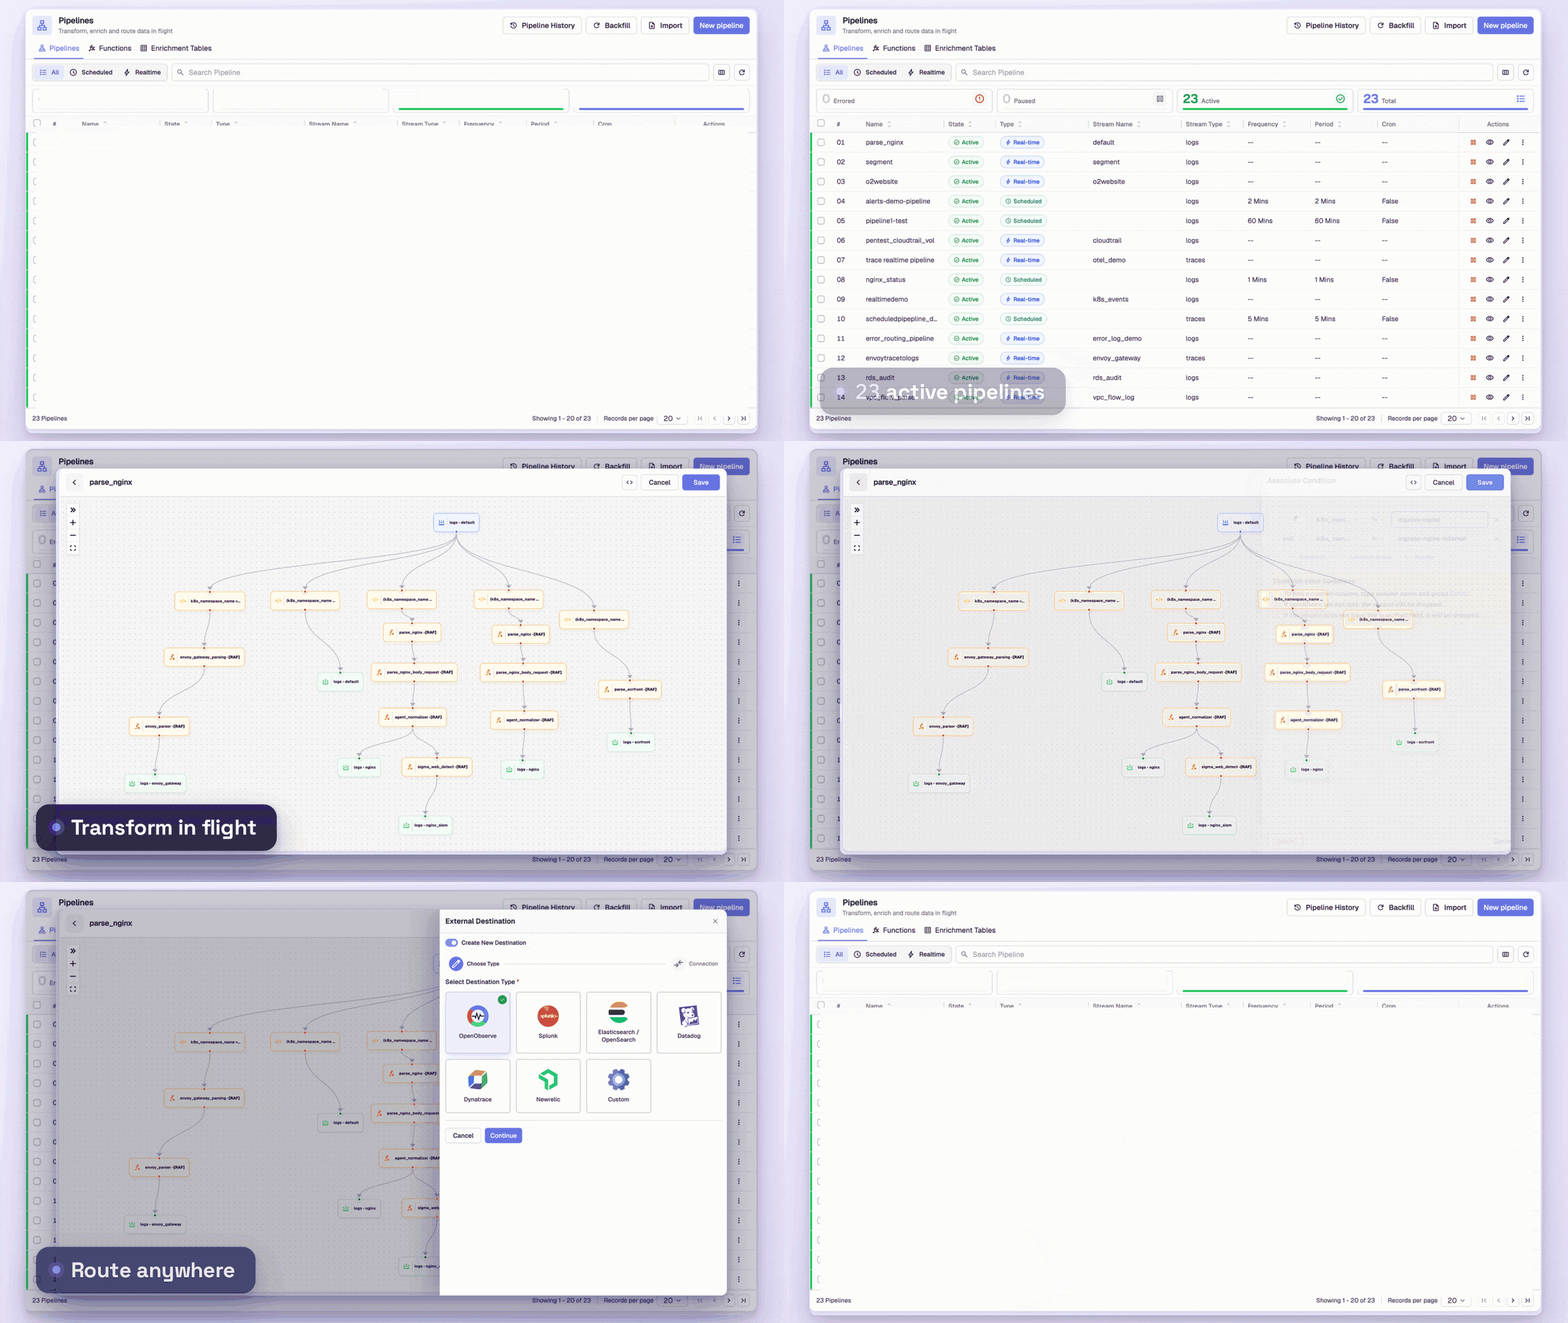
Transform, enrich, redact, reduce, and parse your observability data with real-time and scheduled pipelines.
Strip or mask sensitive fields at ingestion, before data ever hits disk.
VRL functions transform data the moment it arrives, no batch delay.
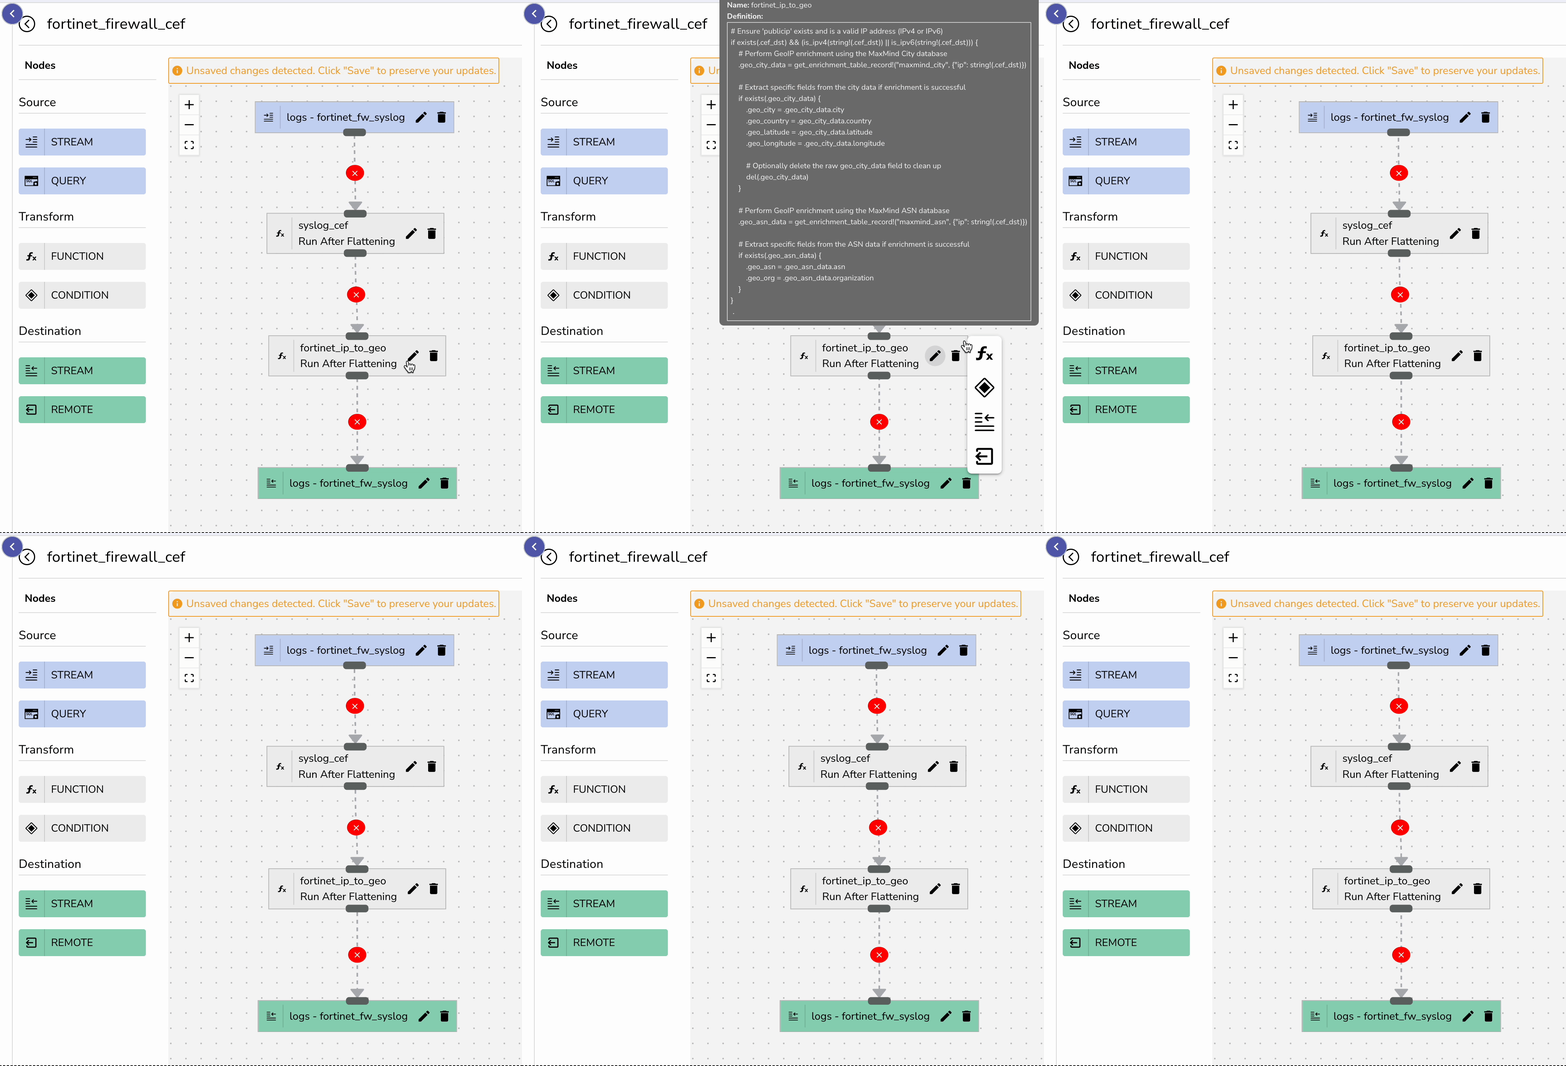
Handle JSON, syslog, CEF, and custom formats without separate parsers per source.
Transform data the instant it arrives. Parse, filter, and enrich streams on the fly, turning raw data into immediate insights.
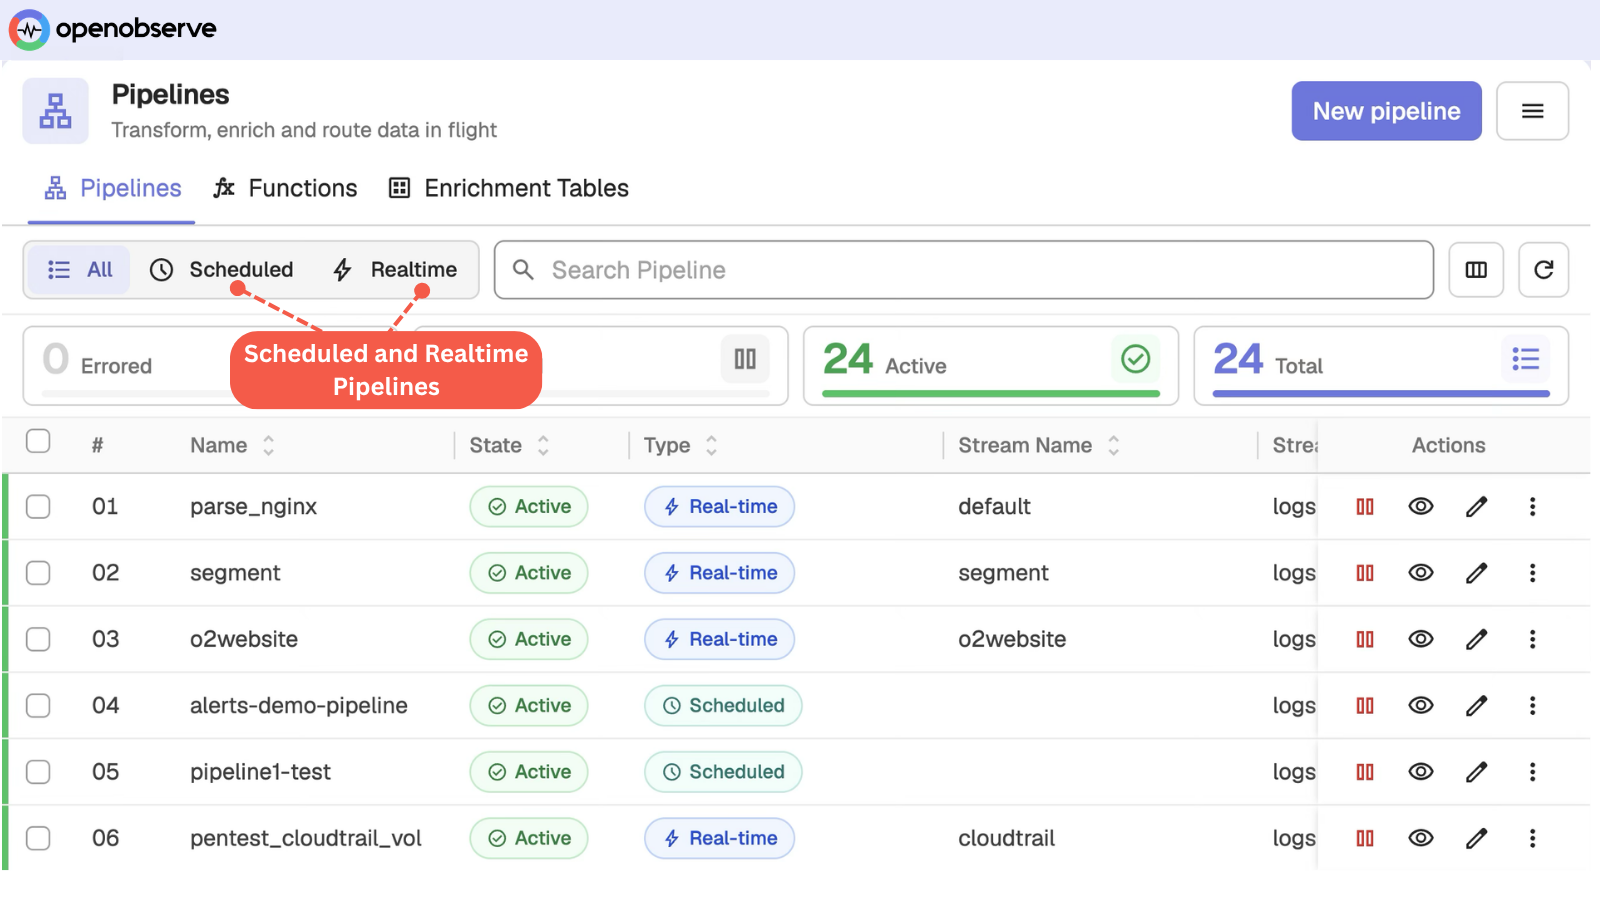
Orchestrate batch transformations precisely when you need them. Aggregate massive datasets, convert logs to actionable metrics, and process data on your timeline.
Build custom transformations that parse, enrich, and filter your data streams with functions that handle complex logic requirements.
Transform logs into structured data regardless of format using pre-built parsing functions.
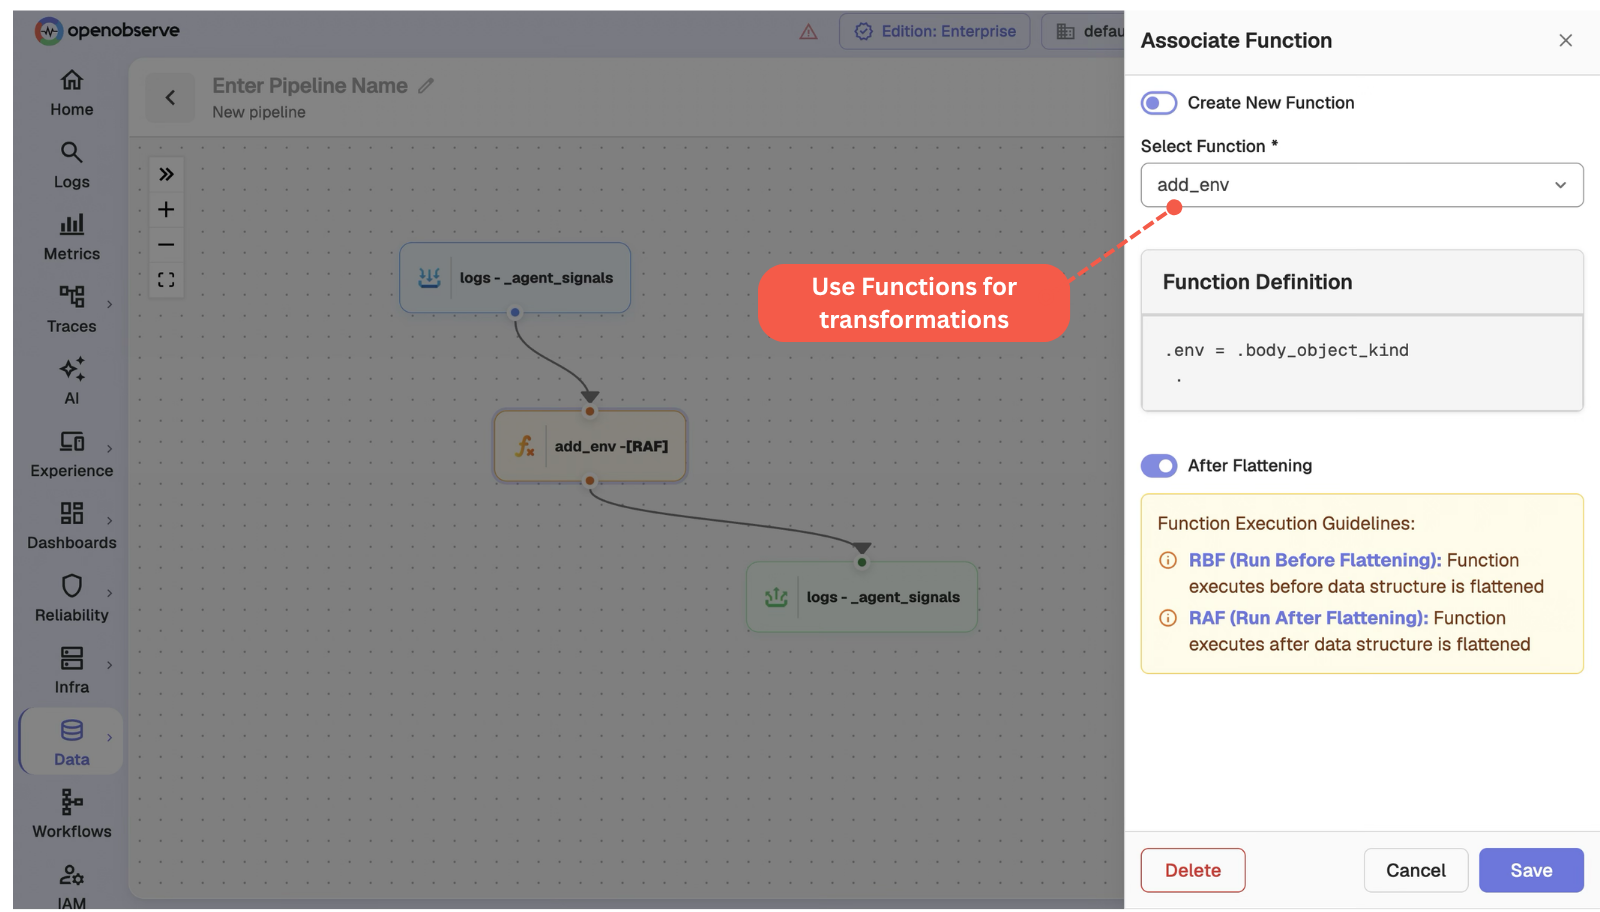
Transform raw events into context-rich data using simple CSV lookup tables. Add location data, user details, and metadata that turns isolated signals into patterns.
Pull in external context via API at ingestion time, no separate enrichment step required.
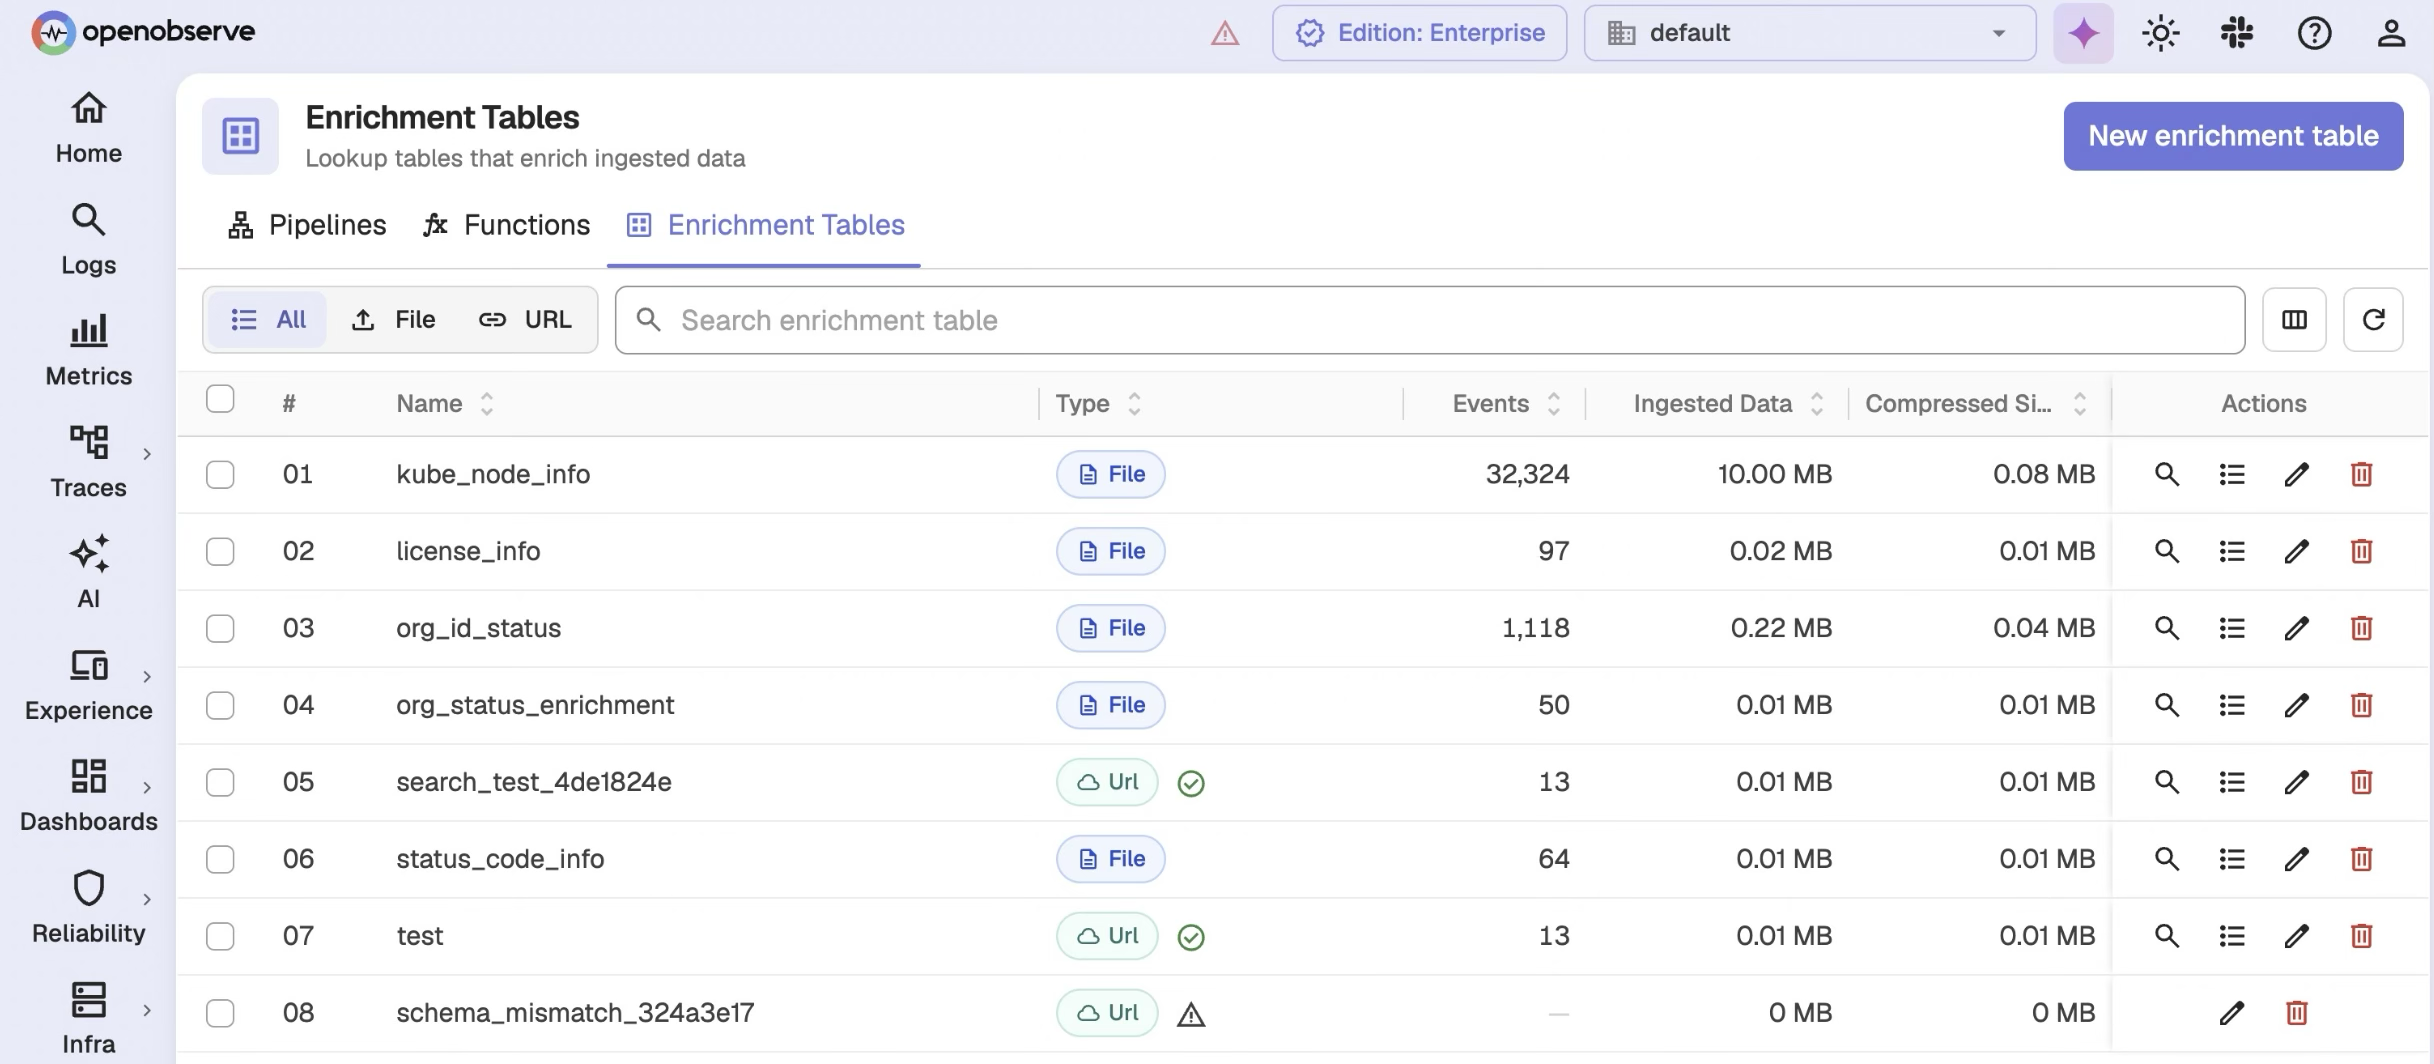
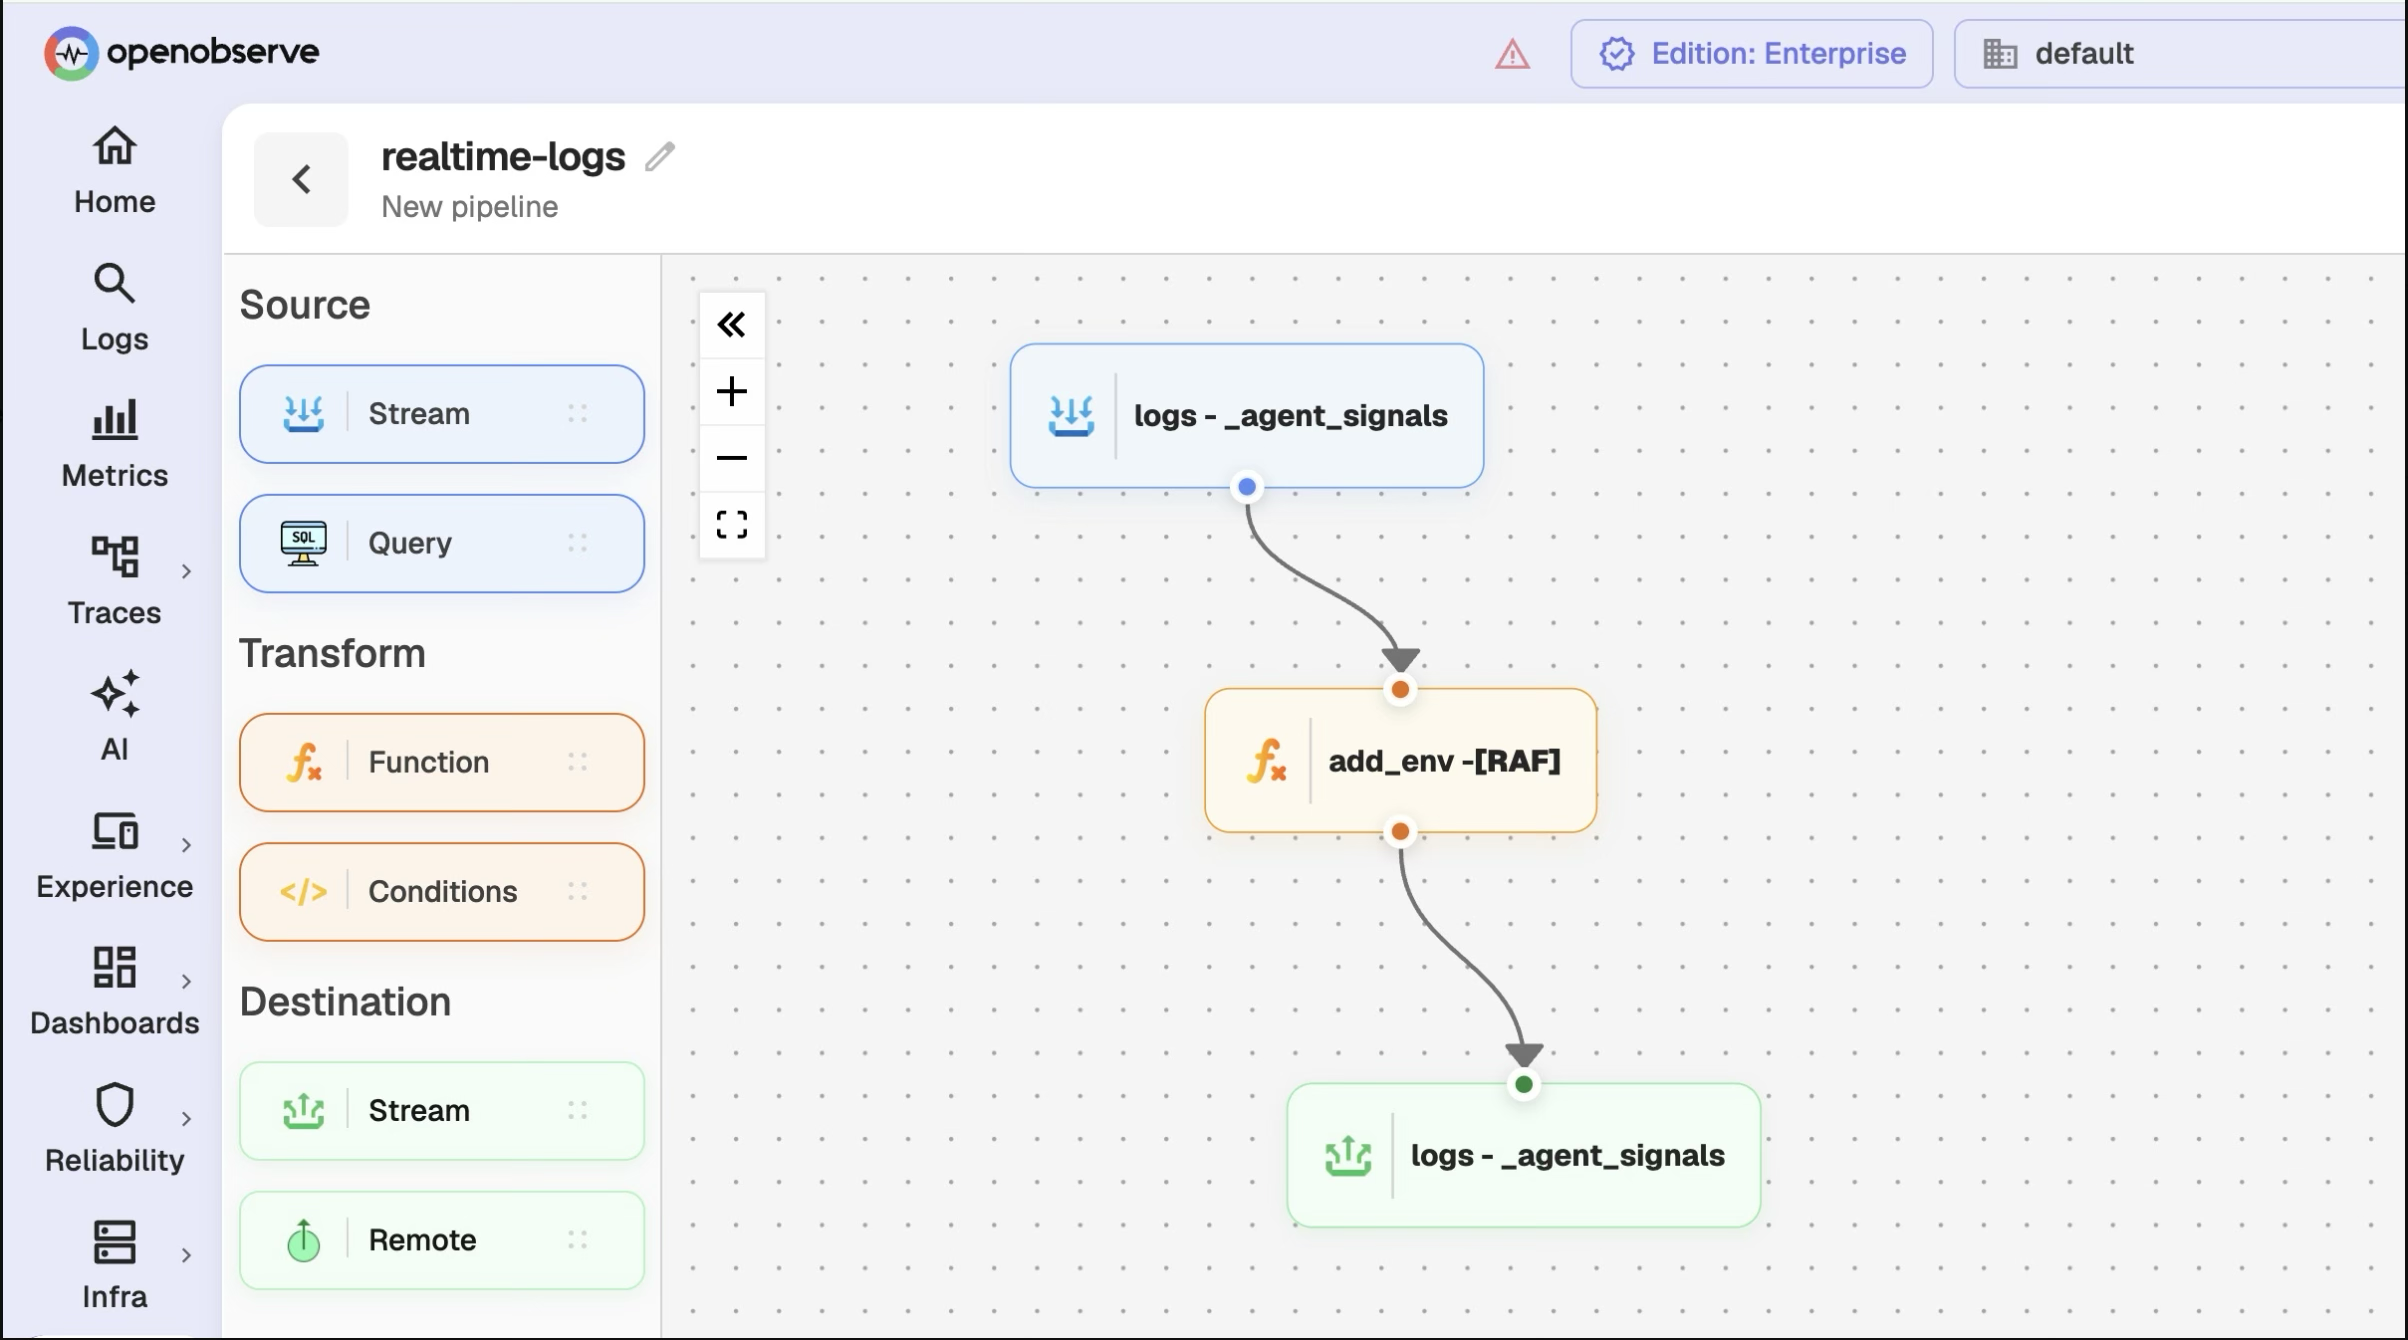
Build data processing workflows with VRL function nodes. Execute custom logic for complex transformations and create reusable components.
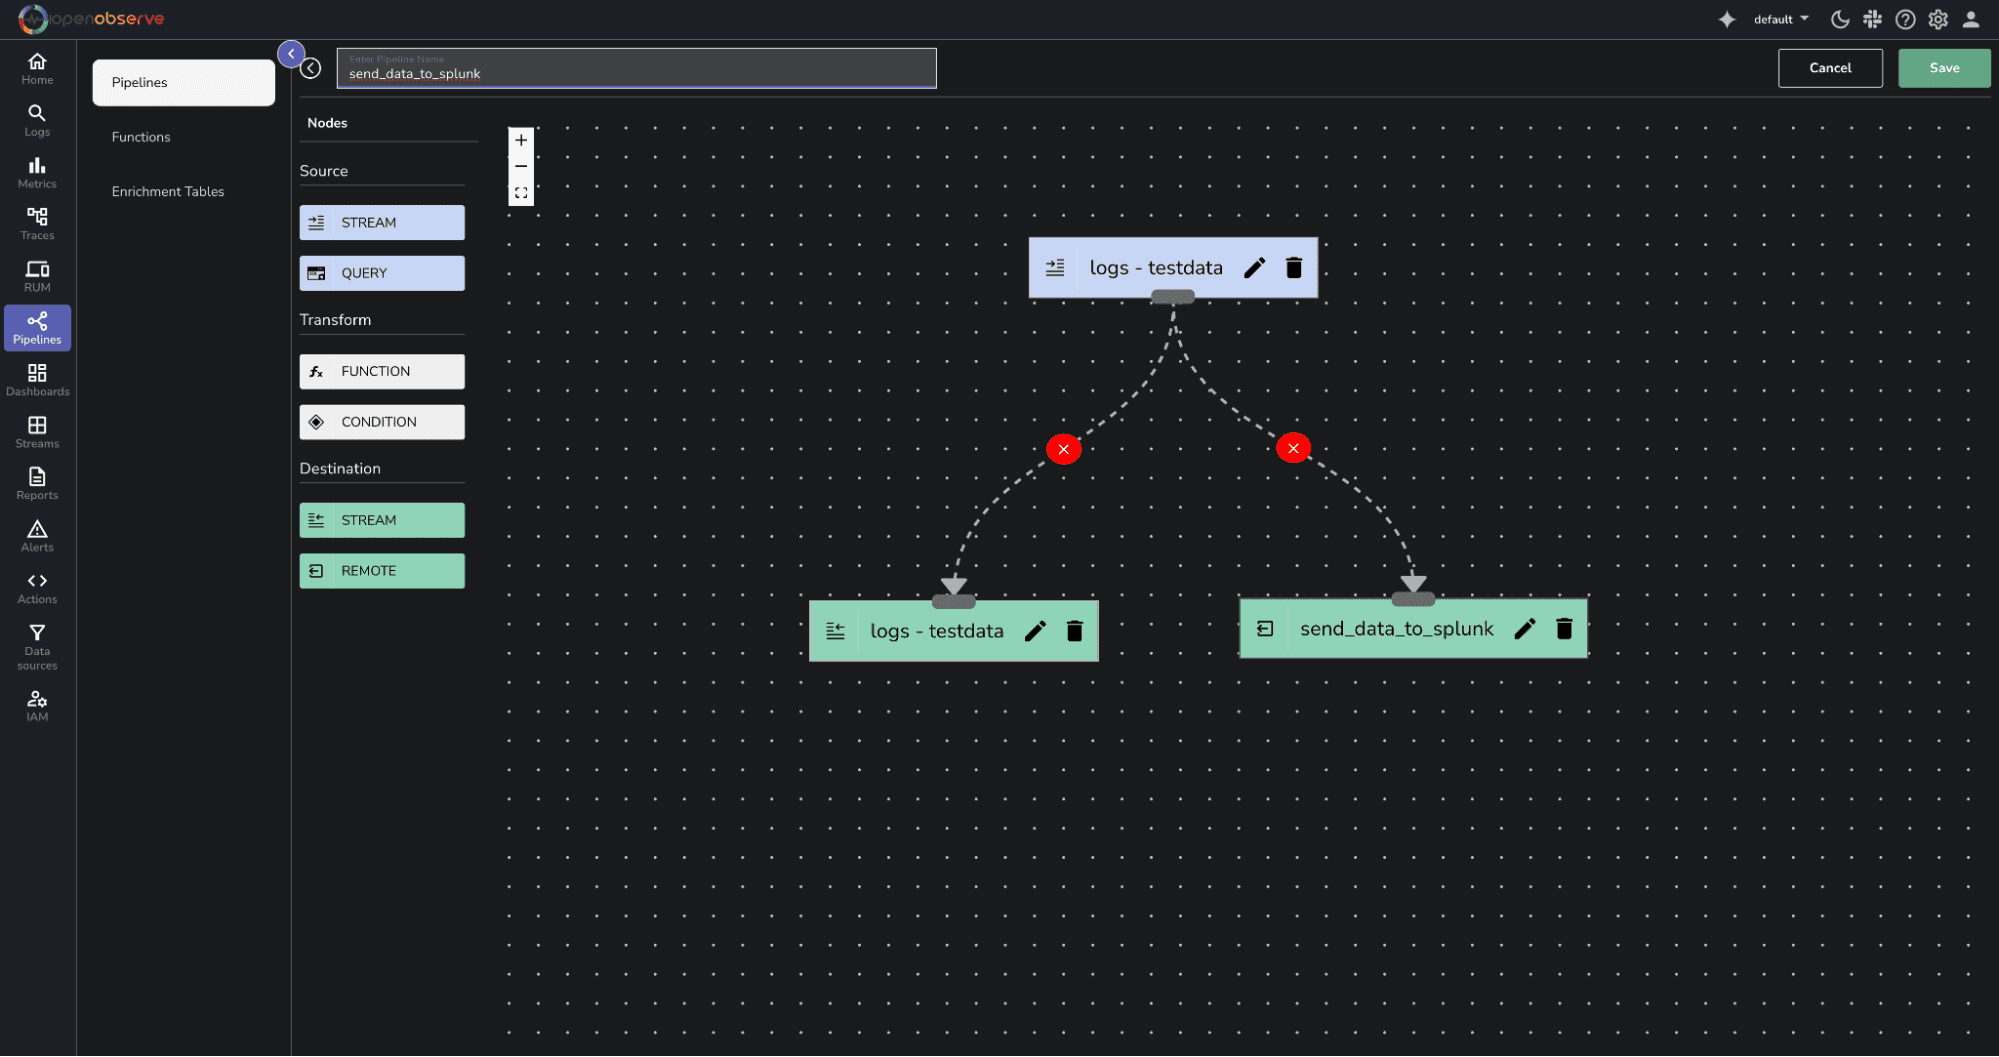
Filter, clone, and route streams to multiple destinations, ensuring every bit of data reaches exactly where it needs to go.
Same telemetry, same workloads, one platform. Every number is OpenObserve against a named vendor - not an industry average.
vs. Datadog
8×
more cost-effective
8x cost reduction means you can unify your observability into a single platform.
Read case studyvs. Elastic
140×
storage efficiency
140x storage means longer retention doesn't necessarily mean expensive bills.
Read case studyvs. Grafana stack
5–15×
faster performance
5x to 15x faster queries mean dashboards load in milliseconds, not minutes.
Read case studySee how much you would save switching today.
Correlate between the environments and signals across various sources with OpenObserve built-in correlation engine.
“OpenObserve helped us migrate from Datadog in under an hour... reducing observability costs by 4x.”
4x
Lower observability cost
< 1 hour
Migrated off Datadog
Flat pricing
No month-end surprises
to help you get the most out of Observability Pipelines.
Try OpenObserve today for more efficient and performant observability.

AI Observability by OpenObserve
OpenTelemetry-native observability for agents and LLMs.