Why OpenObserve for Vercel Log Monitoring?

Nitya Timalsina
March 14, 2025
12 min read
Don’t forget to share!
Try OpenObserve Cloud today for more efficient and performant observability.
Deploying web apps on Vercel is a breeze—Next.js, serverless functions, and edge middleware all come together seamlessly, whether you’re launching a quick side project or scaling a production-grade application. But once your app’s live, how do you keep an eye on what’s happening behind the scenes? Are your functions timing out? Is middleware misbehaving? Vercel’s dashboard offers a basic peek with request stats, but it leaves out the juicy details—like console.log outputs or build error specifics—that you need for serious debugging. That’s where a robust observability solution comes in handy, making it easy to spot issues and optimize performance.
In this comprehensive guide, we’ll walk you through monitoring Vercel logs with OpenObserve using a serverless function deployed right in your Vercel project. We’ll cover all the key steps: configuring the log drain, testing the flow, and troubleshooting any hiccups that may occur along the way.
Vercel’s Monitoring tab offers useful information at a quick glance—request counts, error statuses—but it’s not designed for in-depth troubleshooting. Need to see what your code is logging or why a build failed? You’re left digging through limited data. OpenObserve fills this gap by collecting every log your Vercel app produces: serverless function outputs, edge request details, build logs, and more. Its columnar compression slashes storage costs compared to tools like Elasticsearch, while its high-speed queries enable real-time analysis. With features like custom dashboards and alerts, OpenObserve scales seamlessly with your app, from small projects to high-traffic production environments.
For Vercel users, this means catching a timeout in the iad1 region or debugging middleware issues without piecing together clues from Vercel’s native interface. It’s observability that’s powerful, affordable, and tailored to your needs.
Before we get started, let’s ensure you have everything in place:
Got everything? Let’s get started.
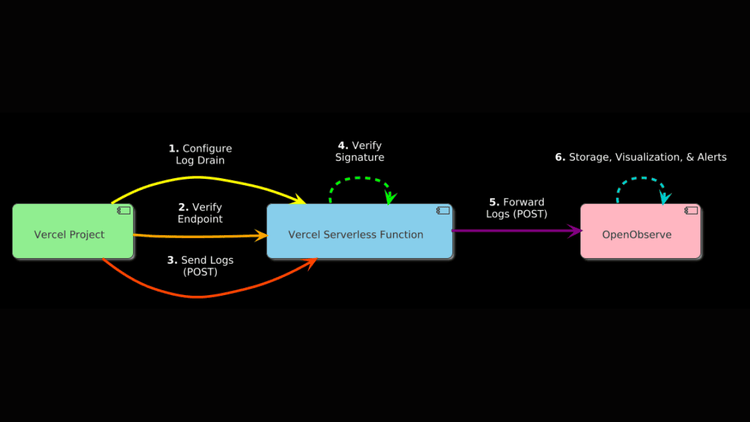
Vercel Log Drains allow you to forward logs—such as function executions or build outputs—to an external endpoint. To avoid re-verification issues when changing URLs, we’ll deploy a serverless function within your Vercel project as the Log Drain endpoint. This function will verify requests from Vercel and forward logs to OpenObserve. Here’s the detailed process.
To send logs to OpenObserve, you need its ingestion endpoint and an API key for authentication. Follow these steps to retrieve them:
The endpoint will look like this:
https://api.openobserve.ai/api/<your-org-id>/<your-stream-name>/_json
https://api.openobserve.ai/api/nitya_organization_50763_nJO9encbUWsGmSu/vercel_logs/_json /_json, which indicates that logs are sent as JSON arrays.The authorization token will look like this:
Basic bml0eWFAb3Blbm9ic2VydmUuYWk6ODAyZ1ozdW80TjVTOTE3czZNZWQ=
Verify connectivity with a simple test:
curl -X POST -H "Authorization: Basic <your-api-key>" -H "Content-Type: application/json" \
-d '[{"test": "hello"}]' https://api.openobserve.ai/api/<your-org-id>/vercel_logs/_json
A 200 or 204 response confirms success. If you get a 400, ensure your JSON is an array ([{"key": "value"}]). A 401 indicates an incorrect API key, and a 404 suggests an error in the org ID or stream name.
Create a serverless function within your Vercel project to serve as the Log Drain endpoint, handling verification and log forwarding:
In your project’s root directory (e.g., blog-starter-kit), create a file at api/logs.js with the following code. Modify it as needed for a project utilizing TypeScript or another language:
// Vercel Function for log drain to OpenObserve
const https = require('https');

// Configuration
// Replace with your own
const OPENOBSERVE_URL = 'https://api.openobserve.ai/api/<your-org-id>/vercel_logs/_json';
const API_KEY = 'bml0eWFAb3Blbm9ic2VydmUuYWk6ODAyZ1ozdW80TjVTOTE3czZNZWQ=';
// You can get this from the Log Drain setup process, detailed in /1.3 below
const VERCEL_VERIFY_HEADER = 'fd45a95690b57b4b161f0b4413ce086ac5255783';

// Helper function to log details
function logInfo(message, data) {
  console.log(`INFO: ${message}`, JSON.stringify(data || {}));
}

// Helper function to send data to OpenObserve
async function sendToOpenObserve(data) {
  return new Promise((resolve, reject) => {
    const body = JSON.stringify(data);

    const options = {
      method: 'POST',
      headers: {
        'Authorization': `Basic ${API_KEY}`,
        'Content-Type': 'application/json',
        'stream-name': 'vercel_logs'
      }
    };

    logInfo('Sending to OpenObserve', { dataSize: body.length });

    const req = https.request(OPENOBSERVE_URL, options, (res) => {
      let responseData = '';

      res.on('data', (chunk) => {
        responseData += chunk;
      });

      res.on('end', () => {
        logInfo('OpenObserve response', {
          status: res.statusCode,
          response: responseData
        });

        if (res.statusCode >= 200 && res.statusCode < 300) {
          resolve({ success: true, status: res.statusCode, data: responseData });
        } else {
          reject(new Error(`OpenObserve returned status ${res.statusCode}: ${responseData}`));
        }
      });
    });

    req.on('error', (error) => {
      logInfo('Error sending to OpenObserve', { error: error.message });
      reject(error);
    });

    req.write(body);
    req.end();
  });
}

// Main handler function
module.exports = async (req, res) => {
  // Log basic request info
  logInfo('Request received', {
    method: req.method,
    url: req.url,
    headers: req.headers,
    query: req.query
  });

  // Always include verification header
  res.setHeader('x-vercel-verify', VERCEL_VERIFY_HEADER);

  // Handle verification requests
  if (req.method === 'GET' || req.method === 'HEAD') {
    logInfo('Handling verification request');
    return res.status(200).send('Verified');
  }

  // Handle log forwarding
  if (req.method === 'POST') {
    try {
      // Check if this is a verification POST
      if (req.headers['x-vercel-verify'] === 'true') {
        logInfo('Handling verification POST request');
        return res.status(200).send('Verified');
      }

      // Process log data
      if (!req.body) {
        logInfo('No body in request');
        return res.status(200).send('No data to process');
      }

      // Log the received data (truncated for readability)
      const bodyStr = JSON.stringify(req.body);
      logInfo('Received log data', {
        preview: bodyStr.substring(0, 200) + (bodyStr.length > 200 ? '...' : ''),
        size: bodyStr.length
      });

      // Prepare data for OpenObserve
      const logData = {
        ...req.body,
        timestamp: req.body.timestamp || new Date().toISOString(),
        _meta: {
          received_at: new Date().toISOString(),
          source: 'vercel',
          function: 'log-drain'
        }
      };

      // Send to OpenObserve
      try {
        const result = await sendToOpenObserve(logData);
        logInfo('Successfully forwarded to OpenObserve', result);
      } catch (error) {
        logInfo('Failed to send to OpenObserve', { error: error.message });
        // Continue execution - we still want to return 200 to Vercel
      }

      // Always return success to Vercel to prevent retries
      return res.status(200).send('Logs processed');
    } catch (error) {
      logInfo('Error processing request', { error: error.message, stack: error.stack });
      // Still return success to prevent Vercel from retrying
      return res.status(200).send('Error processing request');
    }
  }

  // Handle any other method
  logInfo('Unhandled method', { method: req.method });
  return res.status(200).send('Method accepted');
};
Replace <your-org-id> with your organization ID (e.g., nitya_organization_50763_nJO9encbUWsGmSu).
Replace <your-api-key> with your API key (e.g., bml0eWFAb3Blbm9ic2VydmUuYWk6ODAyZ1ozdW80TjVTOTE3czZNZWQ=).
Replace <your-vercel-verify-token> with the token Vercel provides during Log Drain setup (e.g., fd45a95690b57b4b161f0b4413ce086ac5255783).
Replace <your-log-drain-secret> with the secret Vercel provides after creating the Log Drain (e.g., hRcNbZt4MxtDphbDejihnYr8X). You’ll get this secret once the Log Drain is created in step 1.2.3.
Add the file, commit, and push:
git add api/logs.js
git commit -m "Add log drain endpoint for OpenObserve"
git push
Once the project is deployed on Vercel, note your logs endpoint, which will look like: https://<your-app>.vercel.app/api/logs (e.g., https://blog-starter-kit-silk-nine.vercel.app/api/logs).
Now, you are ready to use that endpoint (i.e., https://<your-app>.vercel.app/api/logs) to configure a log drain to direct logs for your Vercel application to OpenObserve:
Note that configuring a Log Drain on Vercel involves the following requirement, which we have already accounted for in 1.2 above:
Verify URL ownership by responding with status code `200`and the following header: `<x-vercel-verify: fd45a95690b57b4b161f0b4413ce086ac5255783>`
After saving, Vercel confirms the Log Drain creation and provides a secret for securing requests, along with a code snippet for verifying the x-vercel-signature header:
Secret: hRcNbZt4MxtDphbDejihnYr8X
Note: This secret will not be shown again, so copy it immediately.
Vercel also provides a verification snippet:
const crypto = require('crypto');

async function verifySignature(req) {
  const signature = crypto
    .createHmac('sha1', process.env.LOG_DRAIN_SECRET)
    .update(JSON.stringify(req.body))
    .digest('hex');
  return signature === req.headers['x-vercel-signature'];
}
a. Update api/logs.js with this secret:
b. Redeploy:
git commit -m "Add Log Drain secret for verification" && git push
This ensures all Log Drain requests are verified, securing your endpoint in production.
Once you have set up your Log Drain, you can test it to ensure it’s working as expected:
If the test log drain is successful, you should see a “Test log drain sent successfully” message. If it fails, see the troubleshooting section.
Now, navigate to “Logs” in OpenObserve to view the Vercel logs. Select the vercel_logs stream. Then, you should see logs like:
{
  "_timestamp": 1741811750773397,
  "0_branch": "main",
  "0_deploymentid": "dpl_4moaAZzTC7YWvjPVYfvFTFN5iQA1",
  "0_environment": "production",
  "0_executionregion": "iad1",
  "0_host": "blog-starter-kit-silk-nine.vercel.app",
  "0_id": "85082895730174181174596118100000",
  "0_level": "info",
  "0_message": "INFO: Request received {\"method\":\"POST\",\"url\":\"/api/logs\",...}",
  "0_path": "/api/logs",
  "0_projectid": "prj_2J00dsibvUf7qtUv0fVnrxnnvvNb",
  "0_projectname": "blog-starter-kit",
  "0_proxy_clientip": "100.27.231.66",
  "0_proxy_host": "blog-starter-kit-silk-nine.vercel.app",
  "0_proxy_lambdaregion": "iad1",
  "0_proxy_method": "POST",
  "0_proxy_path": "/api/logs",
  "0_proxy_pathtype": "streaming_func",
  "0_proxy_region": "iad1",
  "0_proxy_scheme": "https",
  "0_proxy_timestamp": 1741811745805,
  "0_proxy_vercelcache": "MISS",
  "0_requestid": "mxdfx-1741811745805-8605a0d9c614",
  "0_source": "lambda",
  "0_timestamp": 1741811745961,
  "0_type": "stdout"
}
These logs include metadata (e.g., proxy_clientip, requestid) and your app’s outputs—ideal for debugging.
Now that your logs are correctly streaming into OpenObserve, you can process them using pipelines, visualize them using interactive dashboards, or set up custom alerts to proactively assess and mitigate potential issues with your application.
Encountering issues? Here’s a detailed guide to diagnose and resolve them, using your log examples:
INFO: Handling verification request {}
or
INFO: Handling verification POST request {}
Missing logs? Vercel isn’t reaching your endpoint.
git commit -m "Fix verification token" && git push
Re-save the Log Drain.
INFO: Signature verification failed {}
git commit -m "Fix Log Drain secret" && git push
INFO: Sending to OpenObserve {"dataSize": 5212}

INFO: OpenObserve response {"status":200,"response":"{\"code\":200,\"status\":[{\"name\":\"vercel_logs\",\"successful\":1,\"failed\":0}]}"}
Missing or showing errors (e.g., status: 400)? Forwarding failed.
curl -X POST -H "Authorization: Basic <your-api-key>" -H "Content-Type: application/json" \ -d '[{"test": "hello"}]' https://api.openobserve.ai/api/<your-org-id>/vercel_logs/_json
Redeploy if corrected. Confirm logs in Vercel’s Monitoring tab (e.g., Hello from Vercel at...).
"0_level": "error",
"0_message": "START RequestId: d84b9821-0f1e-4256-b36e-c39748fea63e\n[POST] /api/logs status=504\nEND RequestId: d84b9821-0f1e-4256-b36e-c39748fea63e\nREPORT RequestId: d84b9821-0f1e-4256-b36e-c39748fea63e Duration: 15000 ms..."
curl -X POST https://<your-app>.vercel.app/api/logs -d '[{"test": "small"}]' -H "Content-Type: application/json"
"0_message": "INFO: Received log data {\"preview\":\"[{\\\"id\\\":\\\"55729663910174181174125389600000\\\",\\\"message\\\":\\\"INFO: Request received...\",\"size\":5065}"
INFO: Error sending to OpenObserve {"error":"Request timed out"}
You’ve built a robust Vercel log monitoring system with OpenObserve, using a secure serverless function to streamline the process. Now, you have deep visibility into your app’s runtime—function logs, edge details, and more—all in one place.
Want to learn more or have questions? If you have any questions or need help, please join our Slack community or reach out directly. We're here to help make your monitoring journey as smooth as possible!
Nitya is a Developer Advocate at OpenObserve, with a diverse background in software development, technical consulting, and organizational leadership. Nitya is passionate about open-source technology, accessibility, and sustainable innovation.


