Monitoring AWS Bedrock: Collecting Logs & Metrics in OpenObserve

Simran Kumari
November 28, 2025
11 min read
Don’t forget to share!
Try OpenObserve Cloud today for more efficient and performant observability.
As teams begin integrating AWS Bedrock into their applications, a new challenge appears almost immediately: how do we monitor model performance, latency, errors, and overall usage in a way that is actually actionable?
It’s not enough to simply know that your model was invoked. You need to understand how long it took, how often it’s being used, and whether the model is contributing to latency spikes or cost increases. These signals are essential when you are wrapping Bedrock calls inside Lambda functions, API endpoints, or backend services.
This guide walks through a practical setup for collecting both logs and metrics from Bedrock and streaming them into OpenObserve, where you can build dashboards, perform correlation, and set up real-time monitoring. The approach is simple, reliable, and works at scale , especially when your model invocation traffic begins to grow.
Modern LLM-based applications behave differently from traditional microservices. Latency depends not only on your system but also on the model provider. Throughput fluctuates with token counts, and failures can occur due to quota limits, safety filters, or malformed prompts.
When you monitor Bedrock, you gain visibility into:
Monitoring becomes essential when Bedrock sits on the critical path of a user-facing workflow.
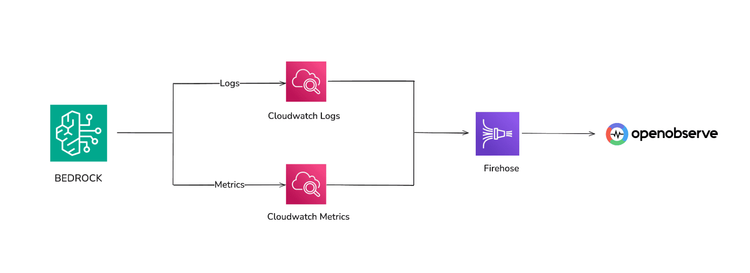
In most setups, the model invocation happens inside a Lambda function using the Bedrock client. Both Lambda and Bedrock produces logs, and Bedrock itself emits metrics such as invocation latency. Both land inside CloudWatch. From there, we extract them using Firehose and deliver everything into OpenObserve.
 This single pipeline gives you unified visibility in OpenObserve.
Before sending data to OpenObserve, ensure a few foundational pieces are ready inside AWS.
bedrock:InvokeModel, bedrock:InvokeModelWithResponseStream).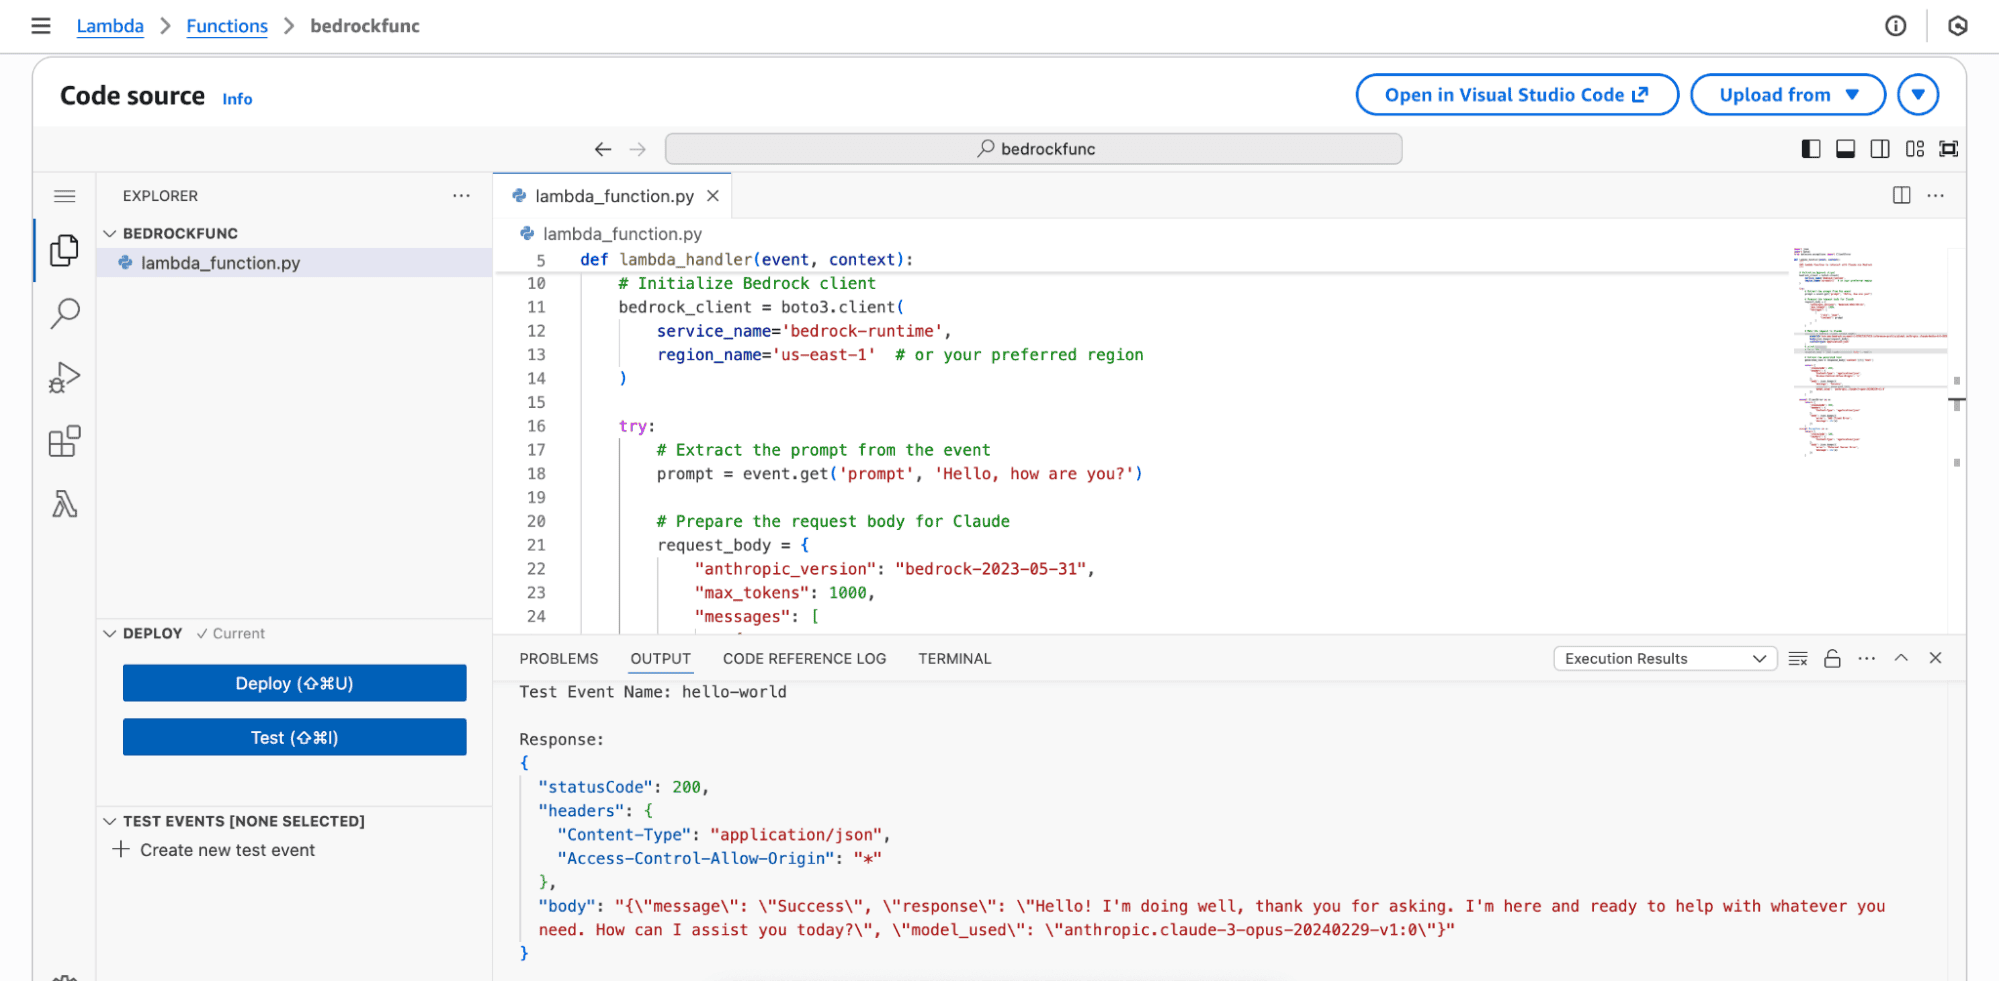
With these basics in place, you’re ready to build the pipeline.
1. In the AWS services menu, search for Kinesis and select it. 2. Create a Delivery Stream
3. Configure Destination
Select HTTP Endpoint as the destination.
Endpoint URL: Enter your OpenObserve Kinesis Firehose endpoint and Access Key.
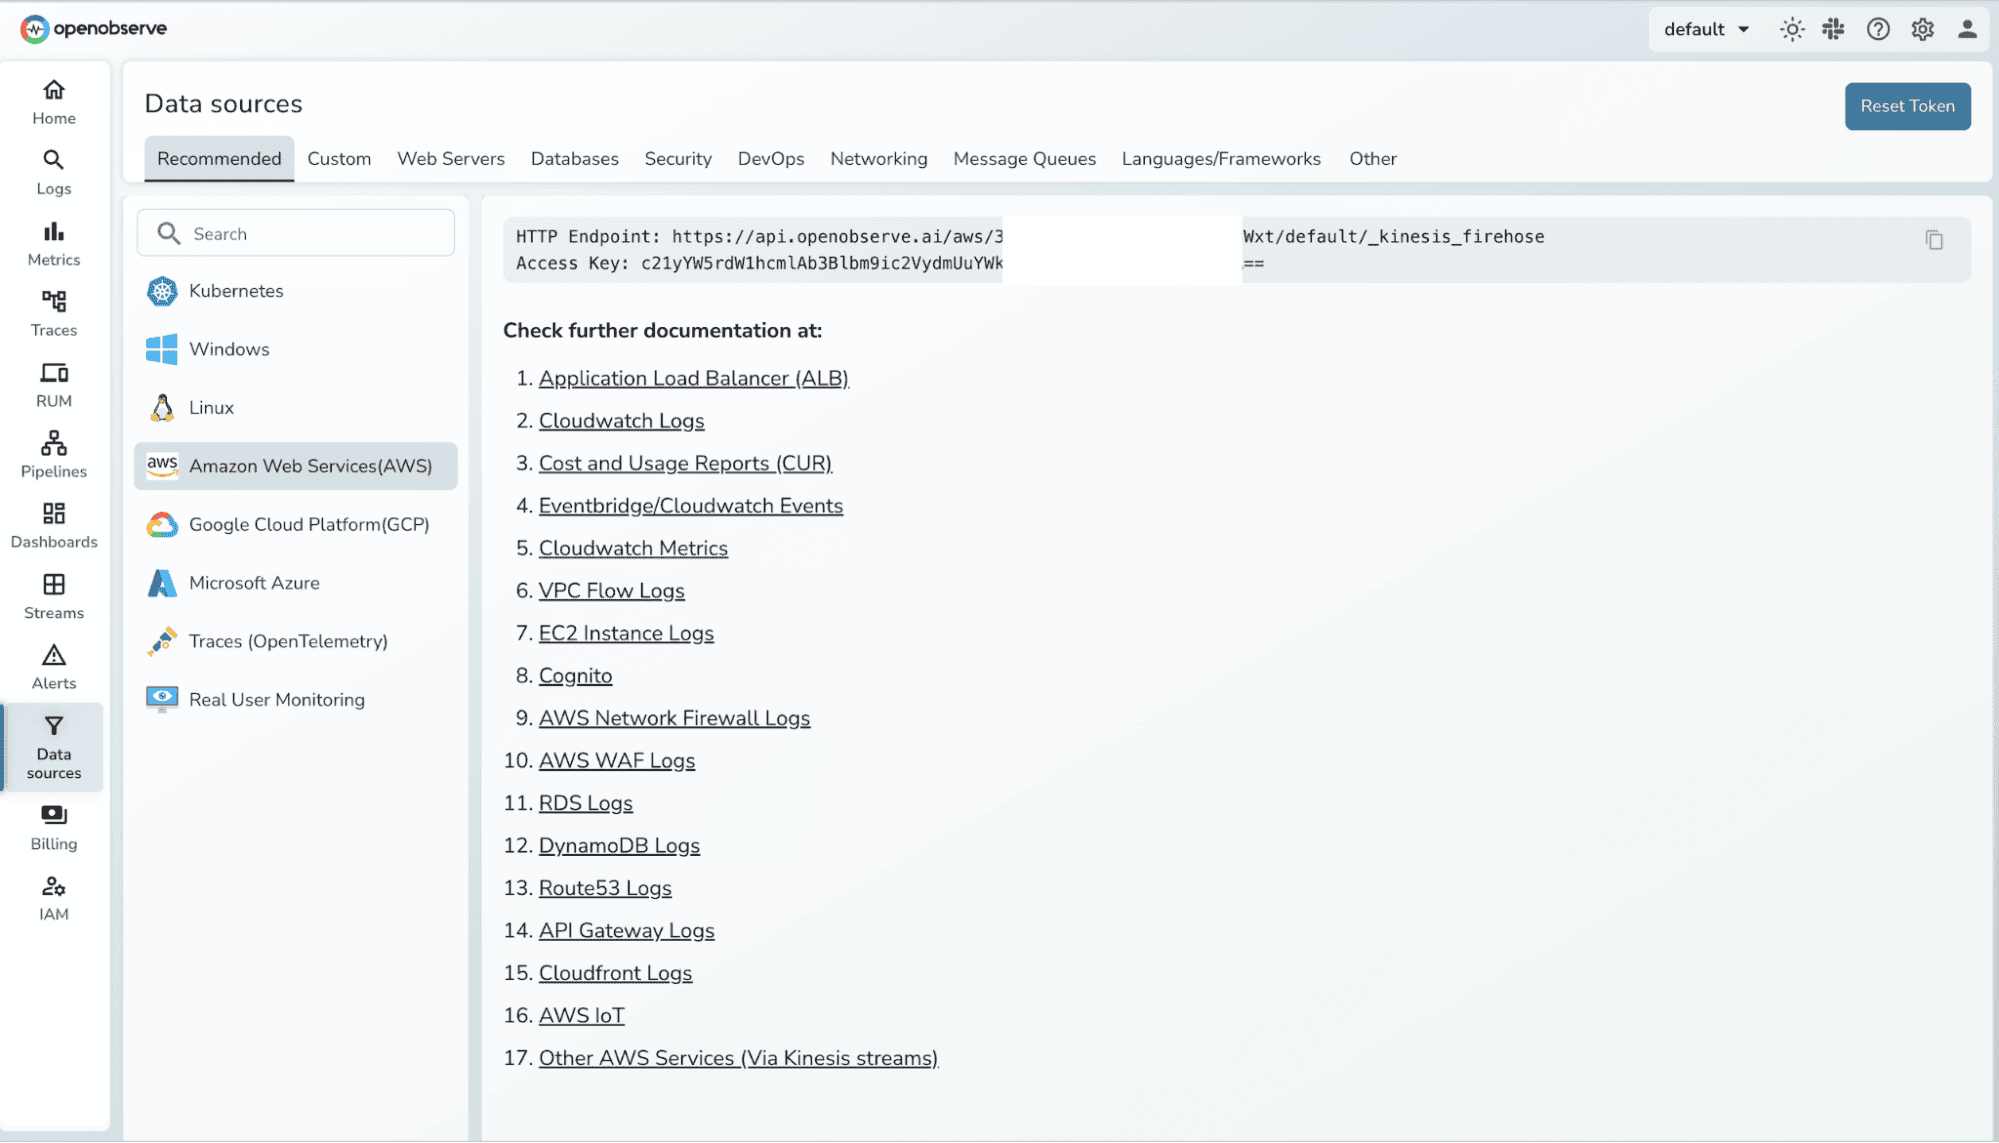
Example format:
https://<your-openobserve-domain>/aws/default/<stream-name>/_kinesis_firehose
4. Configure Backup Settings
5. Finalize Firehose Stream Setup
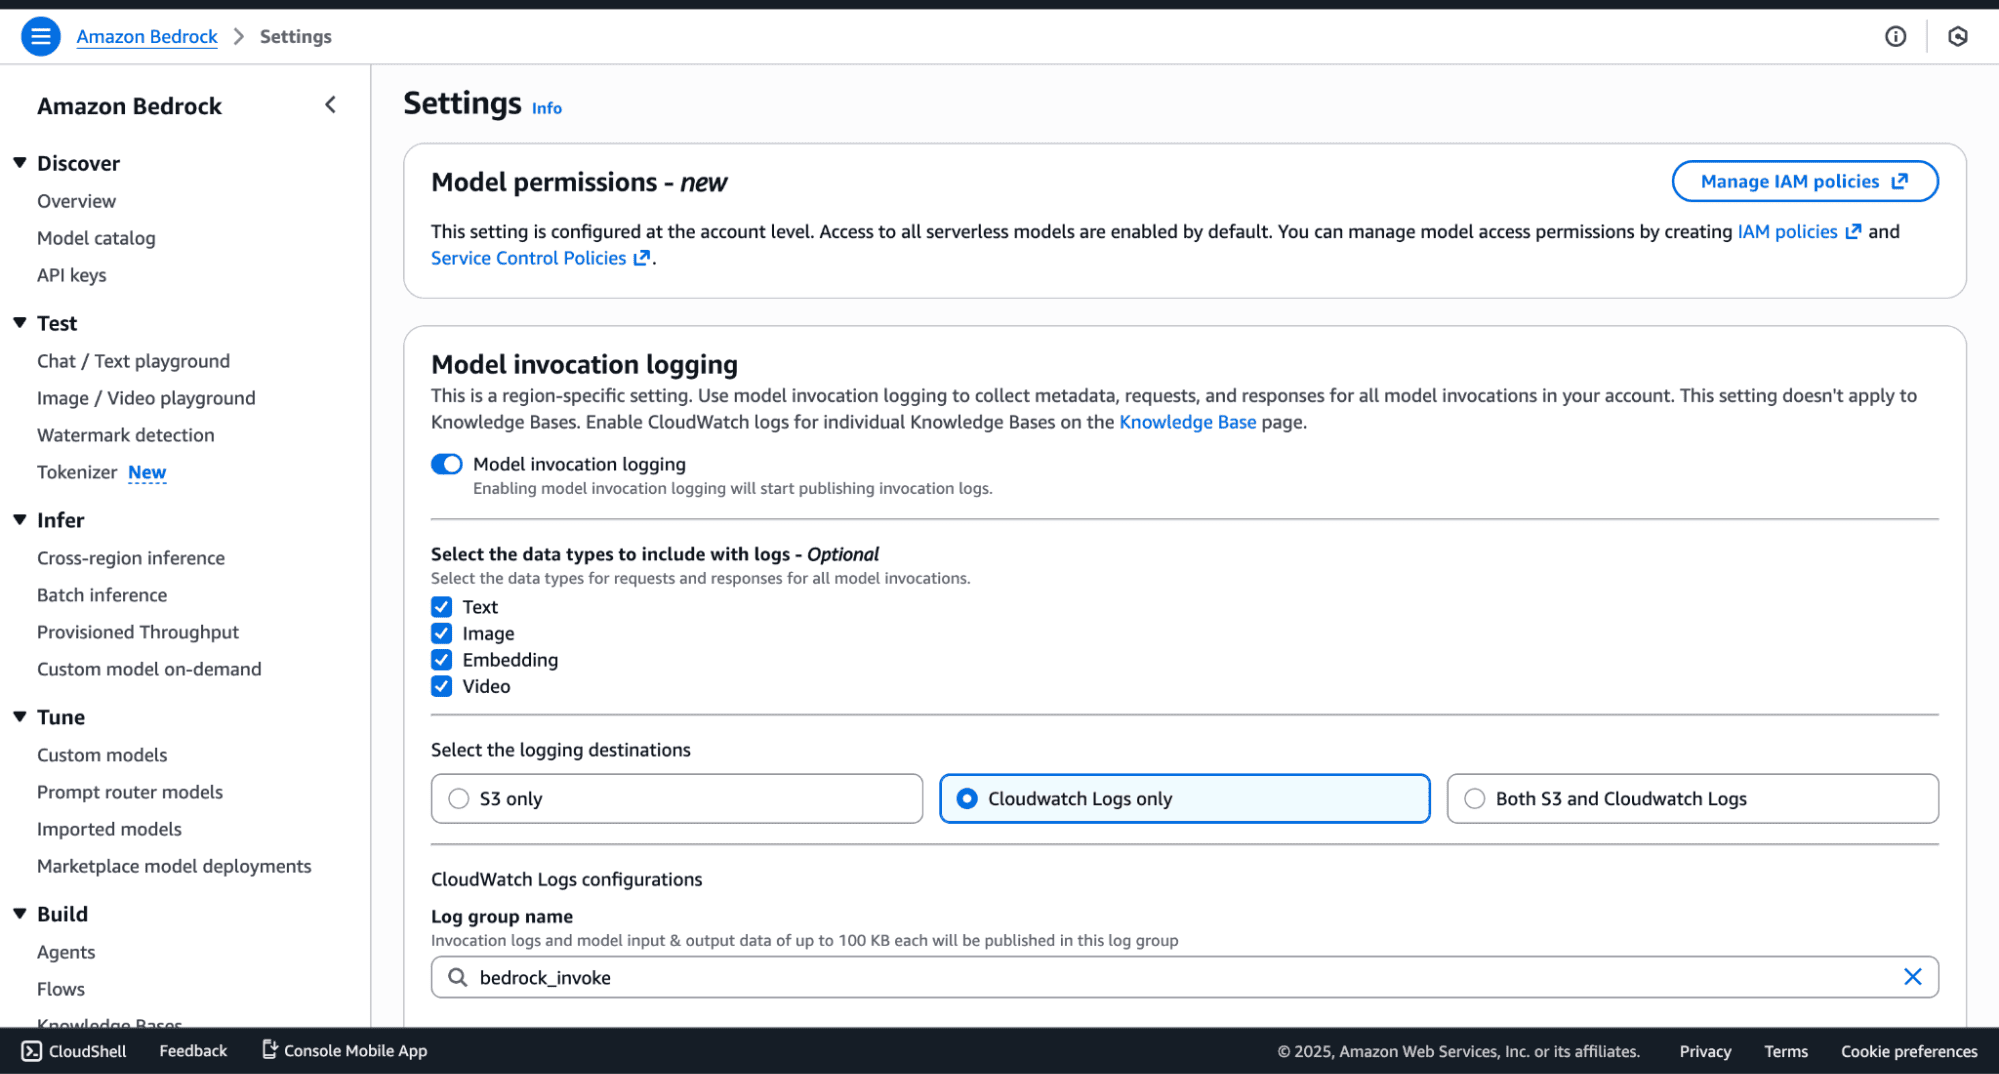
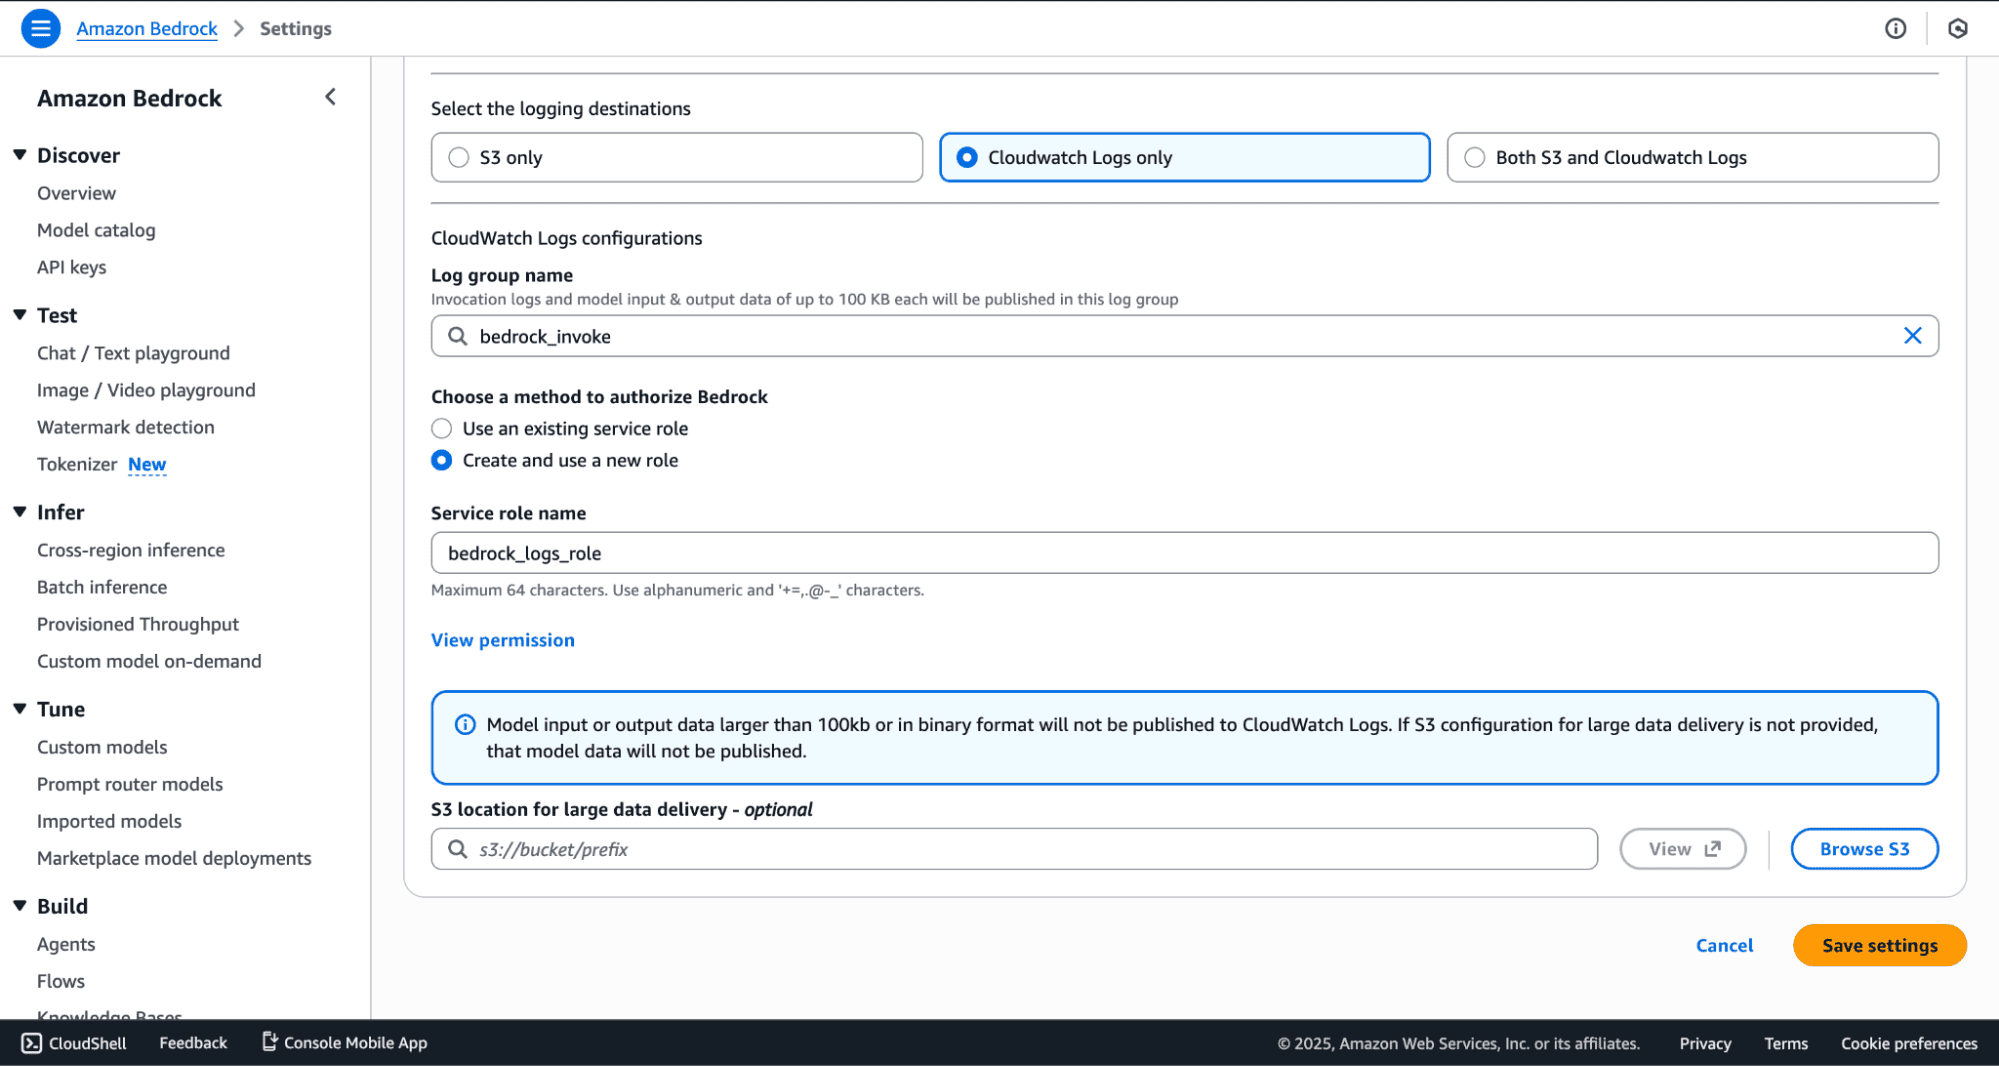
You can select the data types to include with logs, and also the destination. Sending data to S3 is recommended for backups.
2. Identify the Bedrock-specific Log Group created in CloudWatch. This is the log source you will stream into OpenObserve.
To capture Bedrock invocation logs:
 4. Select the same delivery stream you created earlier
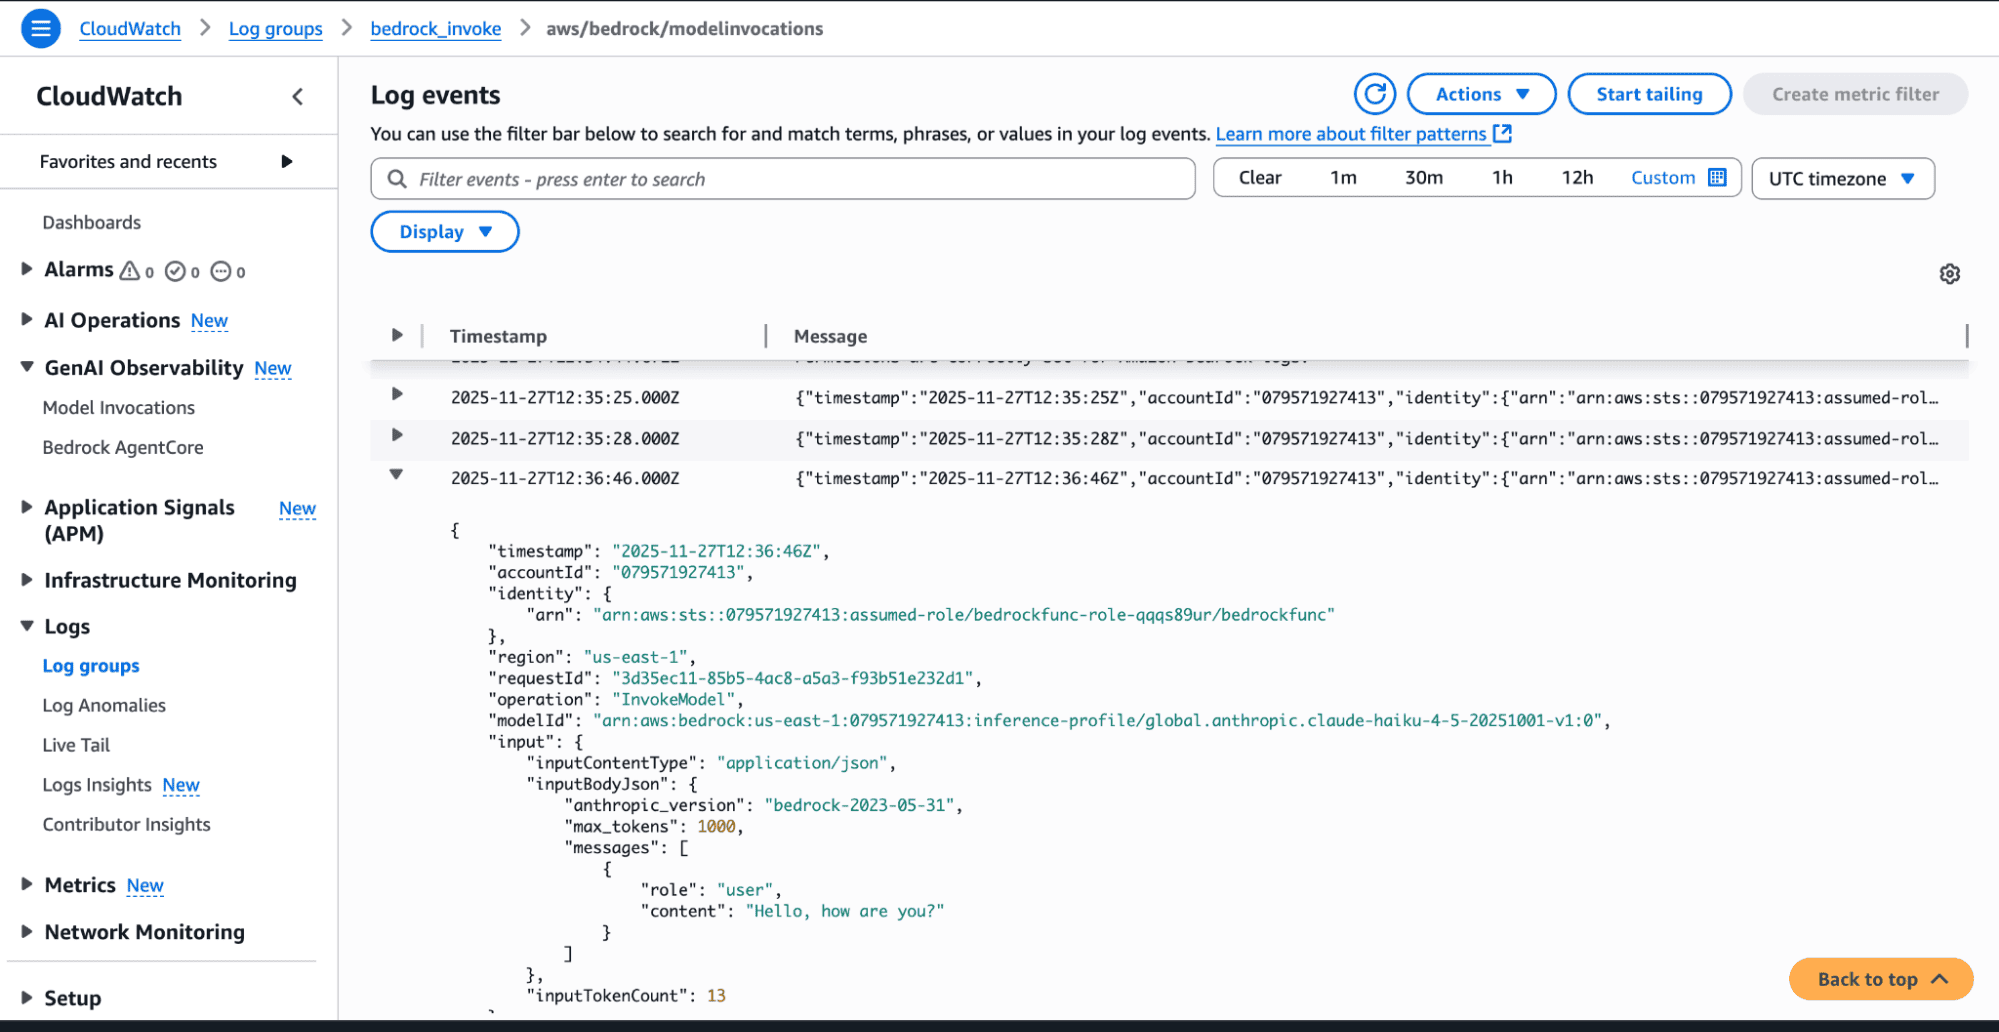
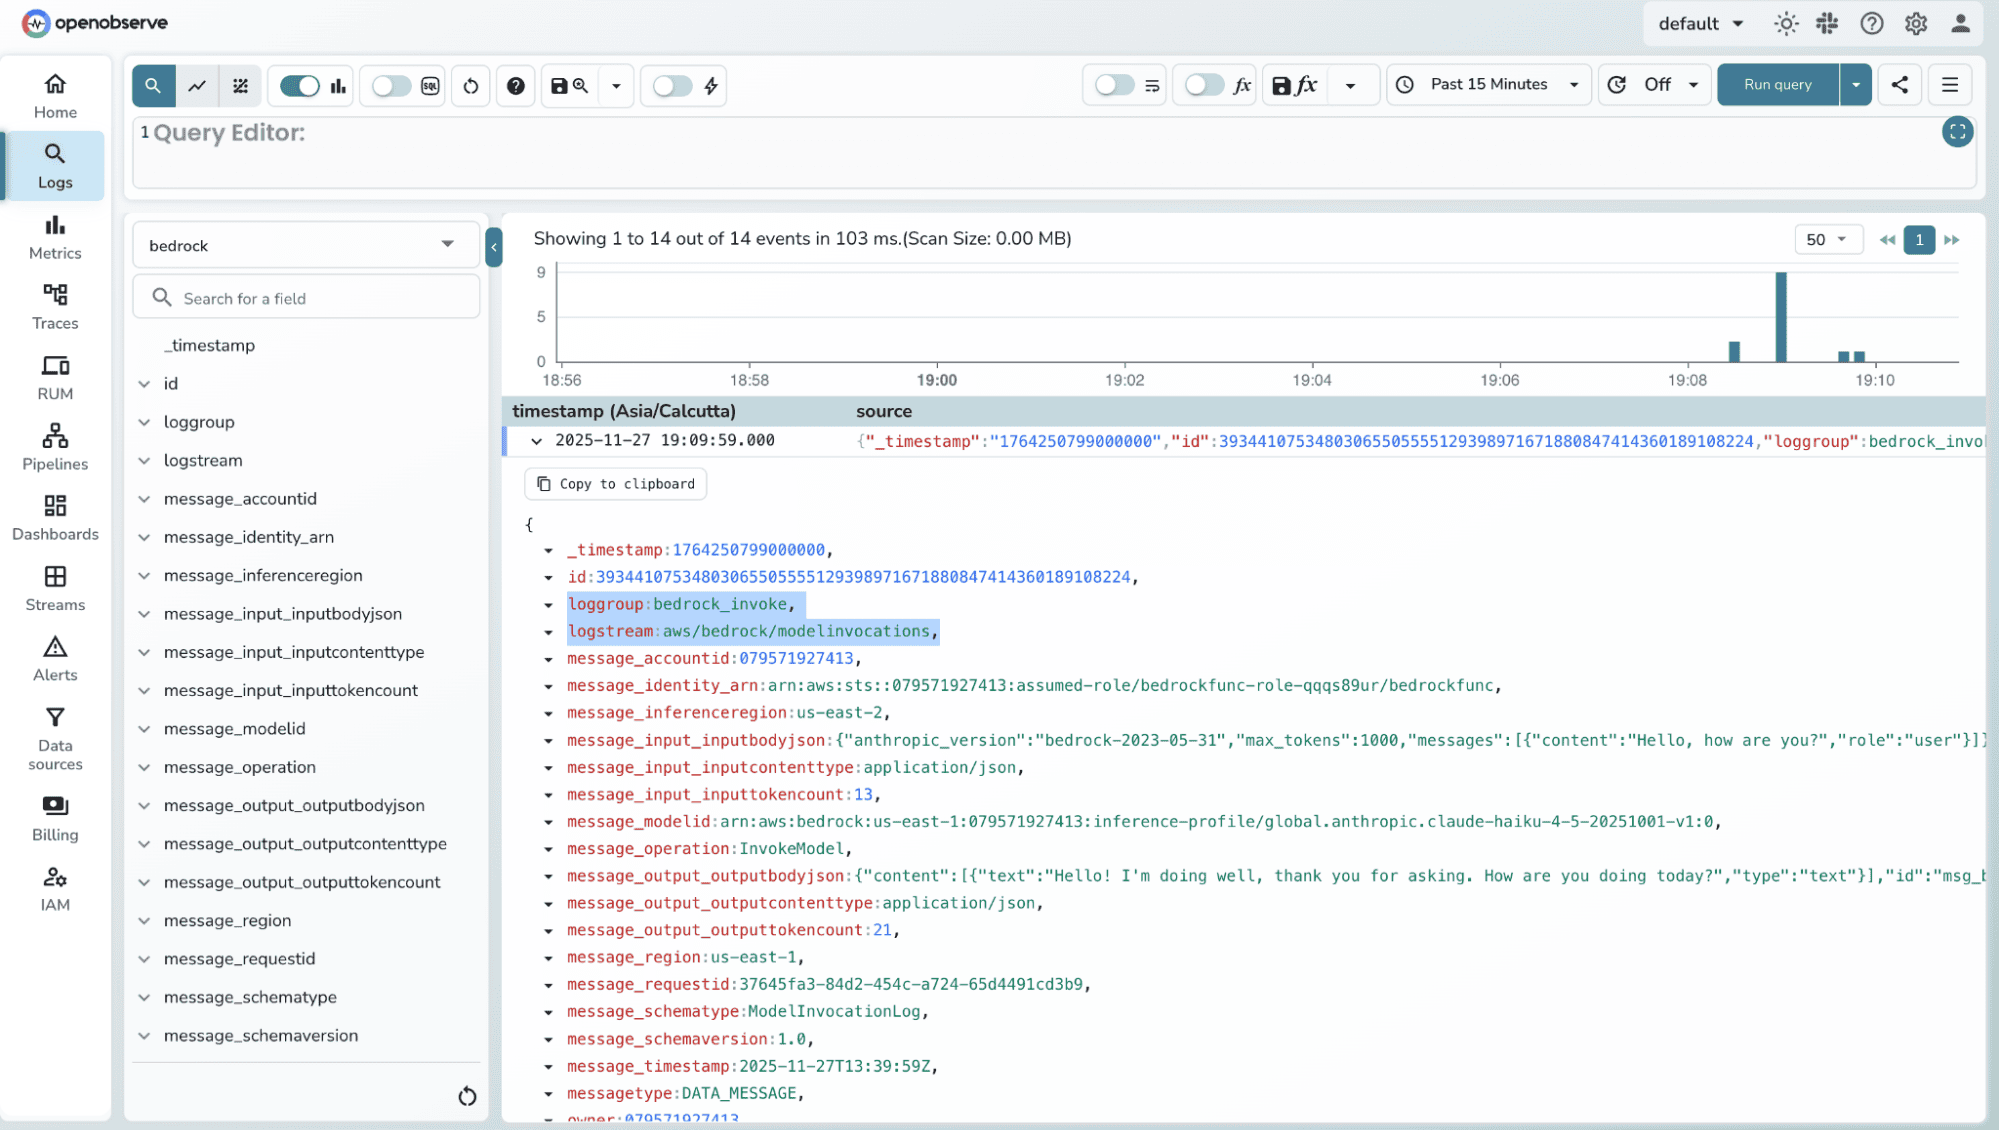
 Every log line, including structured model invocation logs will now flow into OpenObserve.
AWS automatically emits metrics like:
These metrics do not need to be "turned on." They simply exist. What you need to configure is how to export them.
Metric Streams are the cleanest way to deliver metrics out of CloudWatch in near-real-time.
Inside CloudWatch, create a new Metric Stream. When choosing a destination, select Kinesis Data Firehose. This ensures metrics are continuously pushed rather than pulled.

Select the AWS/Bedrock namespace. Include all the metrics you want to export.
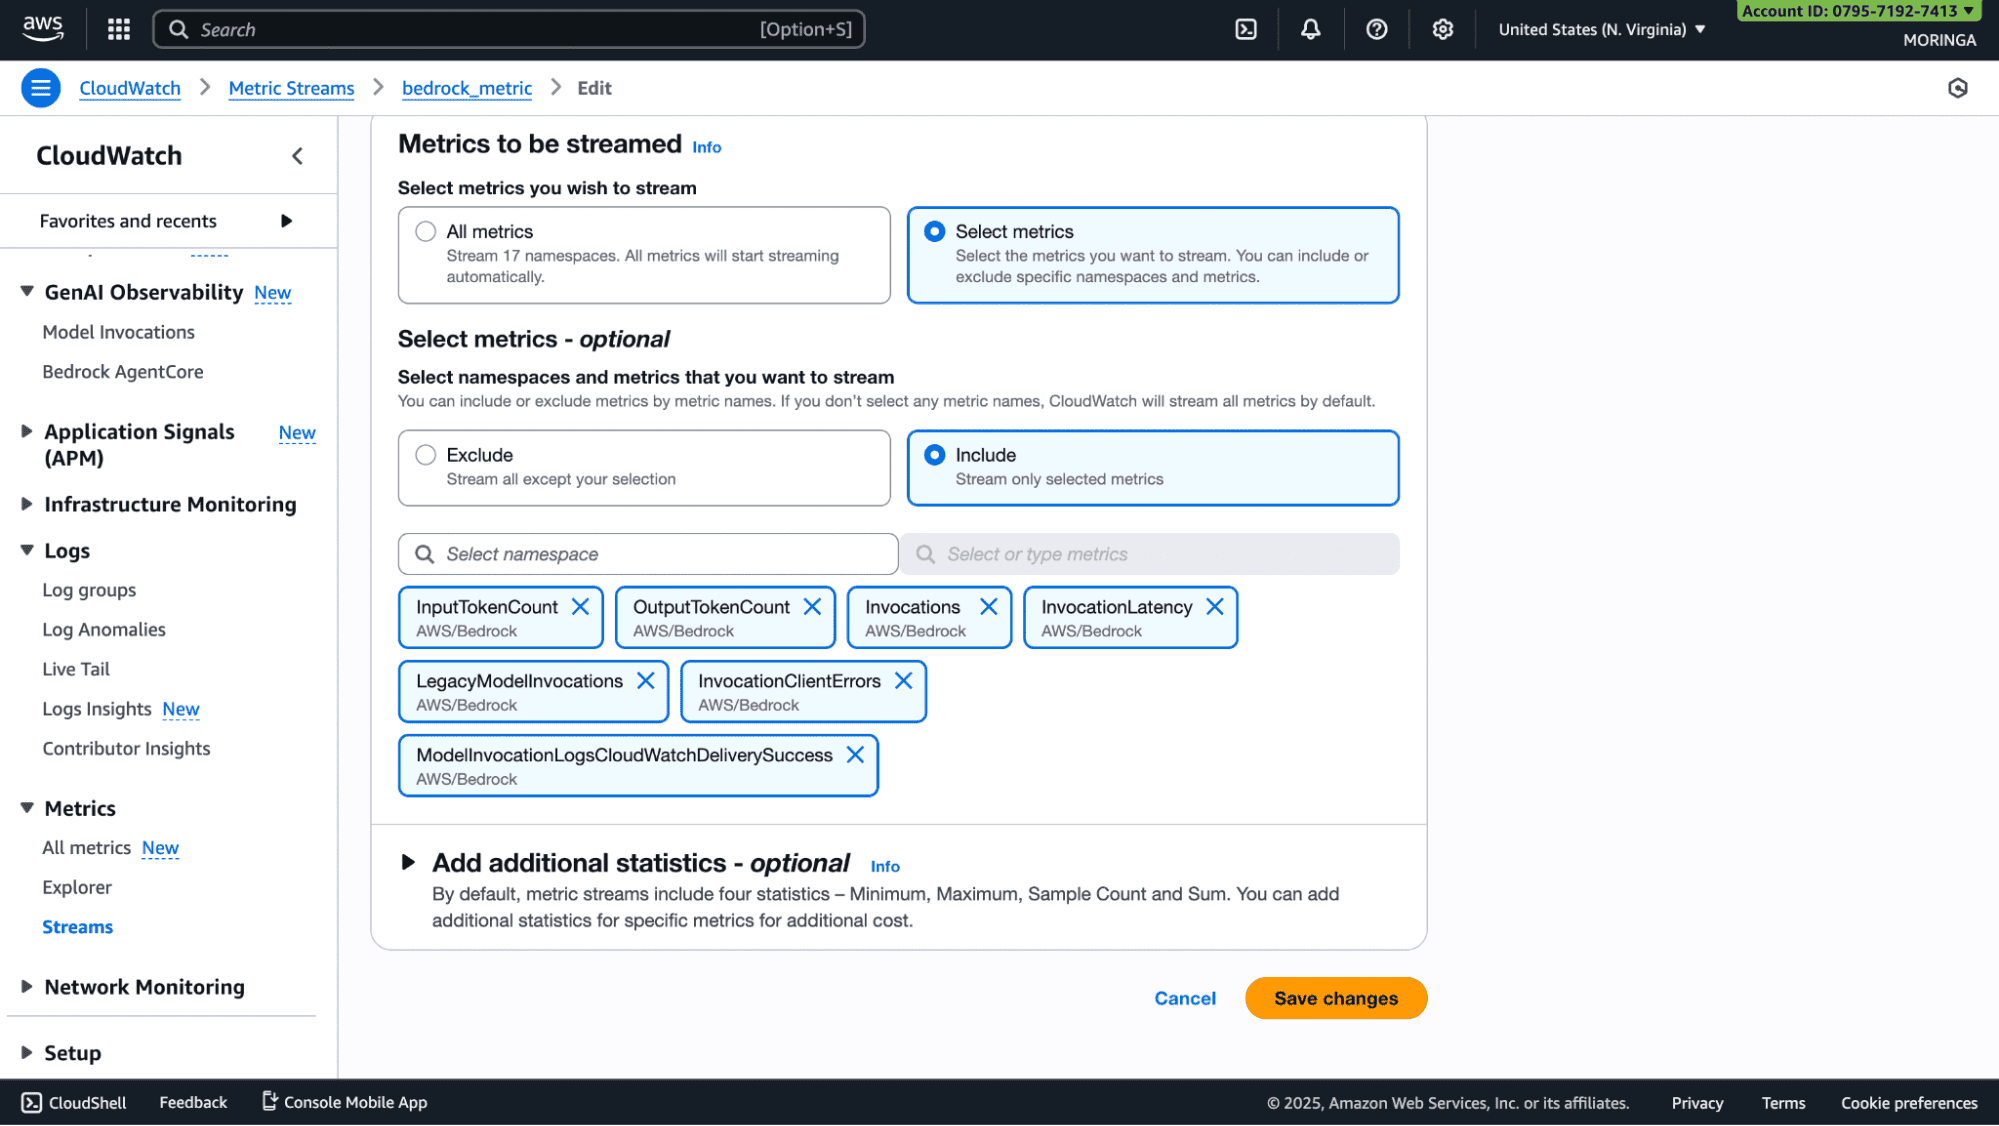
Once selected, you will attach this stream to the Firehose delivery stream you created.
To test out the flow, invoke the function using the bedrock models.
2. You can check for metrics records in the corresponding stream.
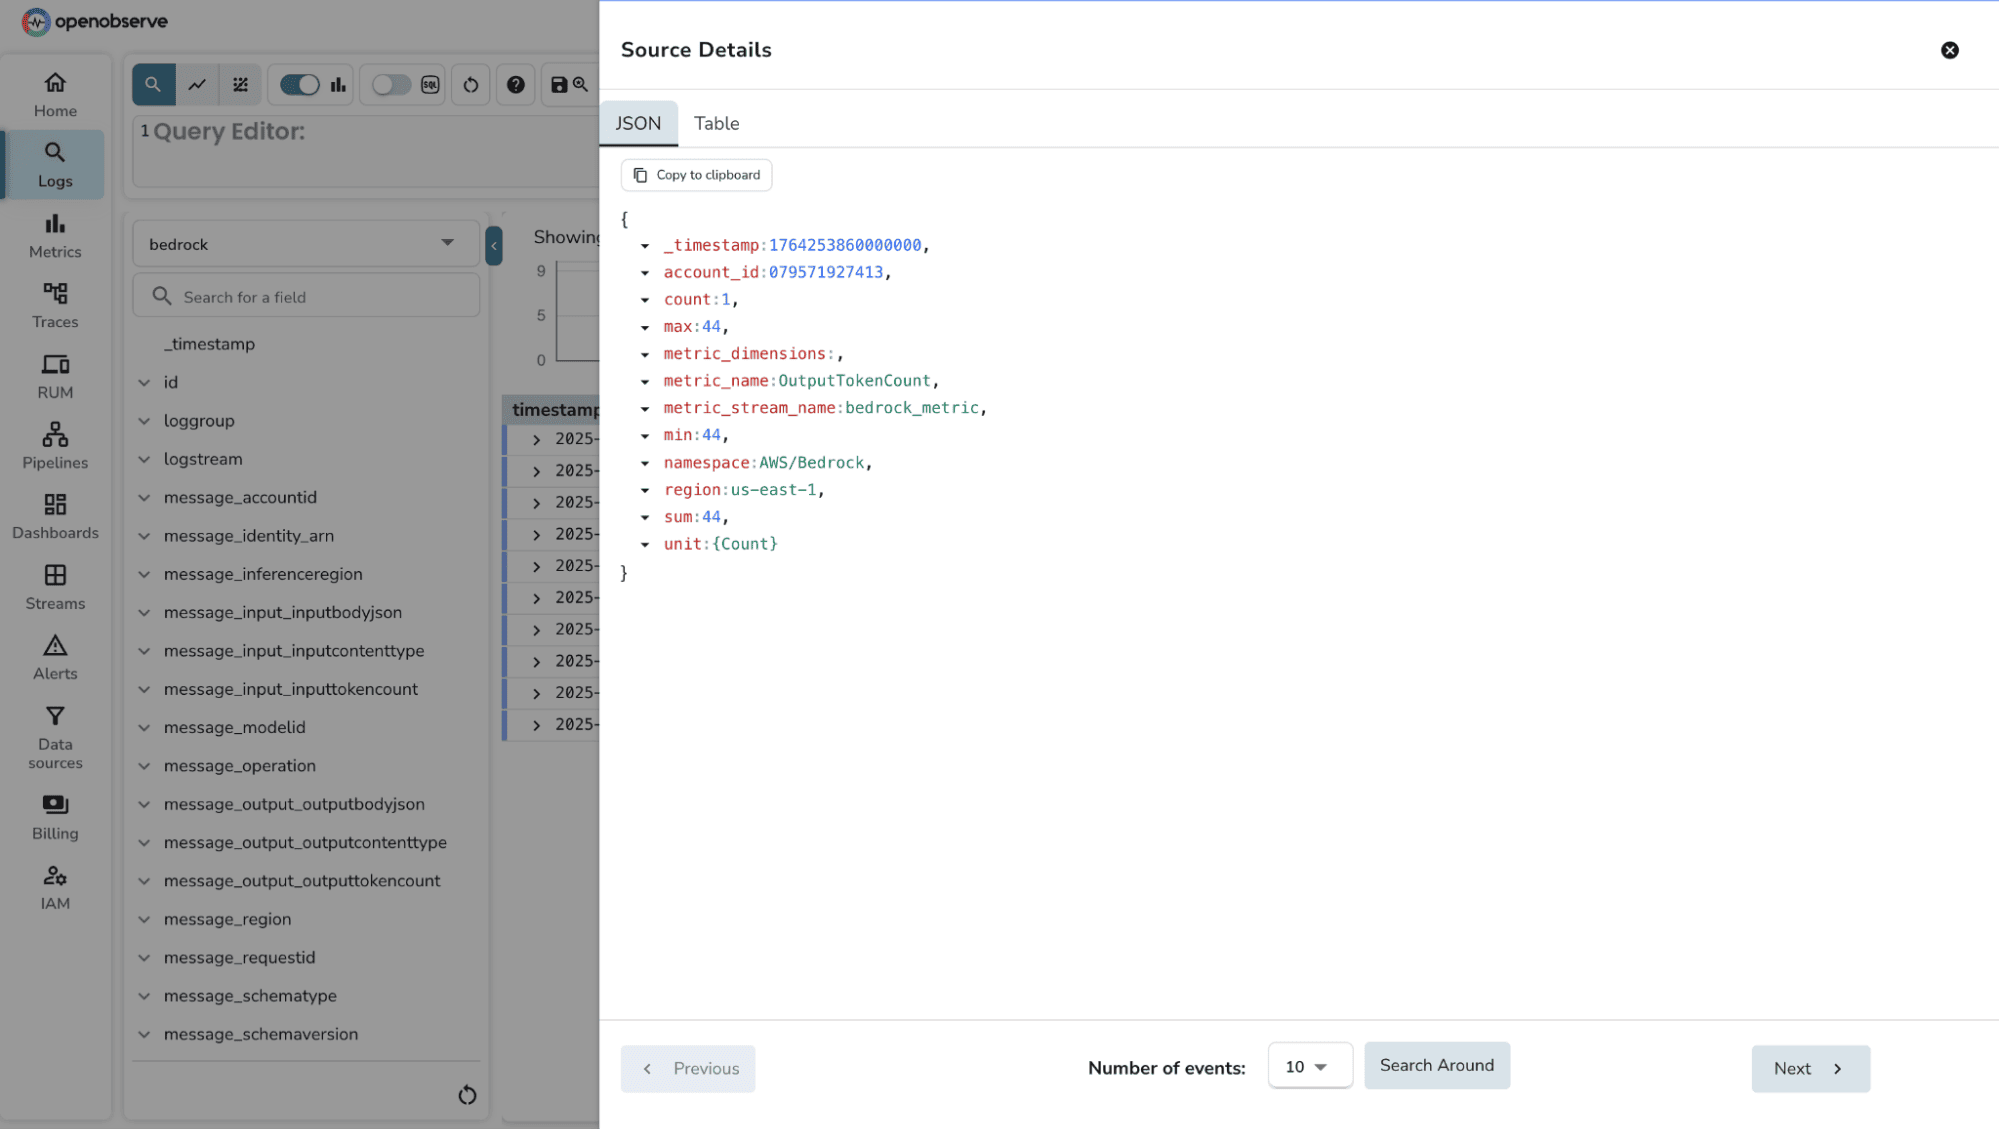
When you enable a CloudWatch Metric Stream for the AWS/Bedrock namespace, the following metrics become available for export into OpenObserve. These metrics give you direct visibility into invocation performance, error trends, and cost-related token usage.
| Metric Name | Unit | Description |
| Invocations | SampleCount | Number of successful requests to Converse, ConverseStream, InvokeModel, and InvokeModelWithResponseStream.
|
| InvocationLatency | Milliseconds | Total latency of each invocation. Useful for building p50, p90, and p99 latency dashboards. |
| InvocationClientErrors | SampleCount | Count of invocation attempts that resulted in client-side errors (4xx). |
| InvocationServerErrors | SampleCount | Count of invocation attempts that resulted in AWS server-side errors (5xx). |
| InvocationThrottles | SampleCount | Number of requests that were throttled by the service. These do not count toward successful Invocations or Errors. |
| InputTokenCount | SampleCount | Number of tokens present in the input prompt. Useful for cost and performance analysis. |
| LegacyModelInvocations | SampleCount | Number of invocations made using legacy Bedrock models. |
Monitoring AWS Bedrock through CloudWatch, Metric Streams, and Firehose works reliably, but there are a few practical considerations worth keeping in mind. These will help you design dashboards and alerts that are accurate, cost-efficient, and meaningful.
1. Bedrock logs do not include token-level breakdowns by default
While CloudWatch logs contain invocation metadata, they don’t always expose detailed token statistics (prompt tokens, output tokens, billed tokens) for every model. If token-level cost attribution is important, you may need to compute or extract these values separately inside your application.
2. Metric Streams provide aggregate metrics, not per-request detail
Metrics such as InvocationLatency or ModelErrors arrive as aggregated CloudWatch datapoints. They don’t map directly to individual invocation logs. For full correlation, you will rely more on logs than metric streams.
3. Bedrock logging must be explicitly enabled
If logging isn’t turned on, CloudWatch will remain empty and you’ll see no data flowing into OpenObserve. This is a common initial setup issue.
4. CloudWatch Log Groups can fragment across regions
If your organization invokes Bedrock models across multiple AWS regions, every region will generate its own log group and its own metrics. You must create log subscriptions and metric streams individually per region.
5. Some Bedrock models emit different telemetry structures
Anthropic, Meta, Amazon Titan, and custom model providers may expose logs that differ slightly in schema. You may need light VRL mapping in OpenObserve to normalize fields for dashboards.
Monitoring AWS Bedrock isn’t just about watching invocation counts or latency spikes, it’s about understanding how your application interacts with foundation models in real time. By streaming Bedrock’s metrics and logs into OpenObserve, you gain a single place to analyze performance, identify error patterns, catch throttling issues, and track token consumption with full transparency.
Pairing this with structured logging in your Lambda, dashboards that highlight the right KPIs, and alerts tuned to real performance thresholds gives you a complete operational view of your AI workloads. As your Bedrock usage grows, OpenObserve scales with you helping you stay ahead of latency issues, unexpected cost jumps, and reliability regressions.
Now that Bedrock logs and metrics are flowing into OpenObserve, the final piece is enabling teams to act on the data. Here are a few practical next steps that help you move from raw ingestion to real operational observability:
Q: Does logging add latency to my Bedrock invocations?
No. CloudWatch logging happens asynchronously after your Bedrock API call completes. The logging process does not block or slow down your model invocation. Your Lambda function returns immediately after receiving the Bedrock response. However, ensure your Lambda execution role has proper permissions to avoid authorization delays.
Q: Can I monitor Bedrock across multiple AWS regions?
Yes, but each AWS region requires separate configuration. Every region generates its own CloudWatch Log Groups and emits its own metrics. You'll need to create individual Kinesis Firehose delivery streams and CloudWatch Metric Streams per region. In OpenObserve, you can create region-specific streams (e.g., bedrock-logs-us-east-1, bedrock-logs-eu-west-1) or use a single stream with region tags for unified dashboards.
Q: What's the difference between Bedrock logs and Bedrock metrics?
Logs contain detailed, event-level data for each model invocation including request IDs, model names, input/output token counts, and error messages. Metrics provide aggregated statistics like total invocation count, average latency, and error rates over time intervals. Use logs for debugging specific failures and metrics for monitoring overall system health and trends.
Q: Do I need to enable Bedrock logging manually?
Yes. AWS Bedrock logging is disabled by default. You must explicitly enable it through the AWS Bedrock console under "Settings → Model invocation logging." Choose which data types to capture (text, image, embeddings) and select CloudWatch Logs as the destination. Without this step, no invocation logs will be generated.
Q: Which Bedrock models are supported for monitoring?
All foundation models available in AWS Bedrock emit metrics and logs when invocation logging is enabled. This includes Anthropic Claude models, Amazon Titan, Meta Llama, Cohere, AI21 Labs, and Stability AI models. However, log schemas may vary slightly between providers for example, token count fields might have different names depending on the model family.
Q: Can I monitor token usage to track Bedrock costs?
Yes. Bedrock emits InputTokenCount and OutputTokenCount metrics through CloudWatch. These appear in your metric stream and can be visualized in OpenObserve dashboards. To calculate costs, multiply token counts by your model's per-token pricing (available in AWS Bedrock pricing documentation). You can create alerts when token usage exceeds budget thresholds.
Q: What happens if my Kinesis Firehose delivery fails?
Failed records are automatically backed up to the S3 bucket you configured during Firehose setup. Firehose retries delivery for up to 24 hours before moving data to S3. You can monitor delivery failures through CloudWatch metrics like DeliveryToHttpEndpoint.Success and DeliveryToS3.Success. Set up alerts in OpenObserve or CloudWatch to notify you of persistent delivery issues.
Q: Can I use this setup with Bedrock Agents or Knowledge Bases?
Yes. Bedrock Agents and Knowledge Bases generate their own CloudWatch logs in separate log groups (e.g., /aws/bedrock/agents/). You can create additional subscription filters for these log groups pointing to the same Firehose stream. Agent invocations also emit metrics under the AWS/Bedrock namespace, which your existing Metric Stream will capture.
Q: Can I filter which Bedrock invocations get logged?
Not directly through Bedrock's native logging. All invocations are logged once you enable the feature. However, you can use CloudWatch Logs subscription filter patterns to selectively forward only certain log events to Firehose. For example, filter only errors or specific model names. Alternatively, use OpenObserve's VRL (Vector Remap Language) to drop unwanted logs during ingestion.
Passionate about observability, AI systems, and cloud-native tools. All in on DevOps and improving the developer experience.


