Retool has become a critical platform for building internal tools, serving thousands of enterprises worldwide. As these applications handle increasingly important business operations, implementing robust monitoring and observability becomes essential. This guide provides a comprehensive approach to error tracking and monitoring for Retool Enterprise applications.
Understanding Retool
What is Retool?
Retool is a low-code development platform designed for building internal tools and business applications. It provides a drag-and-drop interface for creating custom applications that connect to databases, APIs, and various data sources.
Key Features:
- Visual Development: Build UIs with pre-built components
- Data Integration: Connect to any database or API
- JavaScript Support: Write custom logic when needed
- Version Control: Git integration for collaboration
- Enterprise Security: Role-based access control and SSO
Retool Enterprise Benefits:
- Advanced permissions and audit logs
- Custom branding and white-labeling
- Dedicated support and SLAs
- Enhanced security features
- Workflow automation capabilities
Why Monitor Retool Applications
Critical Business Operations
Retool applications often handle:
- Customer data management
- Financial transactions
- Inventory control
- Order processing
- Employee workflows
Monitoring Requirements
Effective monitoring addresses:
- Error Detection: Catch failures before users report them
- Performance Tracking: Monitor query execution times
- Usage Analytics: Understand application adoption
- Security Auditing: Track unauthorized access attempts
- Compliance: Meet regulatory requirements
Impact of Poor Monitoring
Without proper monitoring:
- Errors go undetected until user complaints
- Performance degradation affects productivity
- Security incidents lack visibility
- Troubleshooting becomes time-consuming
- Business operations face unexpected disruptions
Monitoring Approaches Comparison
Approach 1: Native Retool Monitoring
Capabilities:
- Basic application logs
- User activity tracking
- Simple error reporting
- Query performance metrics
Limitations:
- Limited retention period
- Basic search functionality
- No custom alerting
- Limited visualization options
- No correlation across applications
Best For:
- Small teams
- Non-critical applications
- Basic troubleshooting needs
Approach 2: Custom Integration
Implementation Options:
- Webhook-based: Send errors to external endpoints
- API Integration: Use Retool's API for data extraction
- Log Aggregation: Collect logs from multiple sources
Challenges:
- Requires development effort
- Maintenance overhead
- Scaling complexities
- Limited out-of-box features
Approach 3: Using OpenObserve
Advantages:
- Real-time error processing
- Advanced data transformation
- Custom dashboards
- Flexible alerting
- Long-term data retention
- Cost-effective scaling
Key Features:
- VRL (Vector Remap Language) support
- Pre-built Retool dashboards
- Stream-based data processing
- Multi-tenant support
- Built-in data compression
Comparison Matrix
| Feature |
Native Retool |
Custom Integration |
OpenObserve |
| Real-time Processing |
Limited |
Depends |
✓ |
| Data Retention |
30 days |
Variable |
Unlimited |
| Custom Dashboards |
✗ |
Requires Dev |
✓ |
| Alert Configuration |
Basic |
Custom |
Advanced |
| Data Transformation |
✗ |
Manual |
VRL Support |
| Cost |
Included |
Development |
Open-source |
| Scalability |
Limited |
Variable |
High |
| Setup Complexity |
Low |
High |
Low |
Implementing OpenObserve helps developers to better track the issues and fix them right away instead of waiting for end users to notify them.
Implementation Guide for OpenObserve
Prerequisites
- Retool Enterprise subscription
- Administrative access to Retool
- OpenObserve account (or alternative platform)
- Basic understanding of REST APIs
Step 1: Enable Retool Error Reporting
This functionality requires Retool Enterprise.
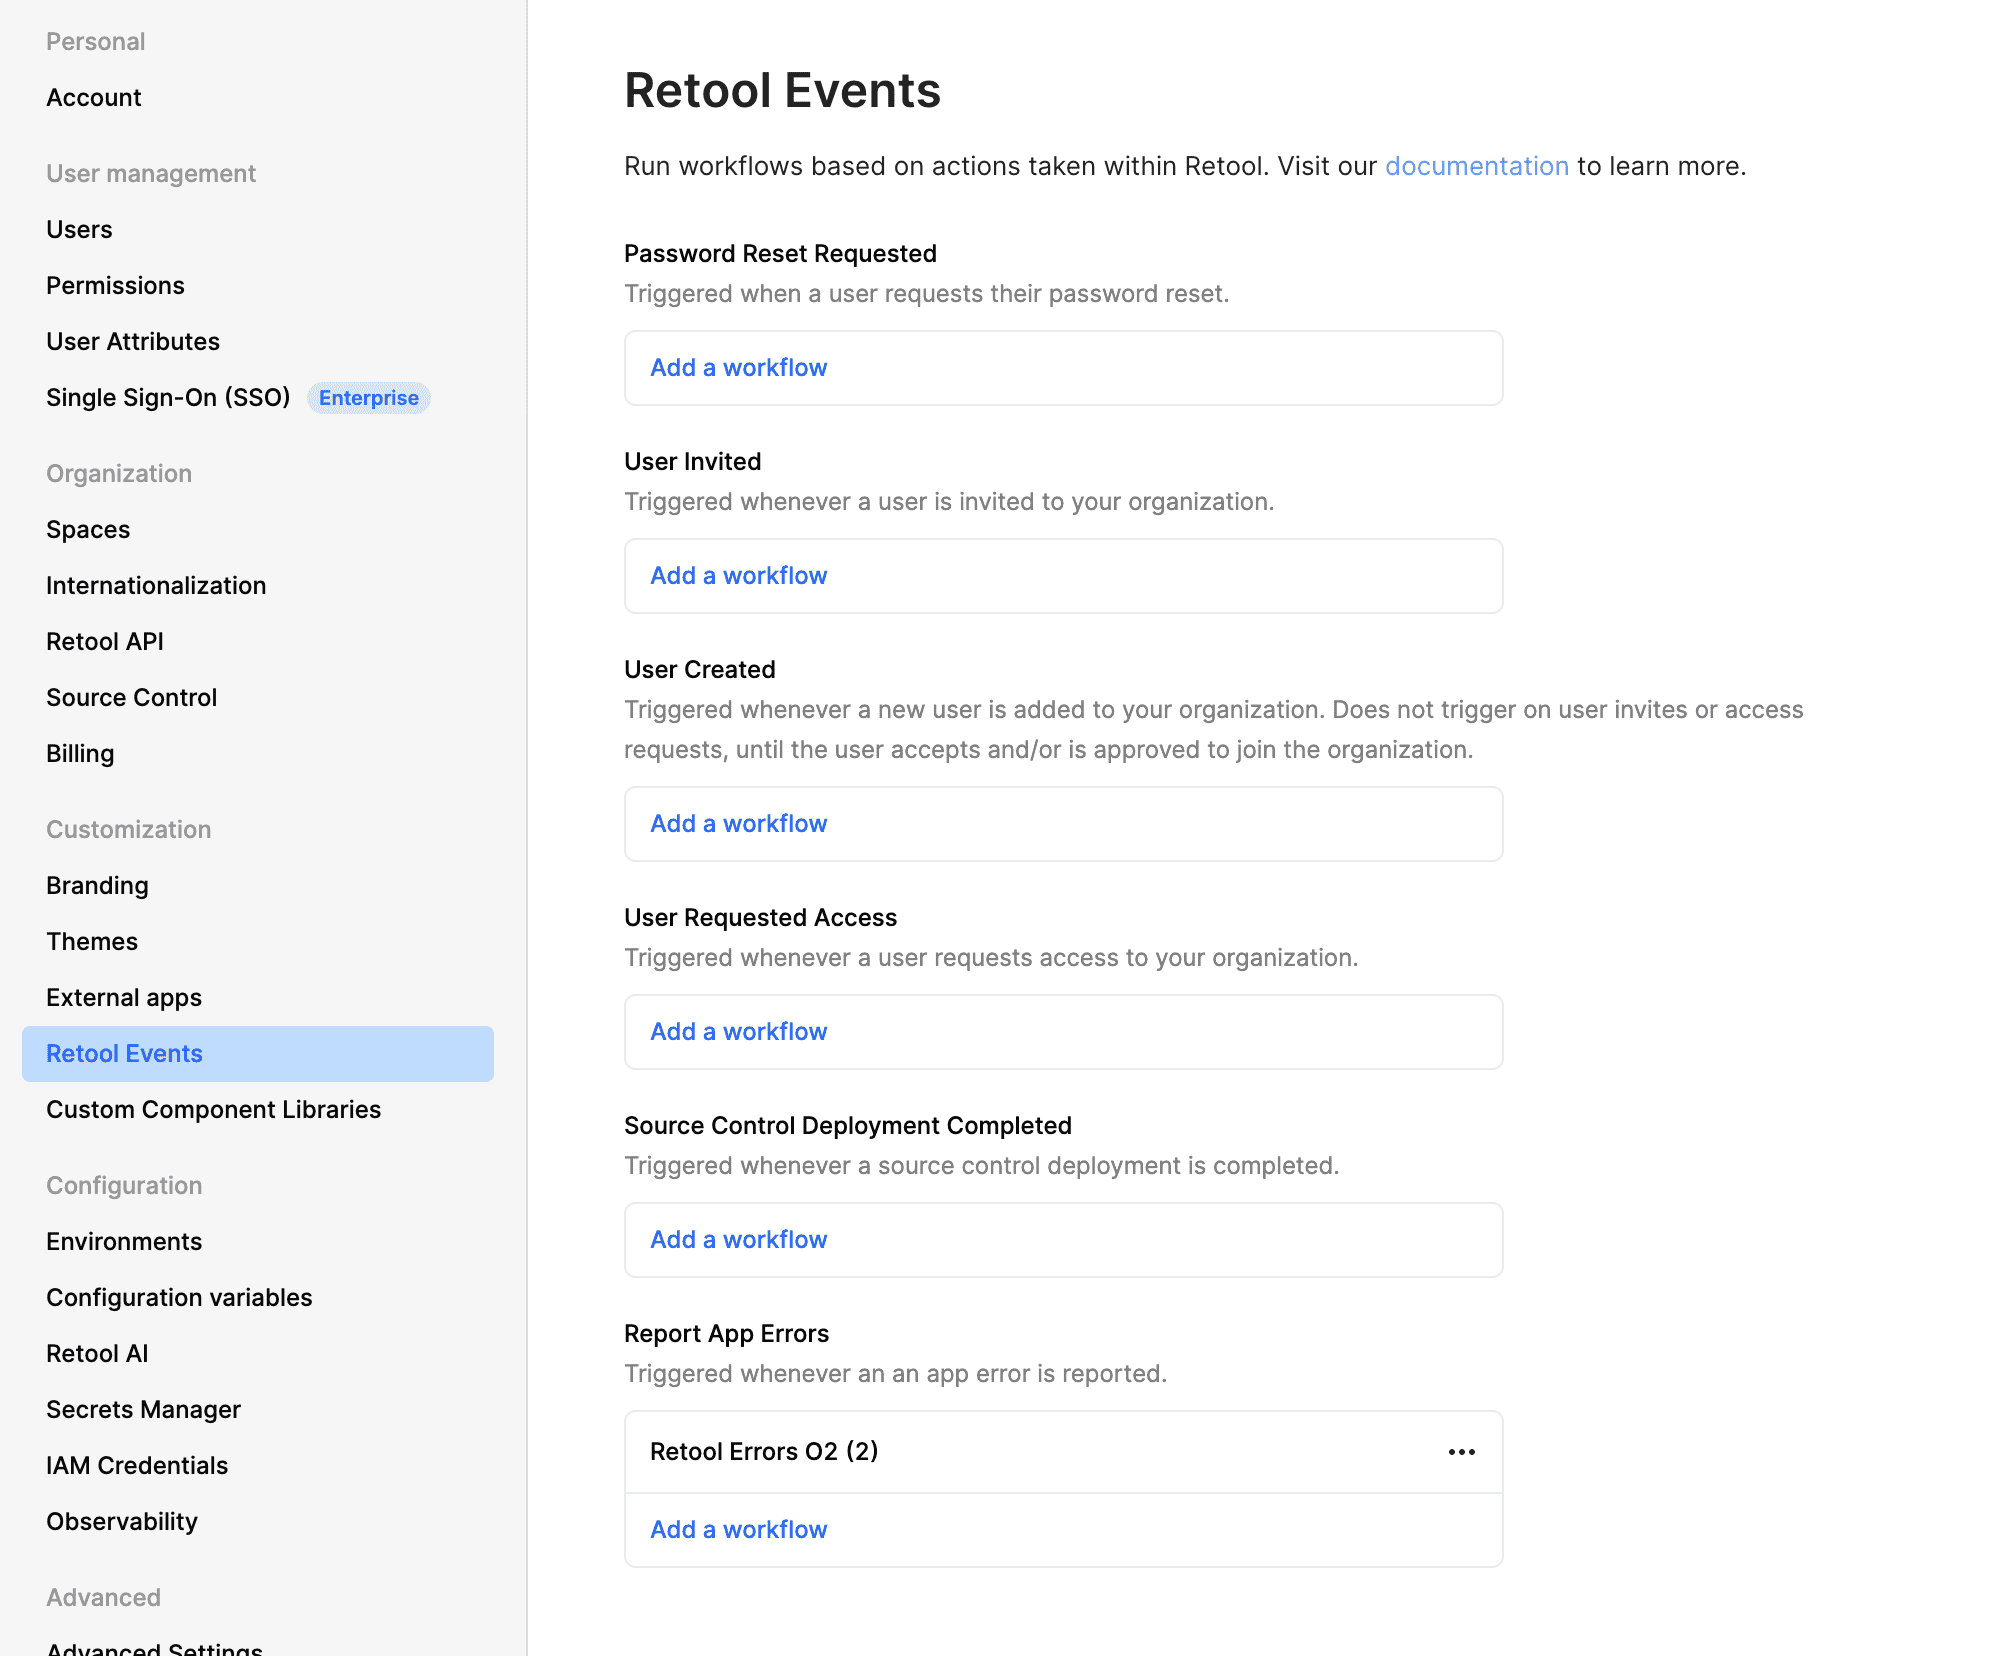
- Access your Retool admin panel
- Navigate to Settings → Retool Events
- Enable Report App Errors
- Save configuration
Step 2: Download and Import Workflow
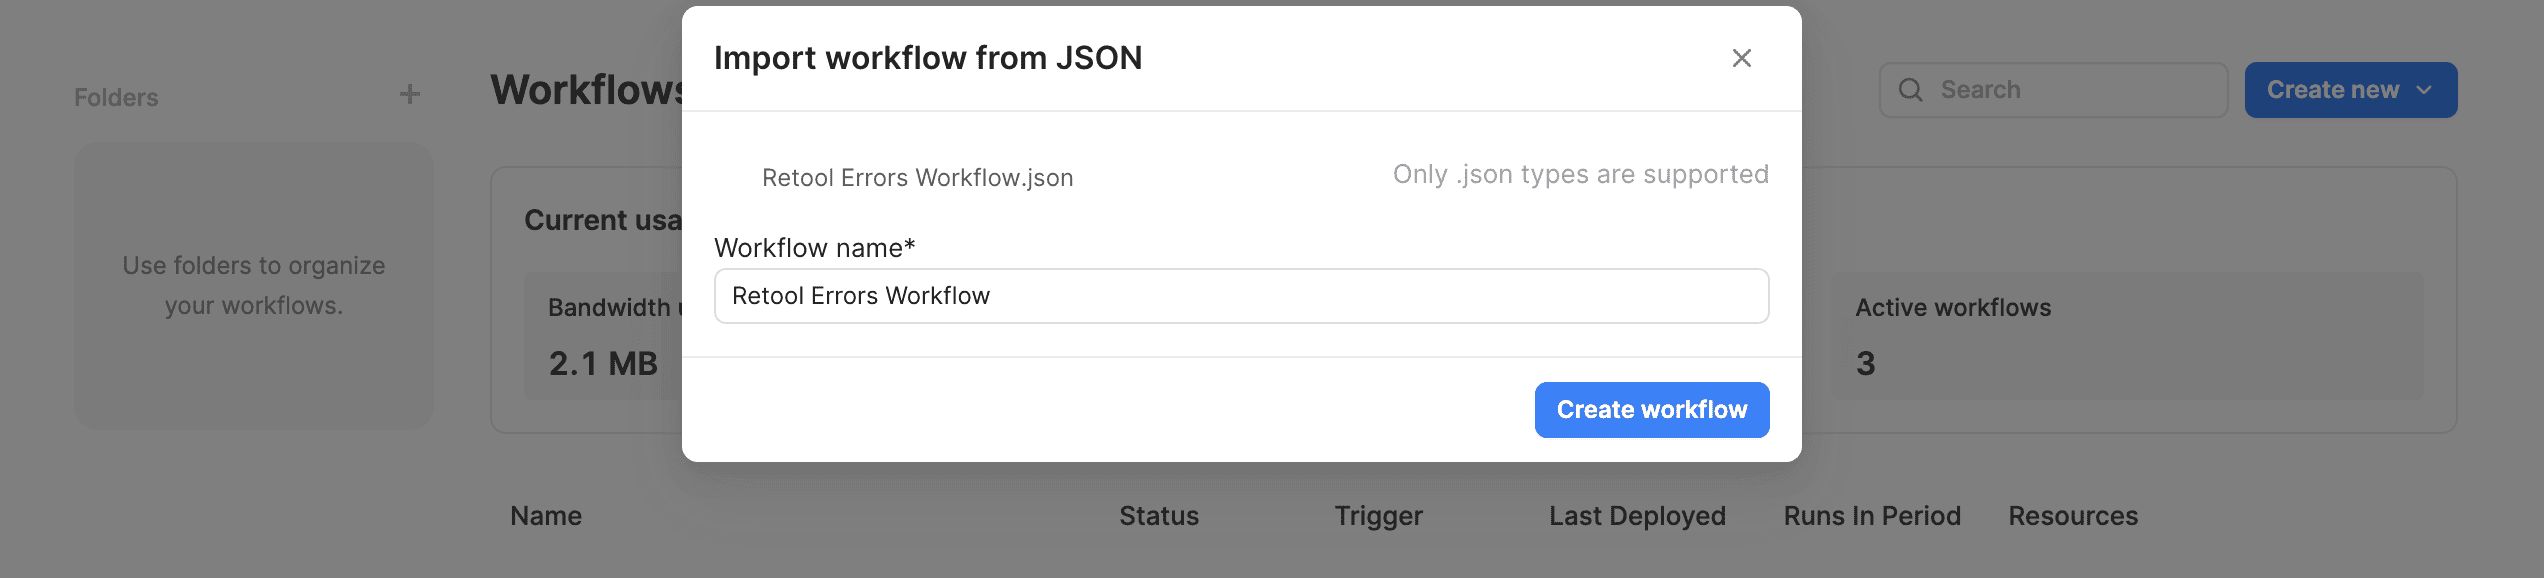 Retool Errors Workflow.json
- Download the monitoring workflow JSON
- Open Retool Workflows
- Click Import Workflow
- Upload the JSON file
- Review imported components
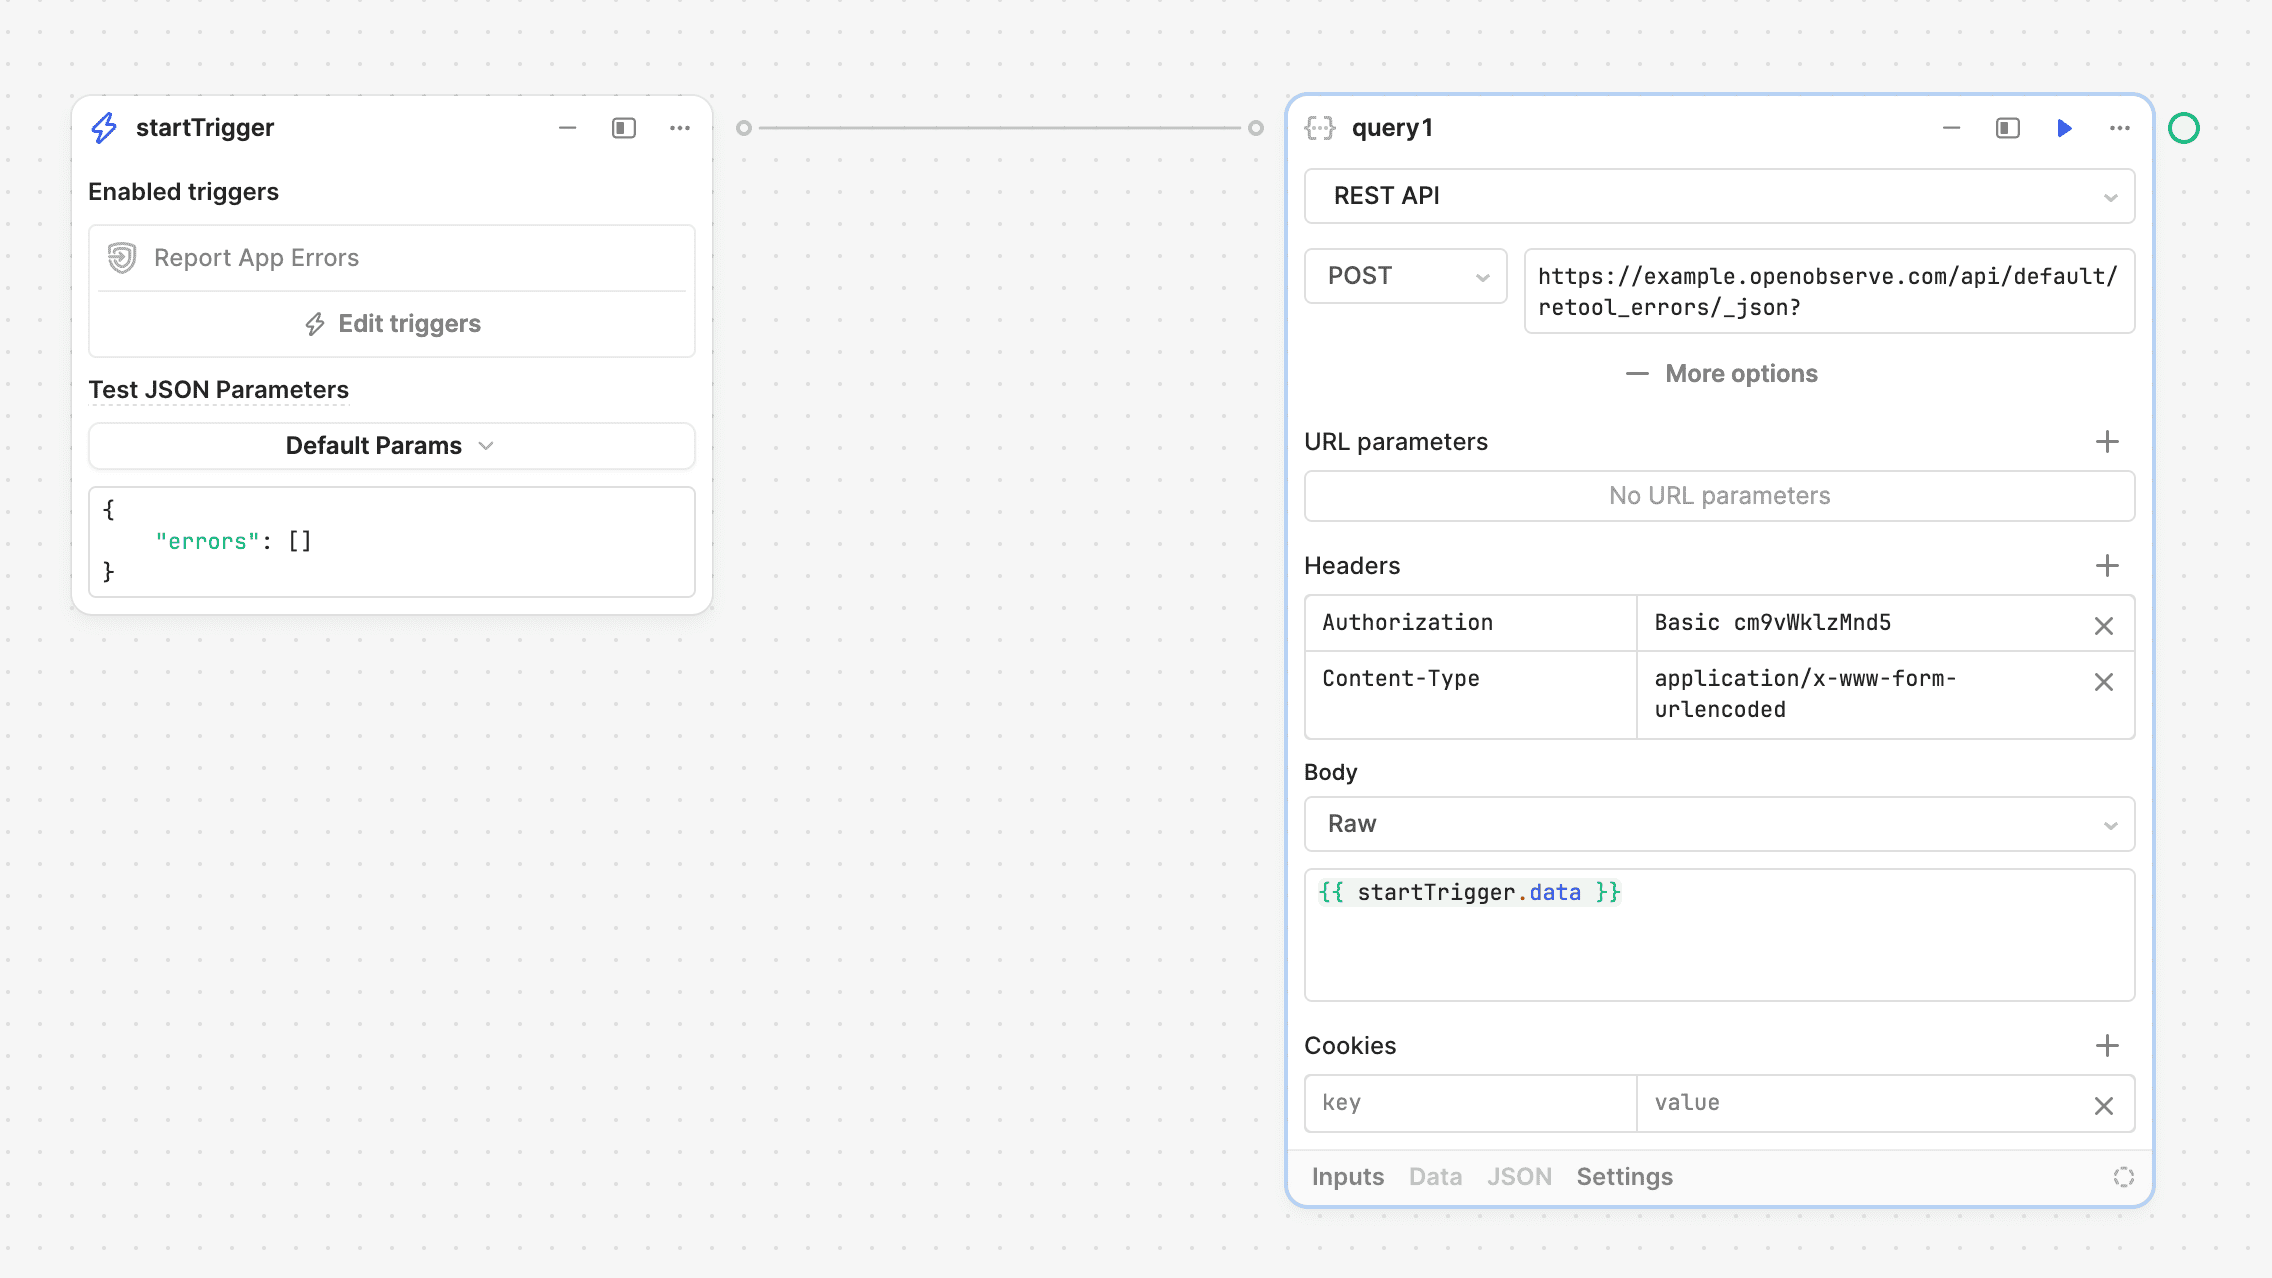
Step 3: Configure OpenObserve Integration
Update the workflow with OpenObserve details:
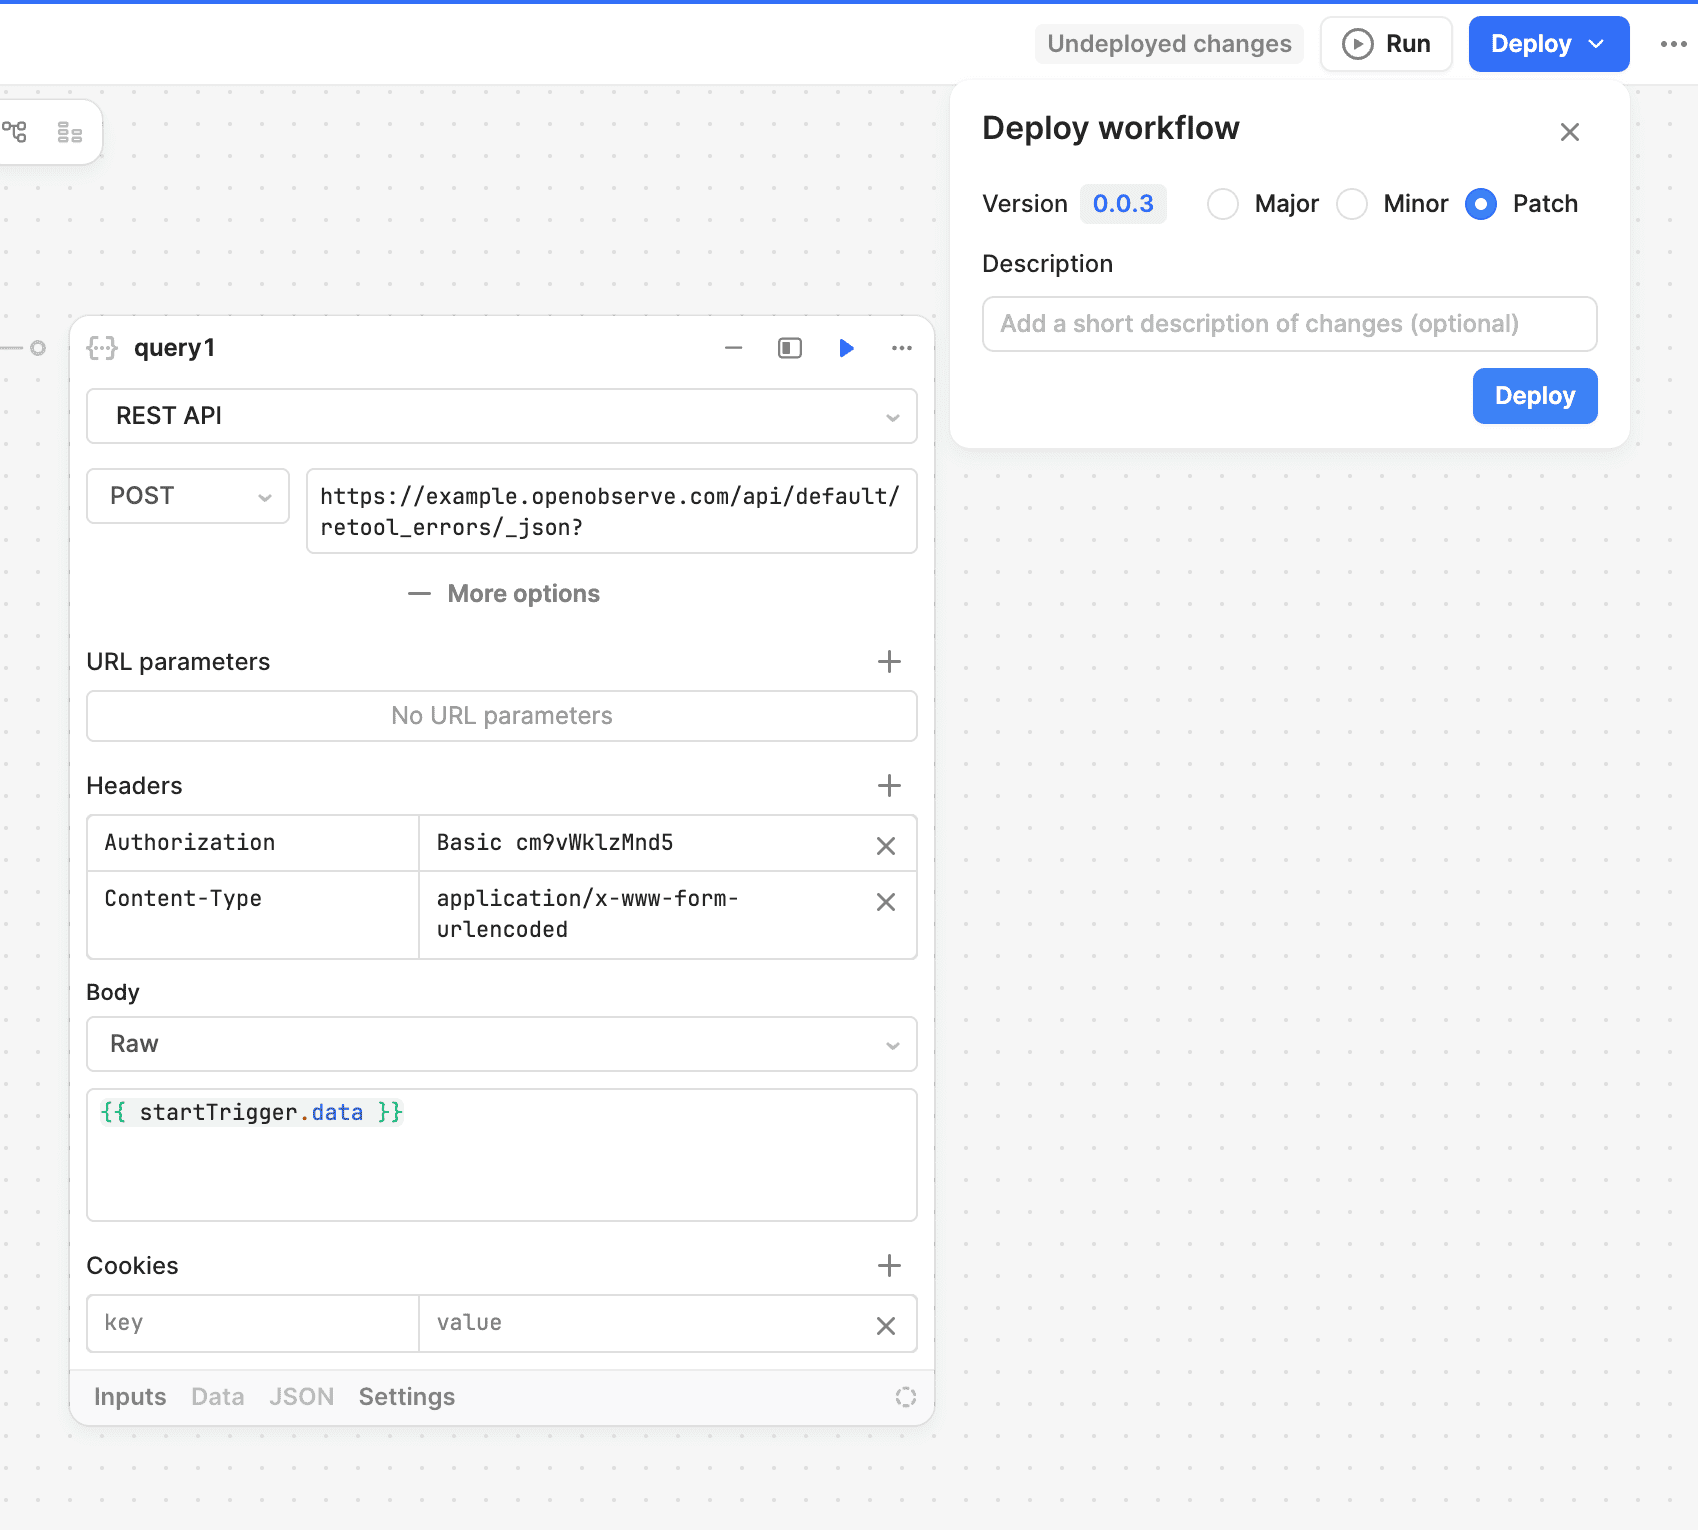
Step 4: Deploy the Workflow
- Review all configurations
- Click Deploy
- Select version
- Monitor deployment status
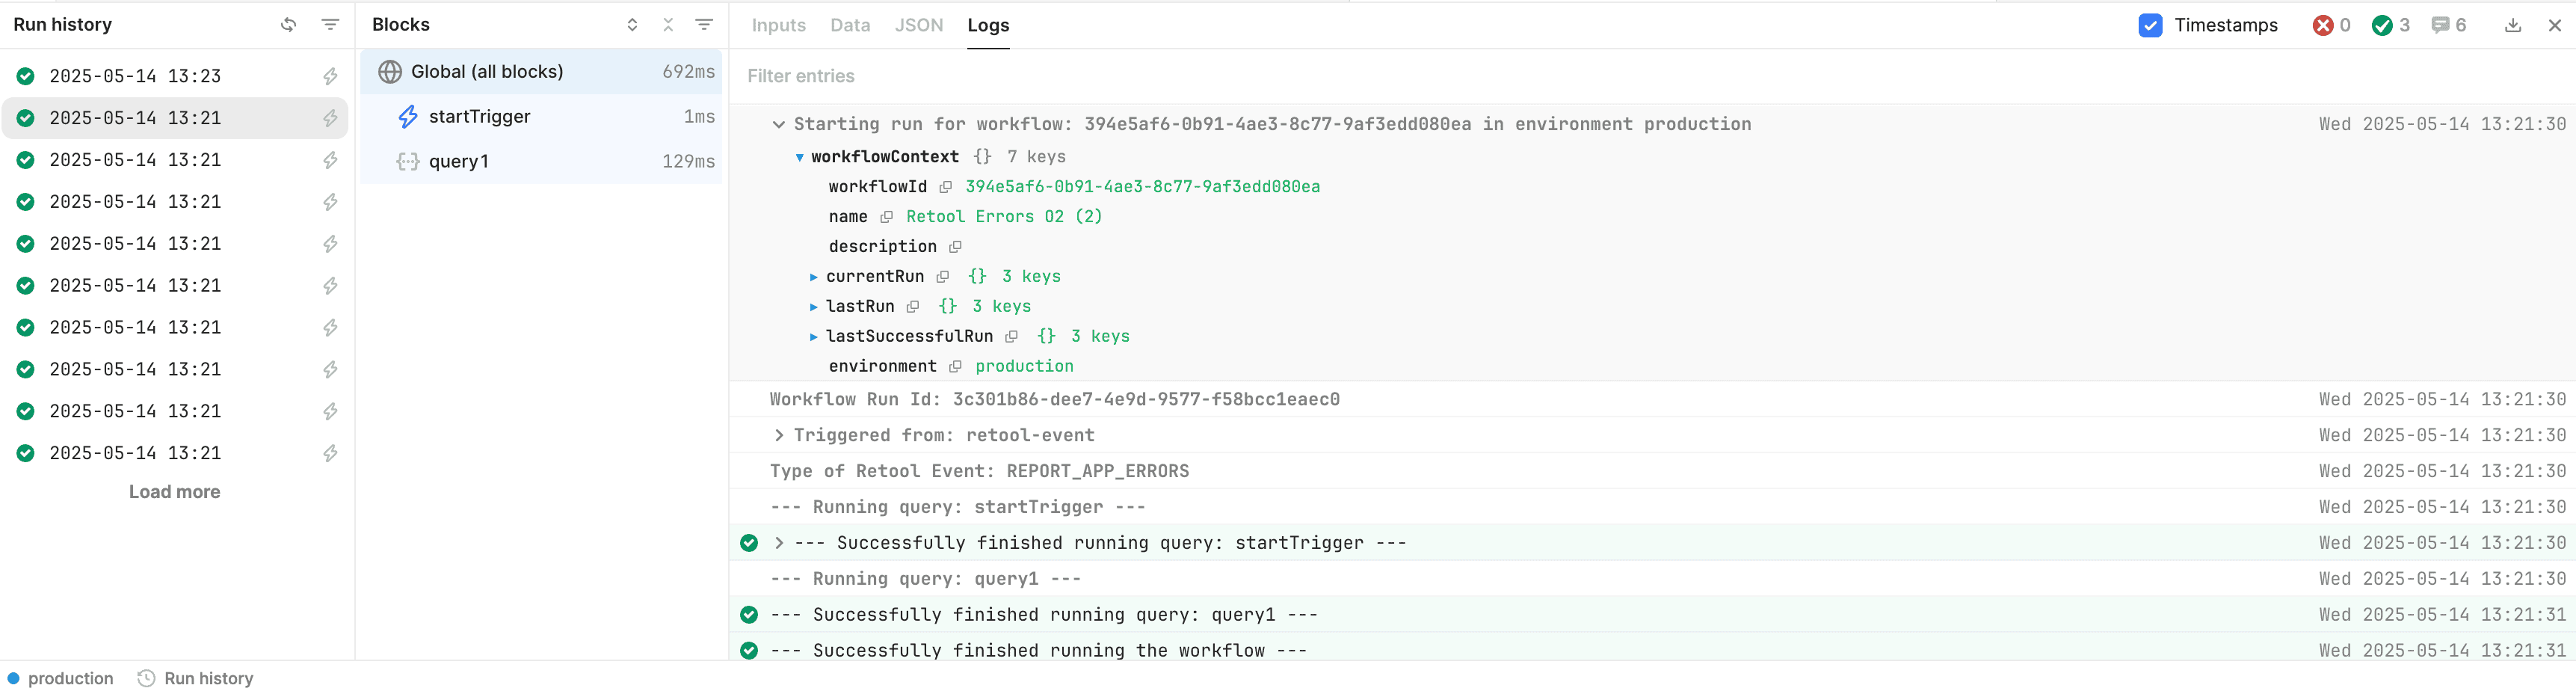
You can monitor the Deployment status by clicking on Run History on bottom left of the workflow page.
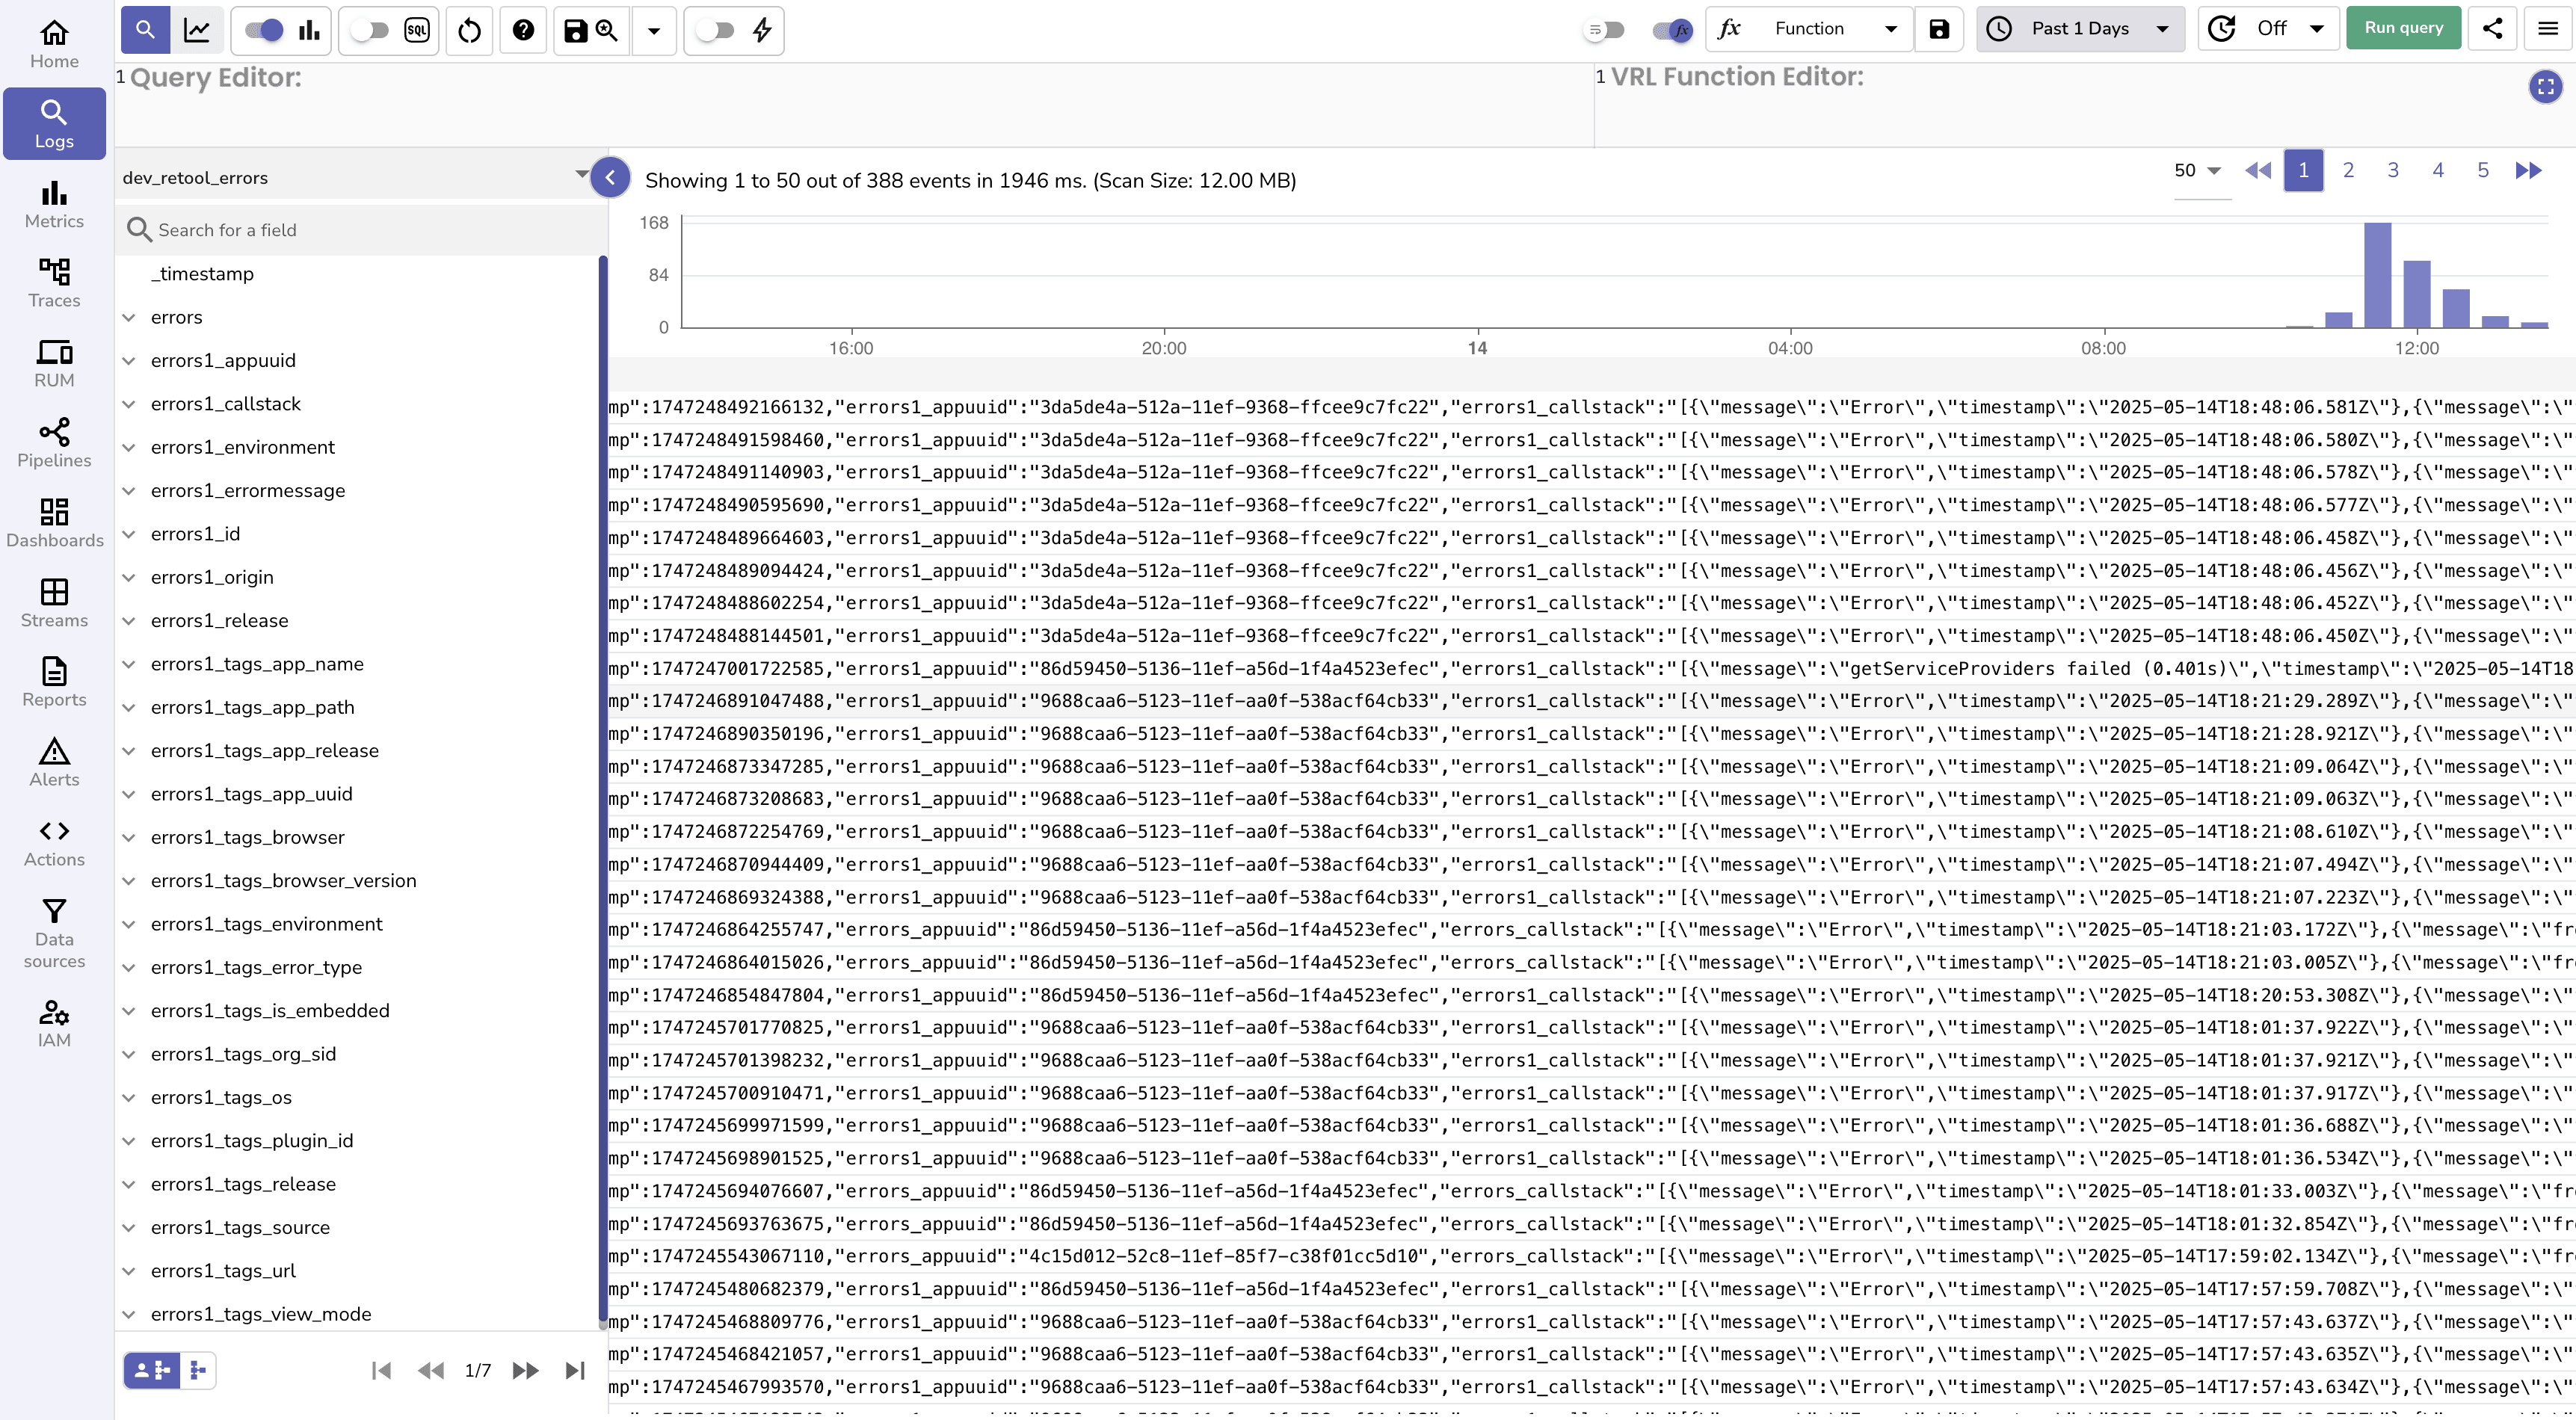
Step 5: Verify Error Collection
Test the integration:
- Open any Retool application
- Trigger a test error
- Check OpenObserve for incoming data
- Verify data appears in
retool_errors stream
Step 6: Configure Data Transformation
Create a VRL transformation function:
# Parse all errors once and store them
parsed_errors = parse_json!(string!(.errors))

# Assign each parsed error to a field explicitly
.errors = parsed_errors[0]
.errors1 = parsed_errors[1]
.errors2 = parsed_errors[2]
.errors3 = parsed_errors[3]
.errors4 = parsed_errors[4]
.errors5 = parsed_errors[5]
.errors6 = parsed_errors[6]
.errors7 = parsed_errors[7]
.errors8 = parsed_errors[8]
.errors9 = parsed_errors[9]
.errors10 = parsed_errors[10]
.errors11 = parsed_errors[11]
Step 7: Create Monitoring Pipeline
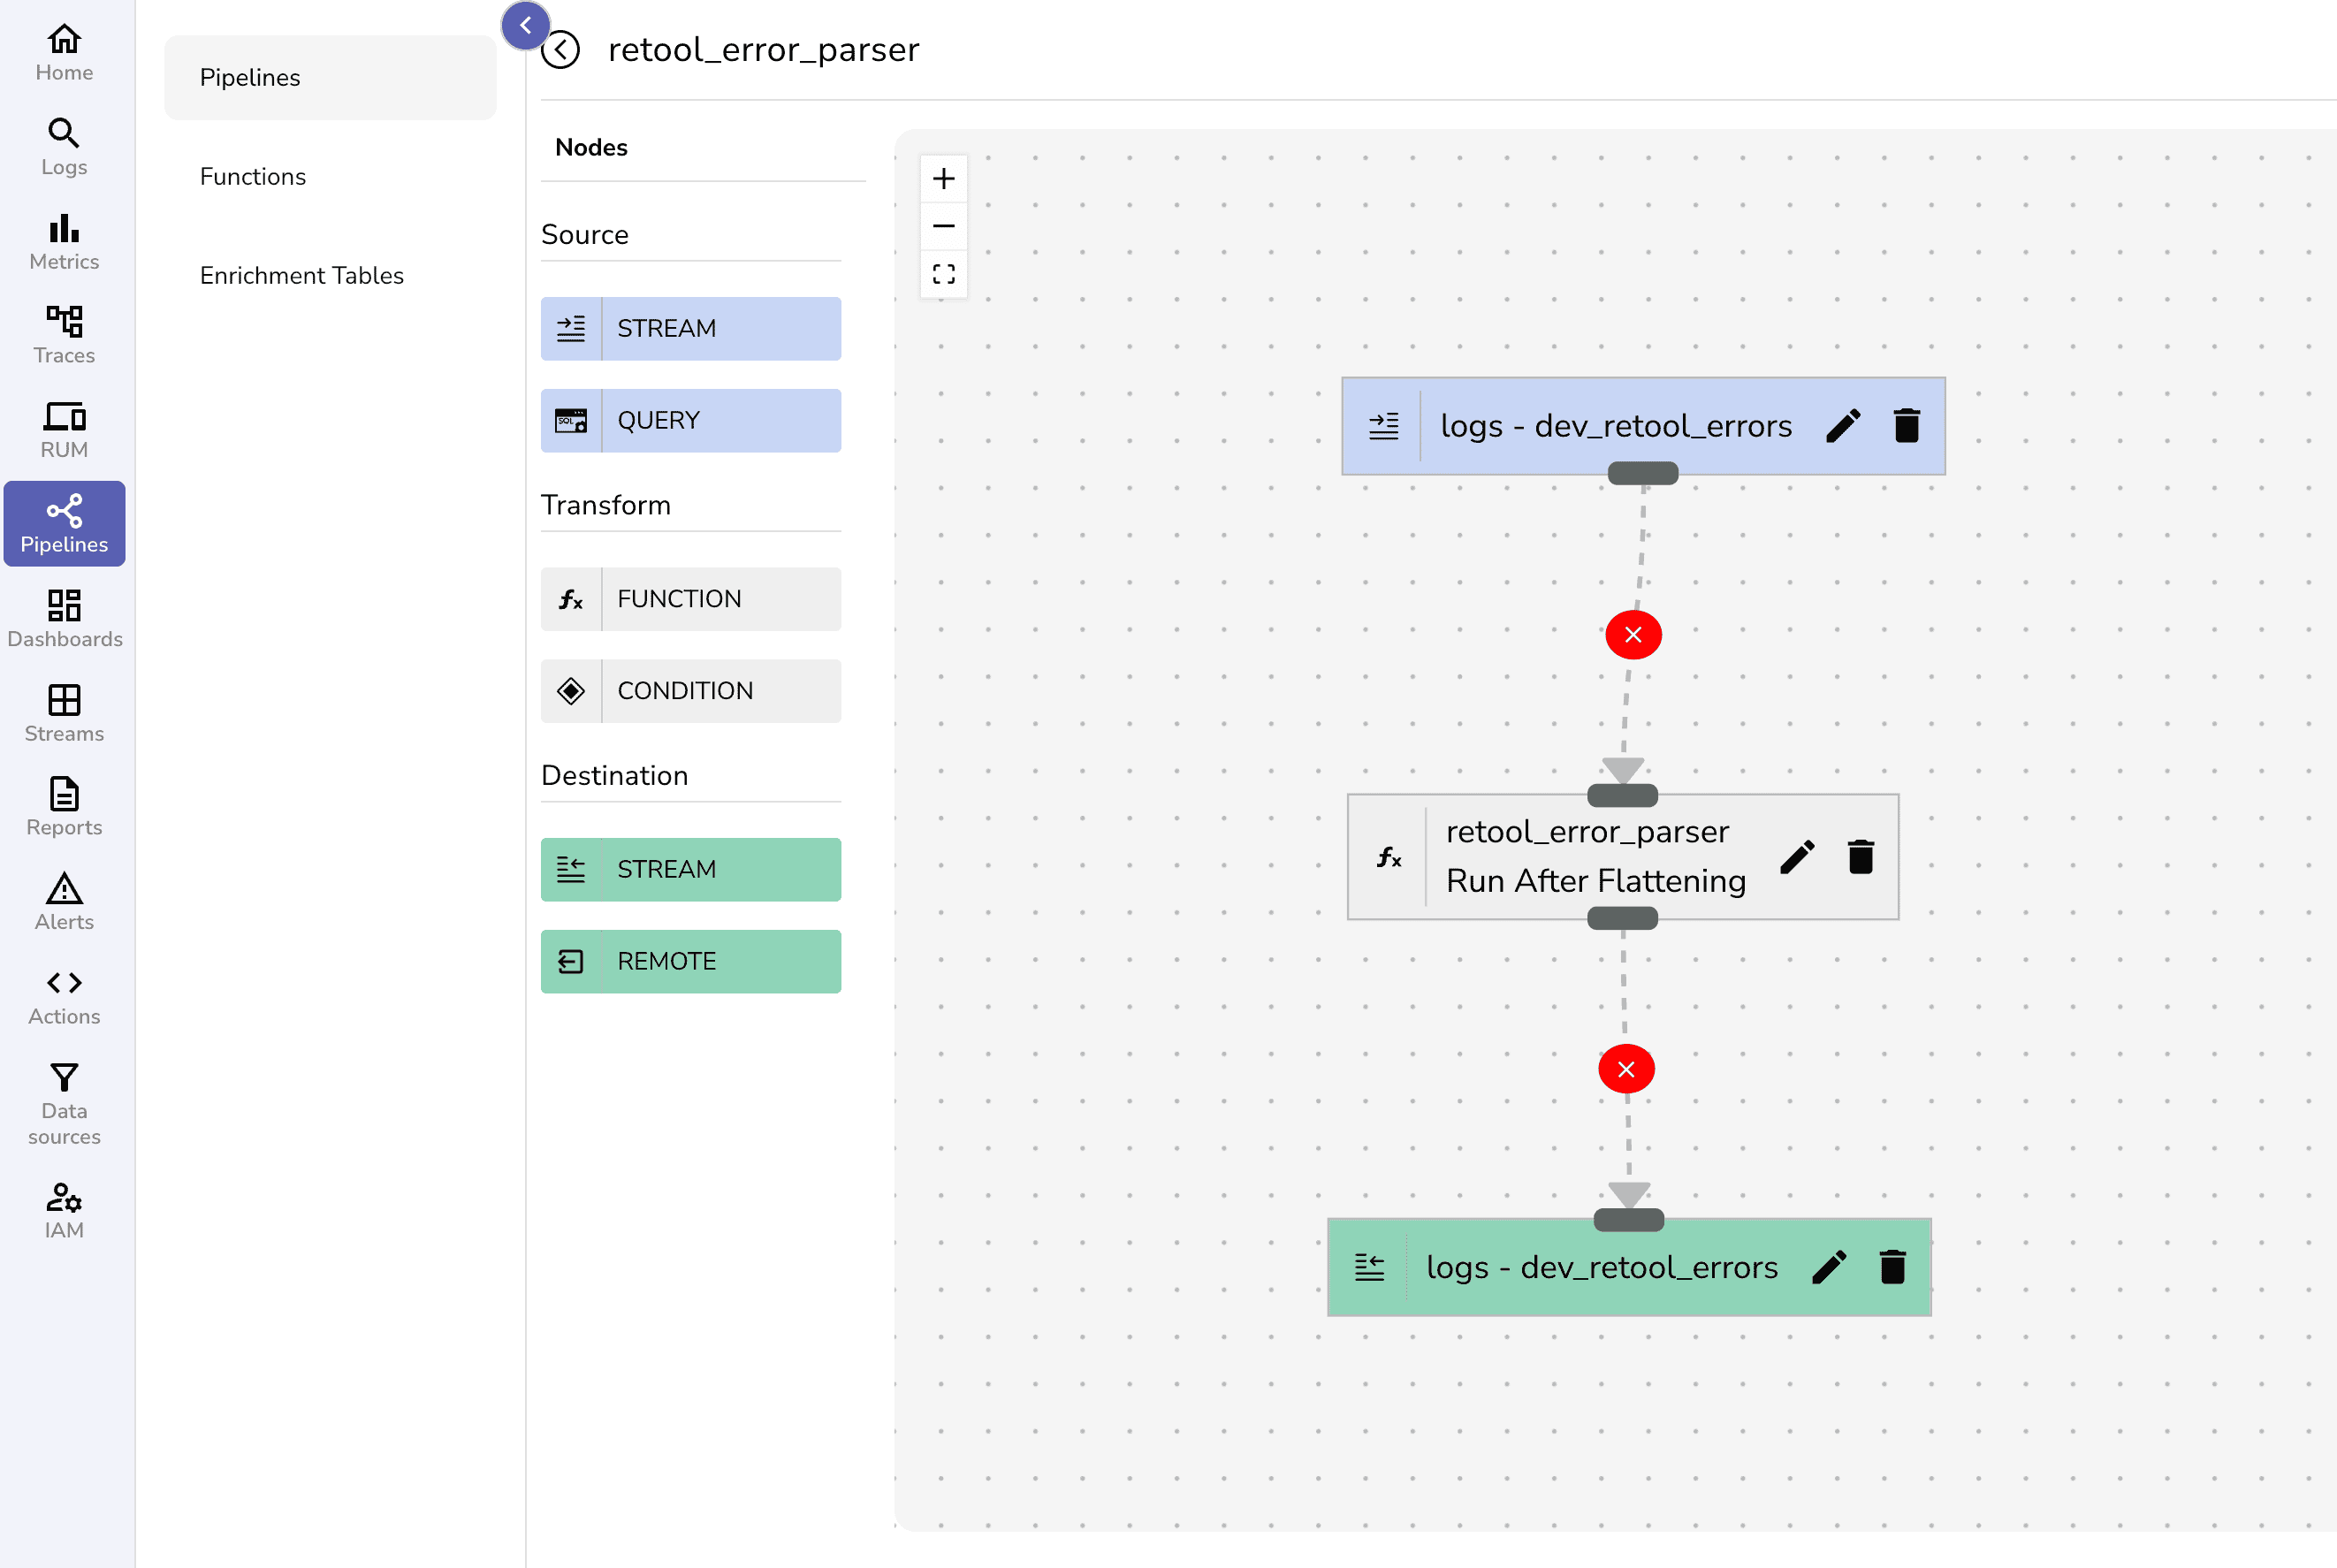
- Access OpenObserve pipeline
- Create new pipeline for Retool errors
- Add the VRL transformation function
- Configure output stream
- Activate the pipeline
Step 8: Import Dashboard
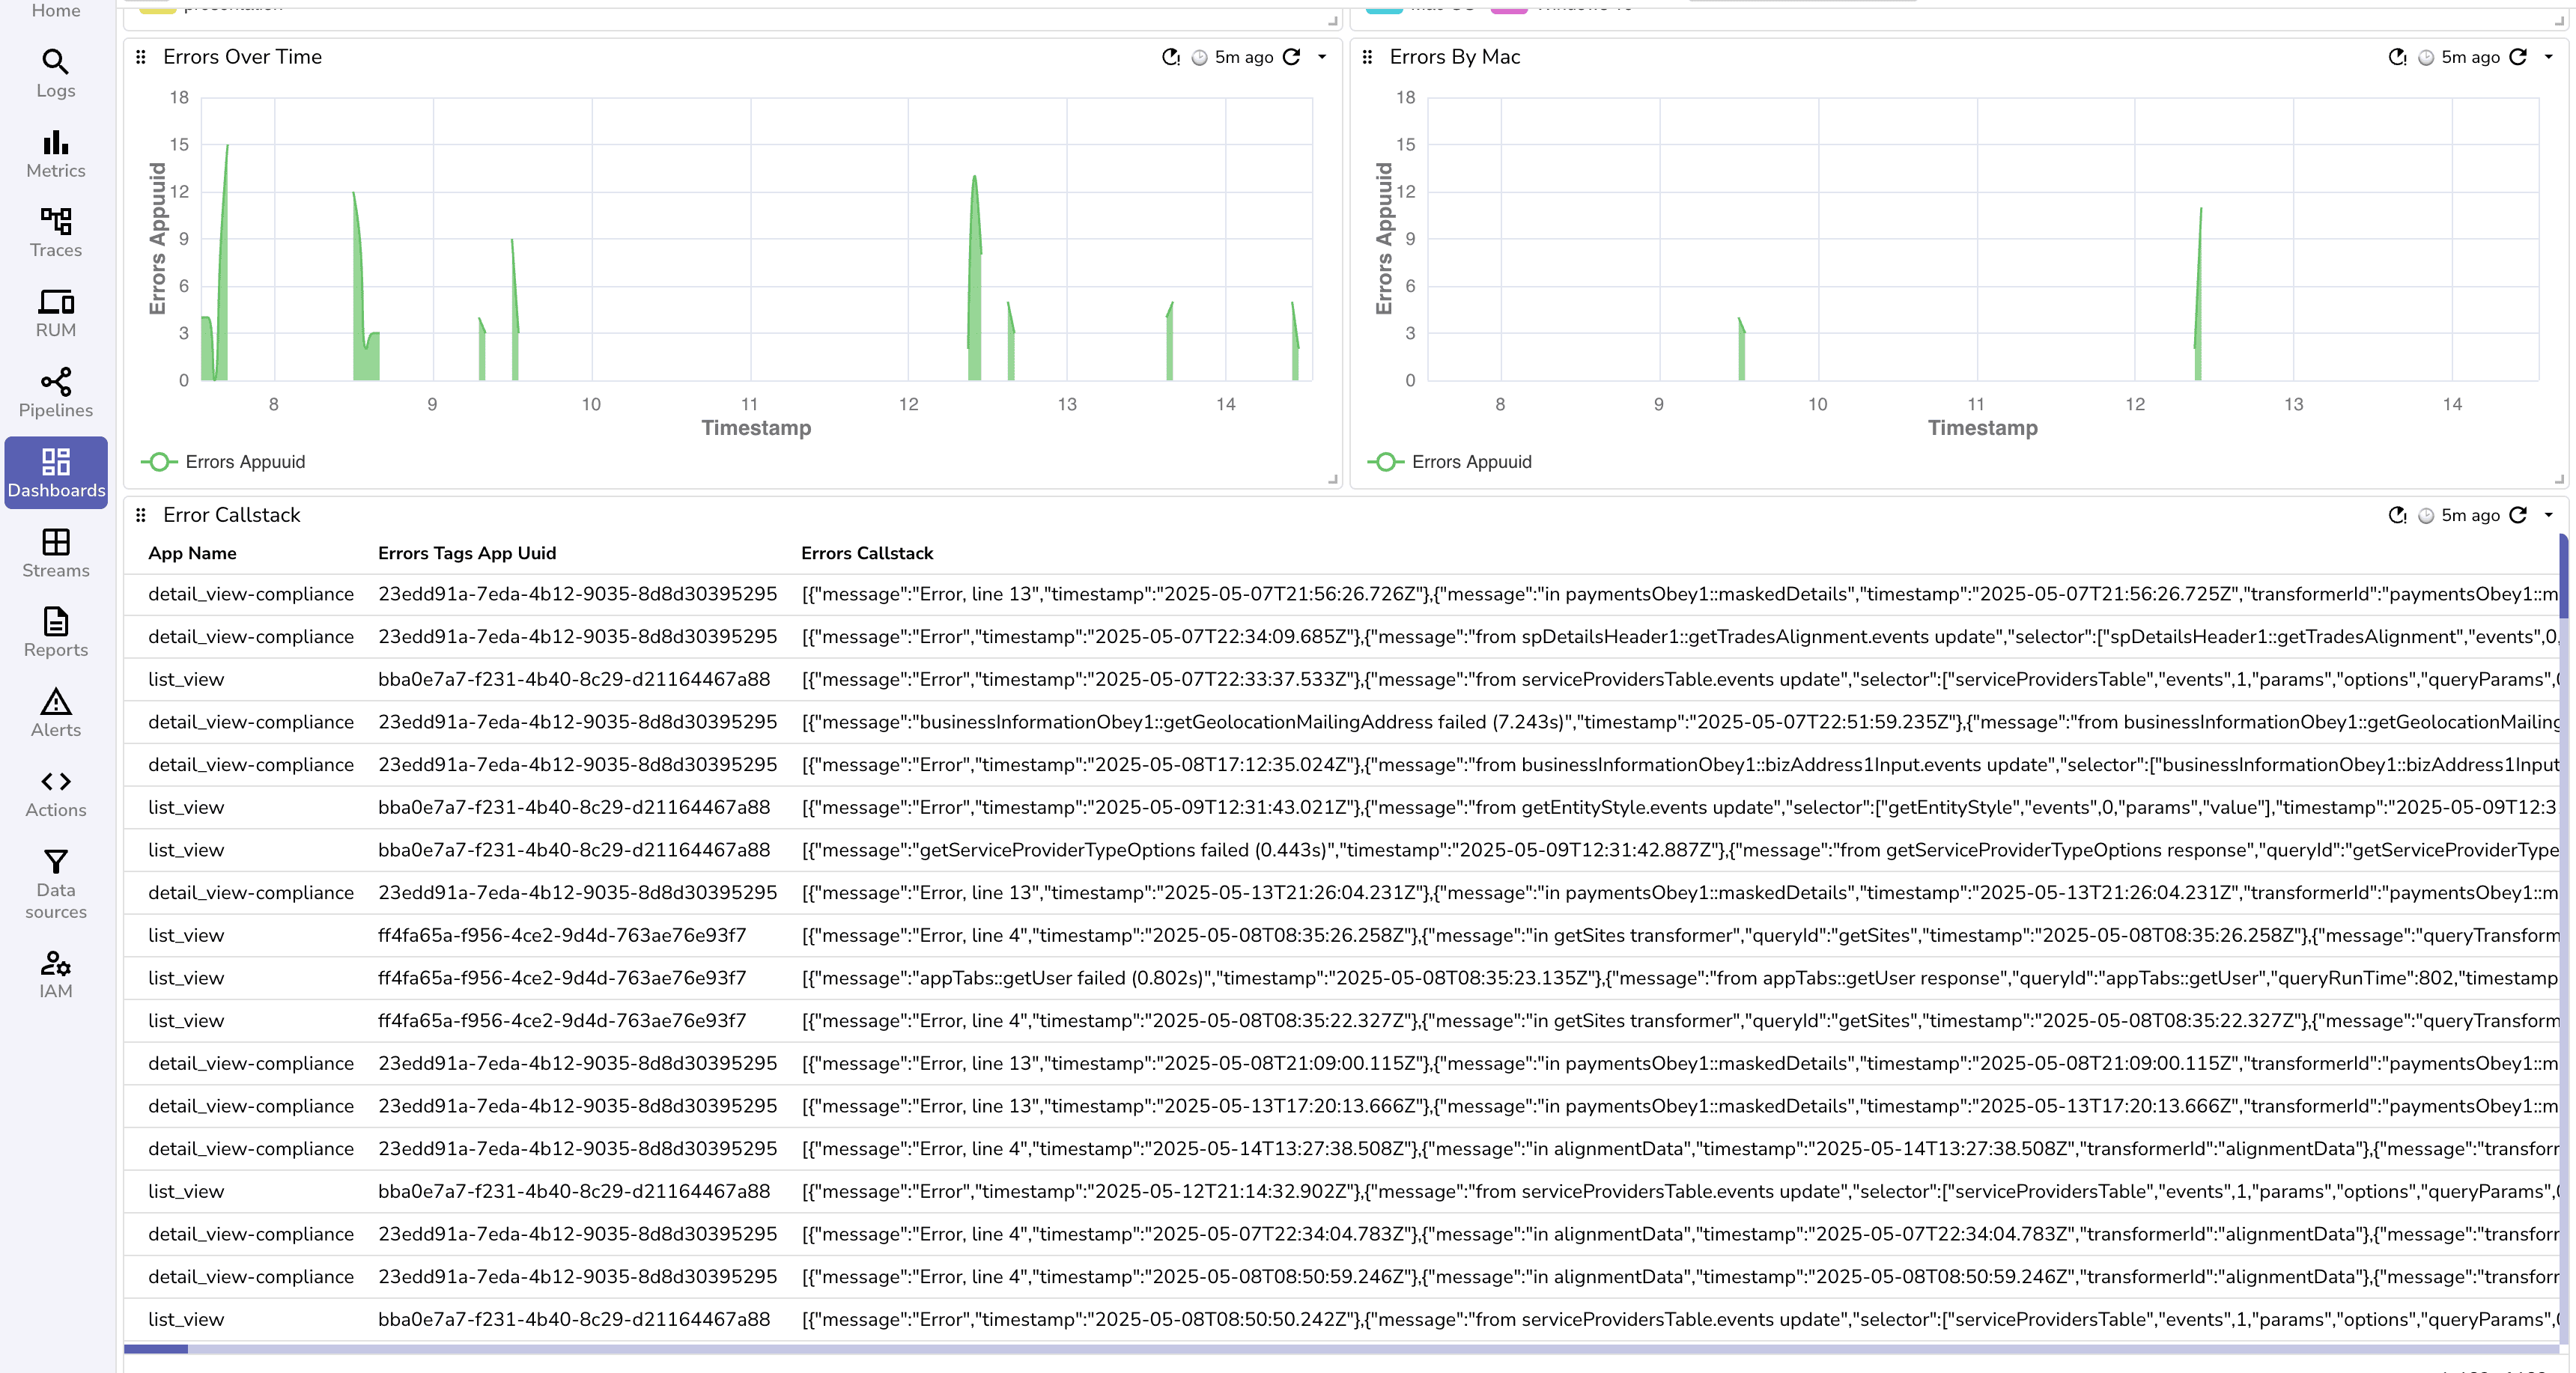
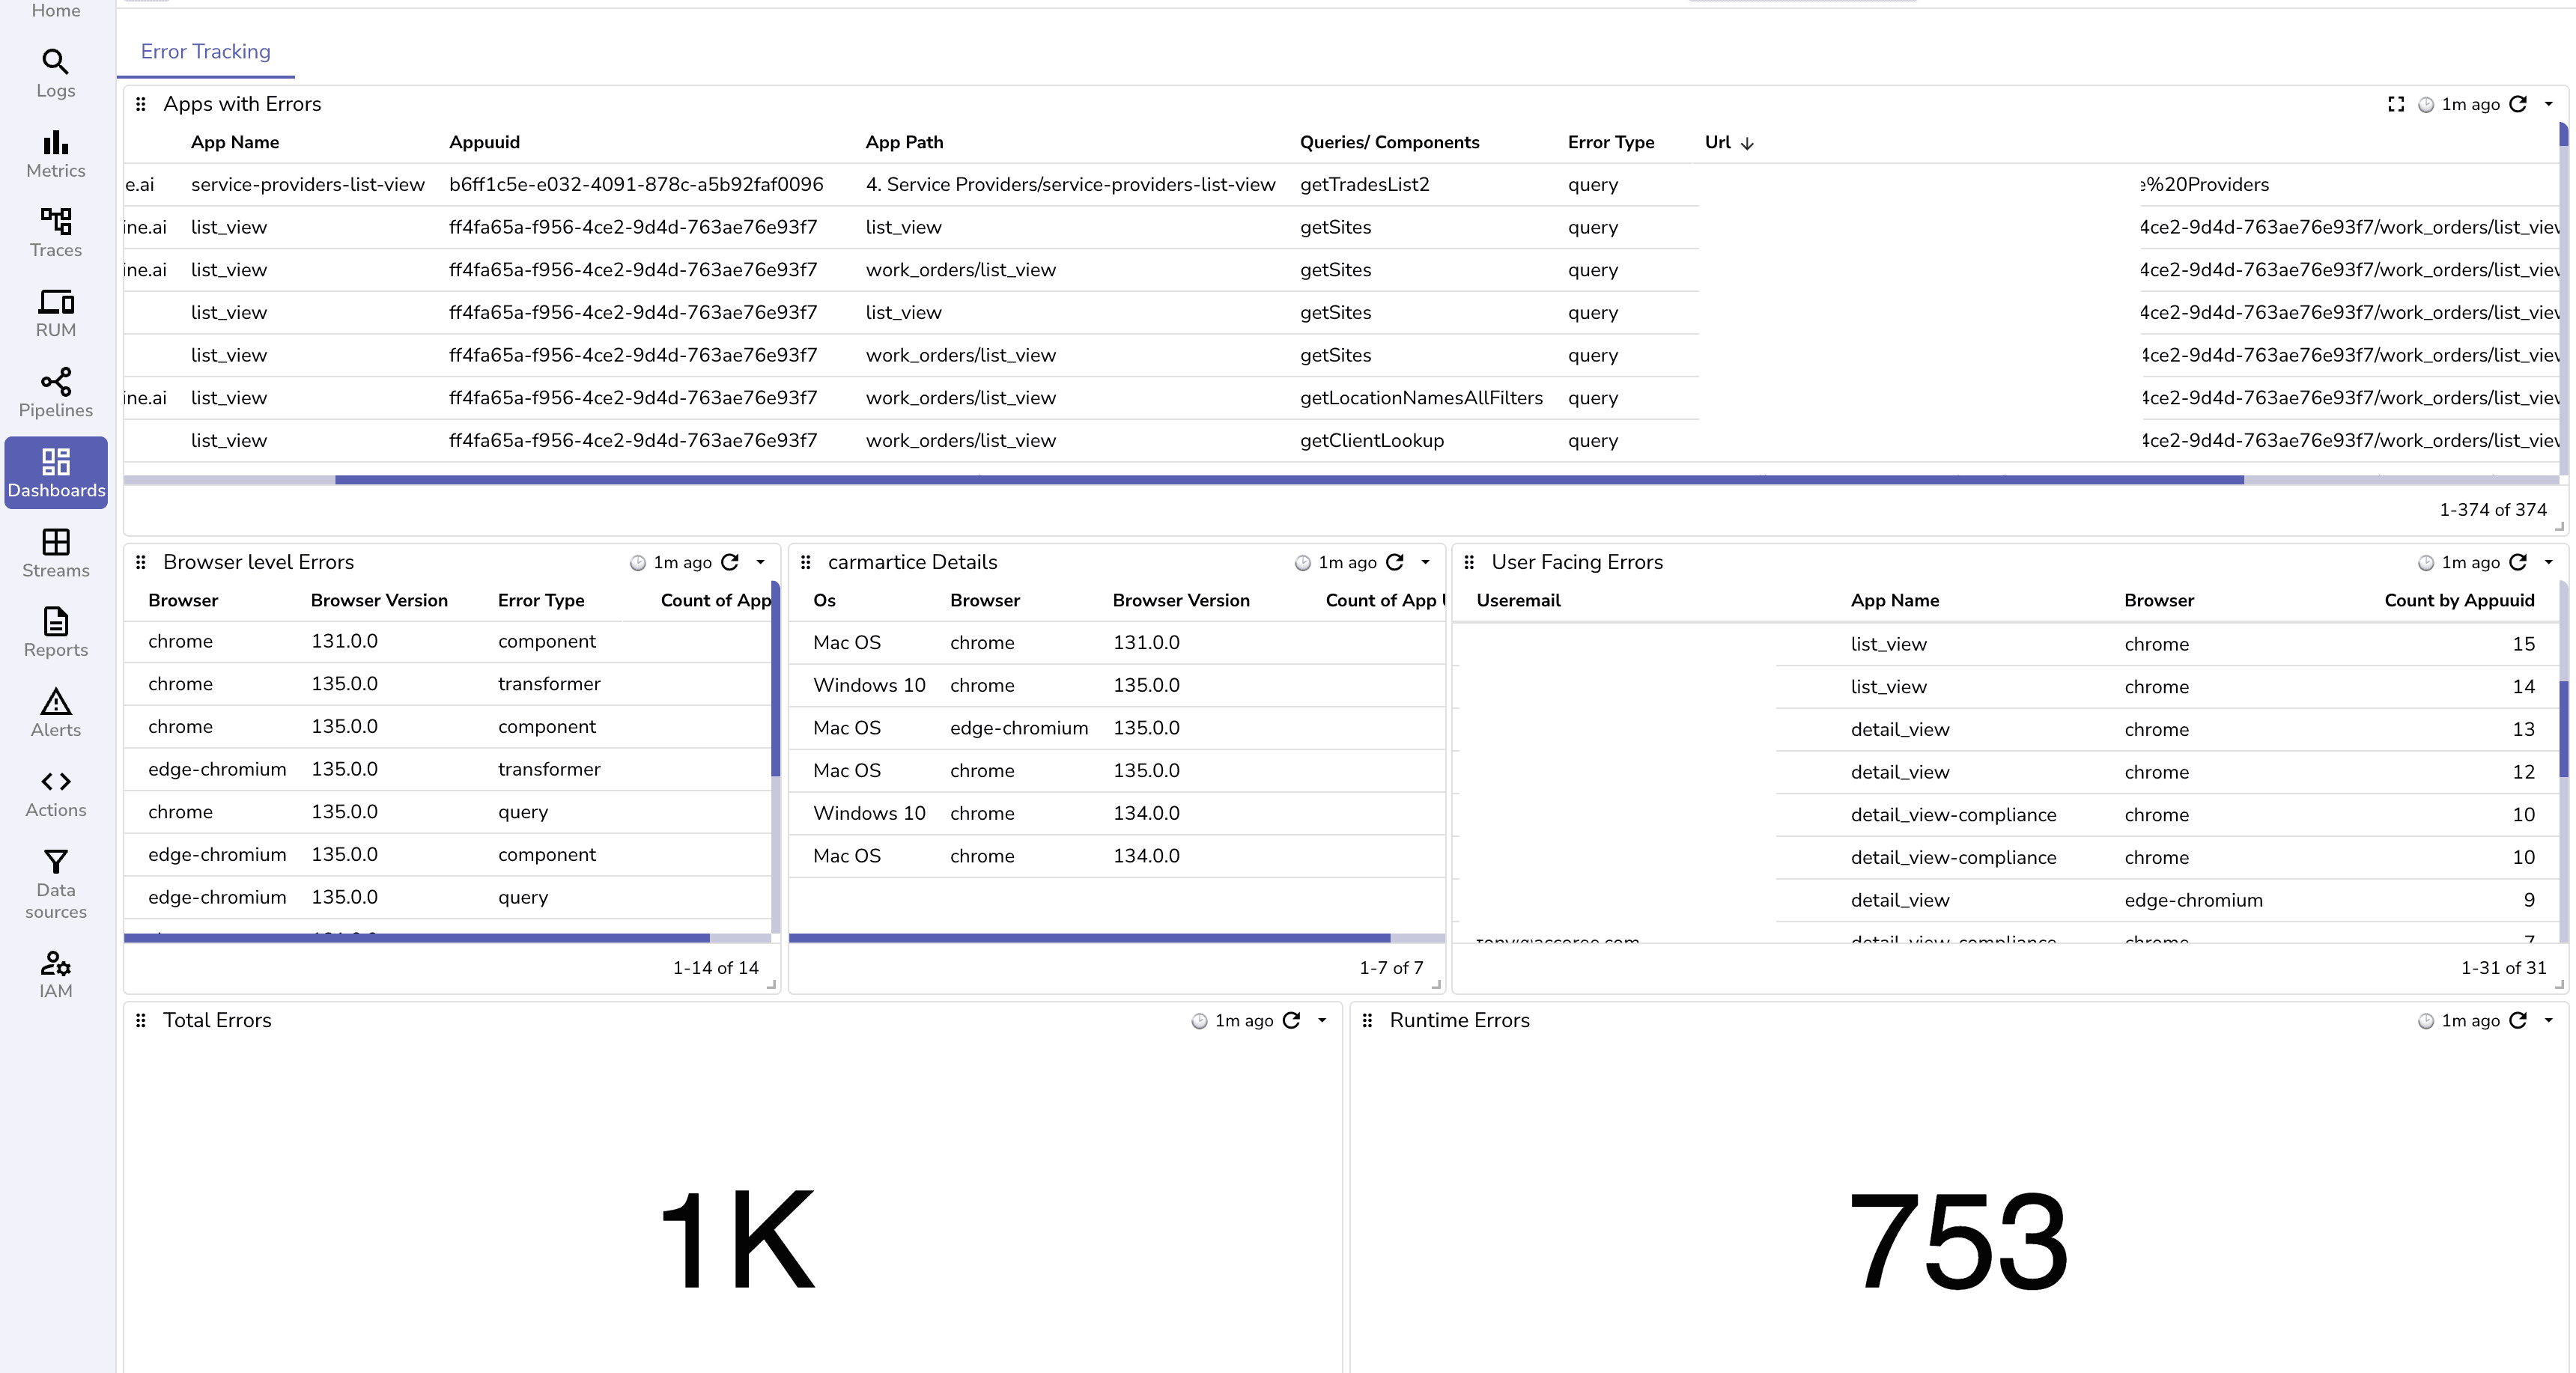
- Upload pre-built Retool dashboard
- Configure data sources
- Customize visualizations
- Set refresh intervals
- Configure access permissions
Performance Optimization
- Batch Processing: Group errors for efficient transmission
- Sampling Strategy: Implement intelligent sampling for high-volume apps
- Data Compression: Enable compression for network efficiency
- Caching: Cache frequently accessed data
- Retention Policies: Configure appropriate data lifecycle
Best Practices
1. Structured Error Logging
// Implement consistent error structure
try {
  const result = await query.run();
  return processData(result);
} catch (error) {
  const structuredError = {
    message: error.message,
    stack: error.stack,
    query_name: query.name,
    user_id: current_user.id,
    app_name: app.name,
    environment: retoolContext.environment,
    timestamp: new Date().toISOString()
  };

  console.error('Query execution failed:', structuredError);
  throw error;
}
2. Monitoring Standards
- Use consistent error formats
- Implement standard naming conventions
- Create reusable error handling components
- Document error codes and meanings
- Regular monitoring reviews
3. Security Considerations
- Sanitize sensitive data in logs
- Implement access controls
- Regular security audits
- Compliance with regulations
- Encrypted data transmission
4. Performance Guidelines
- Monitor query execution times
- Track API response times
- Set performance baselines
- Implement caching strategies
- Regular performance reviews
5. Team Processes
- Create incident response playbooks
- Define escalation procedures
- Regular training sessions
- Knowledge sharing
- Post-mortem analysis
Conclusion
Implementing comprehensive monitoring for Retool applications ensures reliable operations and improves user experience.
Key takeaways:
- Retool provides essential error reporting capabilities
- External monitoring platforms offer advanced features and flexibility
- Proper implementation requires careful planning and configuration
- Regular monitoring and optimization are crucial for success
By following this guide, organizations can establish robust monitoring that scales with their Retool deployment while maintaining operational excellence.
Get Started with OpenObserve Today!
Sign up for a 14 day trial.
Check out our GitHub repository for self-hosting and contribution opportunities.