OpenTelemetry Collector Contrib: A Comprehensive Guide

Simran Kumari
March 08, 2026
15 min read
Don’t forget to share!
Try OpenObserve Cloud today for more efficient and performant observability.
As distributed systems grow in complexity, observability becomes the foundation upon which reliable engineering is built. OpenTelemetry (OTel) has standardised how telemetry is generated and transmitted, and the OpenTelemetry Collector is the engine that sits between your applications and your observability backend processing, enriching, and routing telemetry at scale.
For teams using OpenObserve as their observability backend, the OpenTelemetry Collector Contrib distribution is the natural companion. OpenObserve natively supports OTLP (OpenTelemetry Protocol), which means the entire pipeline from instrumented application to searchable logs, metrics, and traces can be built on open standards with no proprietary agents or lock-in.
This guide walks you through everything you need to know about the Contrib distribution: what it is, how its architecture works, how to deploy it, and how to wire it into OpenObserve for a production-grade observability setup.
The OpenTelemetry Collector is a vendor-agnostic proxy that can receive telemetry data from multiple sources, apply transformations and filtering in-flight, and export the results to one or more backends. It exists as two distinct distributions.
Why Contrib for OpenObserve?
OpenObserve's OTLP-native ingestion means any Contrib exporter that speaks OTLP will work out of the box. At the same time, Contrib's rich receiver ecosystem lets you funnel data from your entire stack cloud infrastructure, Kubernetes, application logs, legacy agents into a single, unified OpenObserve instance.
| Feature | Collector Contrib | Collector Core |
| Scope | All community components | Core essentials only |
| Binary Size | ~120 MB+ | ~50 MB |
| Maintenance | Community-driven | OTel maintainers |
| Stability | Mixed (alpha → stable) | Strict guarantees |
| Best For | Complex, multi-vendor stacks | Pure OTLP / high-security |
For the vast majority of real-world deployments including those targeting OpenObserve, Contrib is the right choice. Core is only recommended when binary size is a hard constraint or security policy prohibits any community-maintained dependencies.
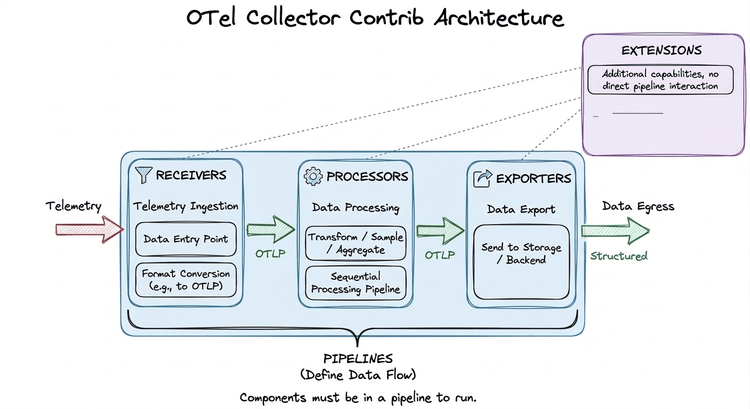
The Collector is built around a plug-and-play pipeline model. Components are declared in configuration and assembled into data-flow pipelines. Crucially, the Collector uses lazy initialisation; a component that is declared but not referenced in any pipeline is never instantiated and consumes zero resources.
Data flows through four types of components: Receivers → Processors → Exporters, with Extensions providing cross-cutting concerns that operate outside of pipelines.
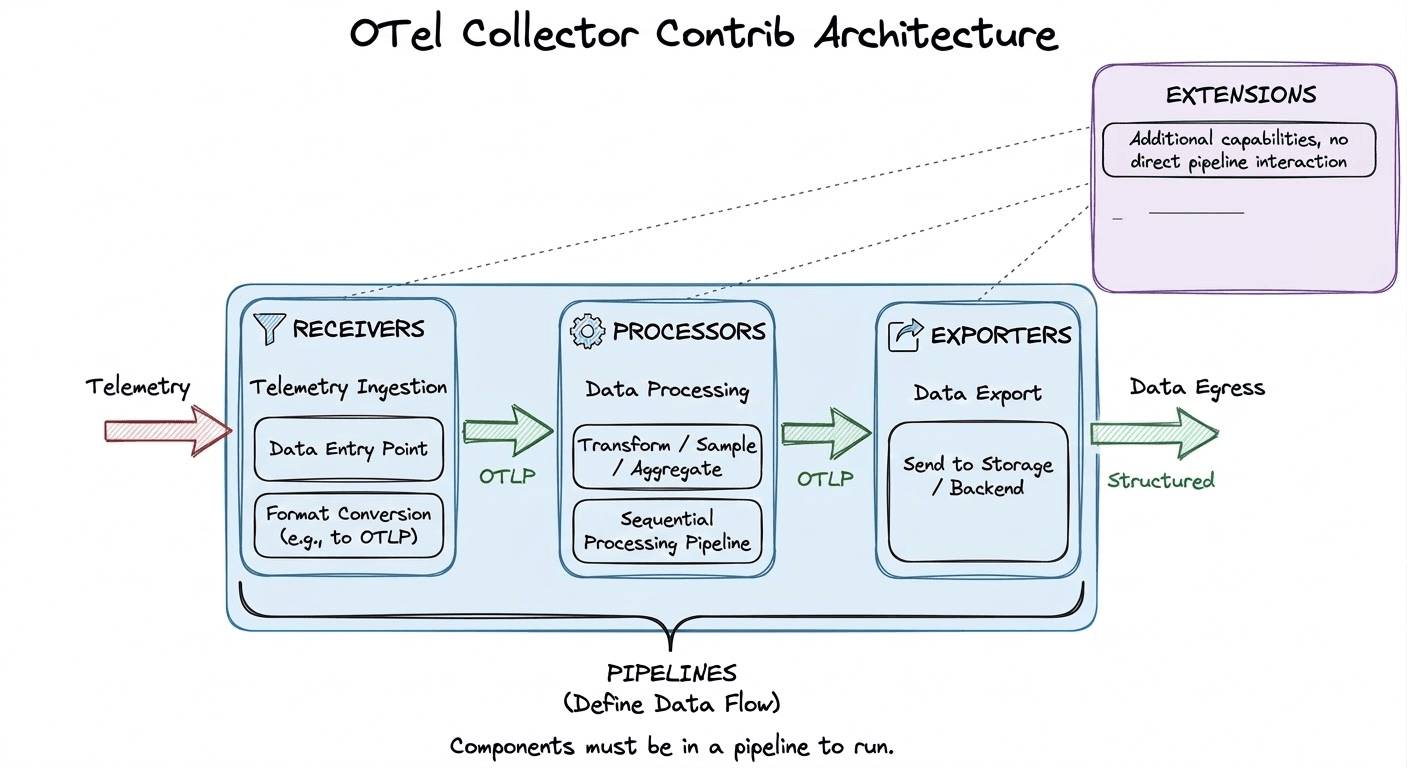
Receivers are the entry point for telemetry data. They either listen on a port (push-based) or actively scrape external sources (pull-based), and convert everything into the Collector's internal OTLP representation before handing it downstream.
filelog tails log files on disk and emits new entries as structured log records. This is the primary mechanism for shipping application and system logs to OpenObserve.hostmetrics periodically scrapes host-level metrics CPU, memory, disk, network and is the standard way to populate OpenObserve's infrastructure dashboards.k8s_cluster connects to the Kubernetes API server and emits cluster-level events and resource metadata, enabling OpenObserve to display per-namespace and per-deployment breakdowns.otlp listens on gRPC (port 4317) and HTTP (port 4318) for OTLP-formatted telemetry from instrumented applications. This is typically the receiver used to ingest application traces and metrics.Processors operate on telemetry data between ingestion and export. They run sequentially in the order they are declared in a pipeline, so placement matters. Processors handle enrichment, filtering, transformation, sampling, and batching.
resourcedetection automatically detects the runtime environment (AWS, GCP, Azure, system hostname) and attaches relevant resource attributes. This makes every span and metric queryable by cloud region or instance type inside OpenObserve without any manual tagging.transform uses the OpenTelemetry Transform Language (OTTL) to rewrite, rename, add, or drop attributes on any telemetry type. It is the right tool for enforcing naming conventions or scrubbing PII before data reaches OpenObserve.tail_sampling buffers entire traces in memory and applies policy-driven sampling after the fact for example, keeping 100% of error traces and only 1% of successful ones. This significantly reduces ingest volume into OpenObserve without discarding high-value signals.batch accumulates telemetry into larger payloads before export. This is almost always the last processor in any pipeline and reduces the number of HTTP/gRPC connections made to OpenObserve's OTLP ingest endpoint.Exporters transmit processed telemetry out of the Collector to a backend. For OpenObserve, the primary exporter is the OTLP exporter, which pushes data to OpenObserve's native ingest endpoint over gRPC or HTTP.
otlphttp is the standard exporter for sending data to OpenObserve's HTTP-based OTLP endpoint (typically on port 5080 or 443 for cloud). It supports TLS, authentication headers, and retry logic. You’ll often see exporters written as otlphttp/openobserve. The part before the slash is the component type, and the part after is just a user-defined label. It doesn’t affect functionality, but helps distinguish multiple exporters of the same type (e.g., otlphttp/openobserve and otlphttp/staging).prometheusremotewrite is available for teams also using the Prometheus remote write endpoint exposed by OpenObserve, particularly useful when migrating from a Prometheus-based metrics stack.kafka is commonly used in large-scale architectures where telemetry is first buffered in Kafka topics and a second Collector layer consumes and forwards data to OpenObserve.debug logs telemetry to stdout. Always include this alongside your OpenObserve exporter during development to confirm data is flowing as expected.Read our detailed guide on Opentelemetry Exporters.
Extensions augment the Collector itself rather than participating in data pipelines. They are declared in the service block separately from pipelines.
health_check exposes an HTTP endpoint (default :13133) that returns the Collector's health status essential for Kubernetes liveness and readiness probes.pprof enables Go's built-in profiling endpoint (default :1777), useful for diagnosing memory or CPU spikes in production Collector instances.zpages provides live debug pages (default :55679) showing the real-time internal state of pipelines, including span latency histograms and per-component error counts.A pipeline connects receivers, processors, and exporters into an ordered data flow. Separate pipelines are defined for each telemetry signal traces, metrics, and logs. Components are lazy-loaded, meaning no code runs for a component that is not referenced in at least one pipeline.
The following is a complete, production-oriented Collector configuration that collects host metrics and OTLP data, enriches with environment metadata, and exports everything to OpenObserve:
receivers:
  hostmetrics:
    collection_interval: 10s
    scrapers:
      cpu:
      memory:
      filesystem:

  otlp:
    protocols:
      grpc:
        endpoint: 0.0.0.0:4317
      http:
        endpoint: 0.0.0.0:4318

processors:
  resourcedetection:
    detectors: [system]

  resource:
    attributes:
      - key: service.name
        value: "my-service"
        action: upsert
      - key: deployment.environment
        value: "production"
        action: upsert

  batch: {}

exporters:
  otlphttp:
    endpoint: "http://<openobserve-host>:5080/api/<org>/"
    headers:
      Authorization: "Basic <base64(user:password)>"
  debug:
    verbosity: normal

extensions:
  health_check:
    endpoint: 0.0.0.0:13133
  pprof:
    endpoint: 0.0.0.0:1777
  zpages:
    endpoint: 0.0.0.0:55679

service:
  pipelines:
    metrics:
      receivers: [hostmetrics, otlp]
      processors: [resourcedetection, resource, batch]
      exporters: [otlphttp, debug]
    traces:
      receivers: [otlp]
      processors: [resourcedetection, resource, batch]
      exporters: [otlphttp, debug]
    logs:
      receivers: [otlp]
      processors: [resourcedetection, resource, batch]
      exporters: [otlphttp, debug]
  extensions: [health_check, pprof, zpages]
OpenObserve Authentication
OpenObserve's OTLP endpoint uses HTTP Basic authentication. Pass the authentication token as the Authorization header in the otlphttp exporter. For cloud-hosted OpenObserve, the endpoint includes your organisation slug: https://<host>/api/<org>/.
The Contrib distribution ships as a Docker image and a Helm chart, making it straightforward to integrate into both local and cloud environments. Docker works well for single-host or development deployments, while Kubernetes via Helm is the standard choice for production.
The official Docker image packages all Contrib components and can be started with a single command. Save your collector configuration as otel-config.yaml and run:
docker run \
  -v ./otel-config.yaml:/etc/otelcol-contrib/config.yaml \
  -p 4317:4317 \
  -p 4318:4318 \
  -p 13133:13133 \
  -p 1777:1777 \
  -p 55679:55679 \
  --name otelcol-contrib \
  otel/opentelemetry-collector-contrib:0.142.0
Verify the Collector is healthy by querying the health check extension:
curl localhost:13133
A successful response will return a JSON payload indicating the Collector is running and all configured extensions are healthy.
For production Kubernetes environments, the official OpenTelemetry Helm chart is the recommended approach. It supports Deployment, DaemonSet, and StatefulSet modes, making it adaptable to a wide range of collection strategies.
Add the Helm repository and install the chart, passing your configuration via a values file:
helm repo add open-telemetry https://open-telemetry.github.io/opentelemetry-helm-charts

helm install \
  -f values.yaml \
  otelcol-contrib \
  open-telemetry/opentelemetry-collector
Once deployed, use port-forward to access Collector services during development or debugging:
kubectl port-forward svc/otelcol-contrib-opentelemetry-collector \
  4317:4317 \
  4318:4318 \
  13133:13133 \
  55679:55679
DaemonSet vs. Deployment
Run the Collector as a DaemonSet when every node must collect host metrics or tail log files i.e., when the Collector needs physical access to node-level resources. Use a Deployment when the Collector acts as a gateway that aggregates and forwards OTLP data from application pods to OpenObserve. Many production setups use both tiers simultaneously.
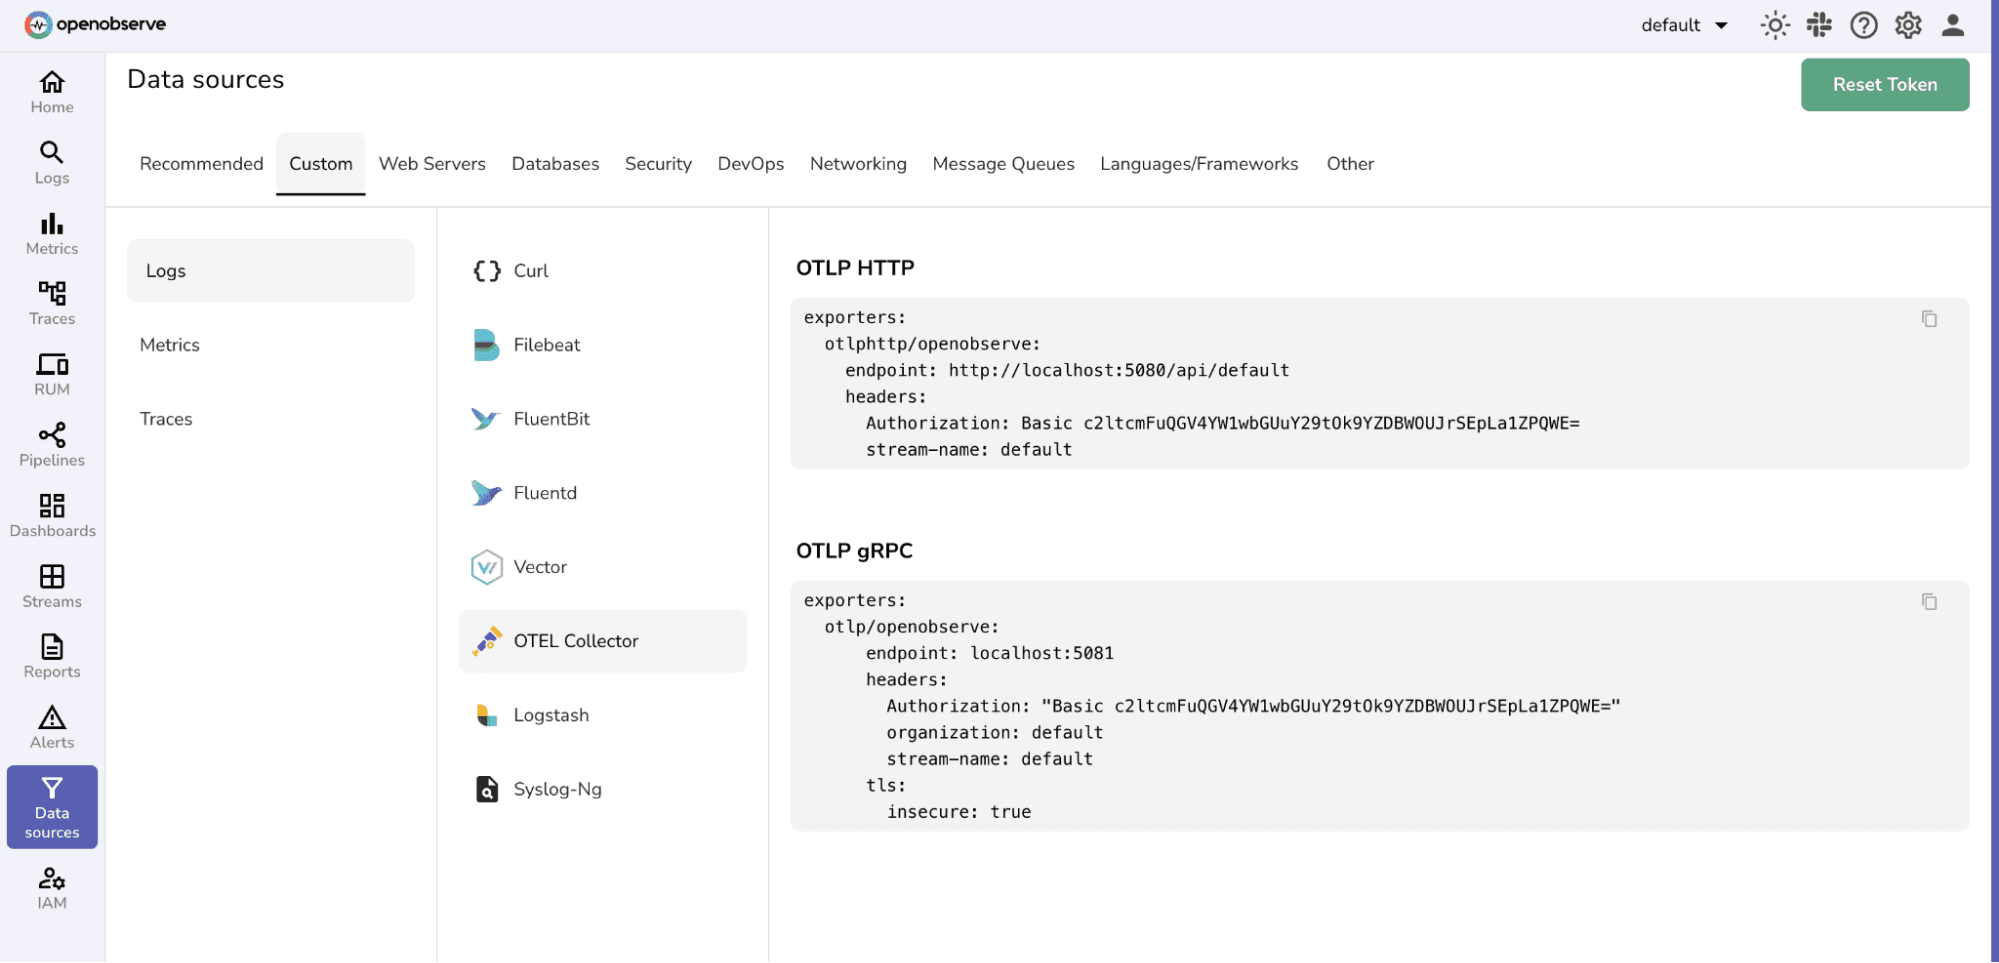
The otlphttp exporter in your Collector configuration should point to OpenObserve's ingest endpoint. For self-hosted OpenObserve:
exporters:
  otlphttp:
    endpoint: "http://localhost:5080/api/default/"
    headers:
      Authorization: "Basic <auth-token>"
    tls:
      insecure: true   # set false in production with valid certs
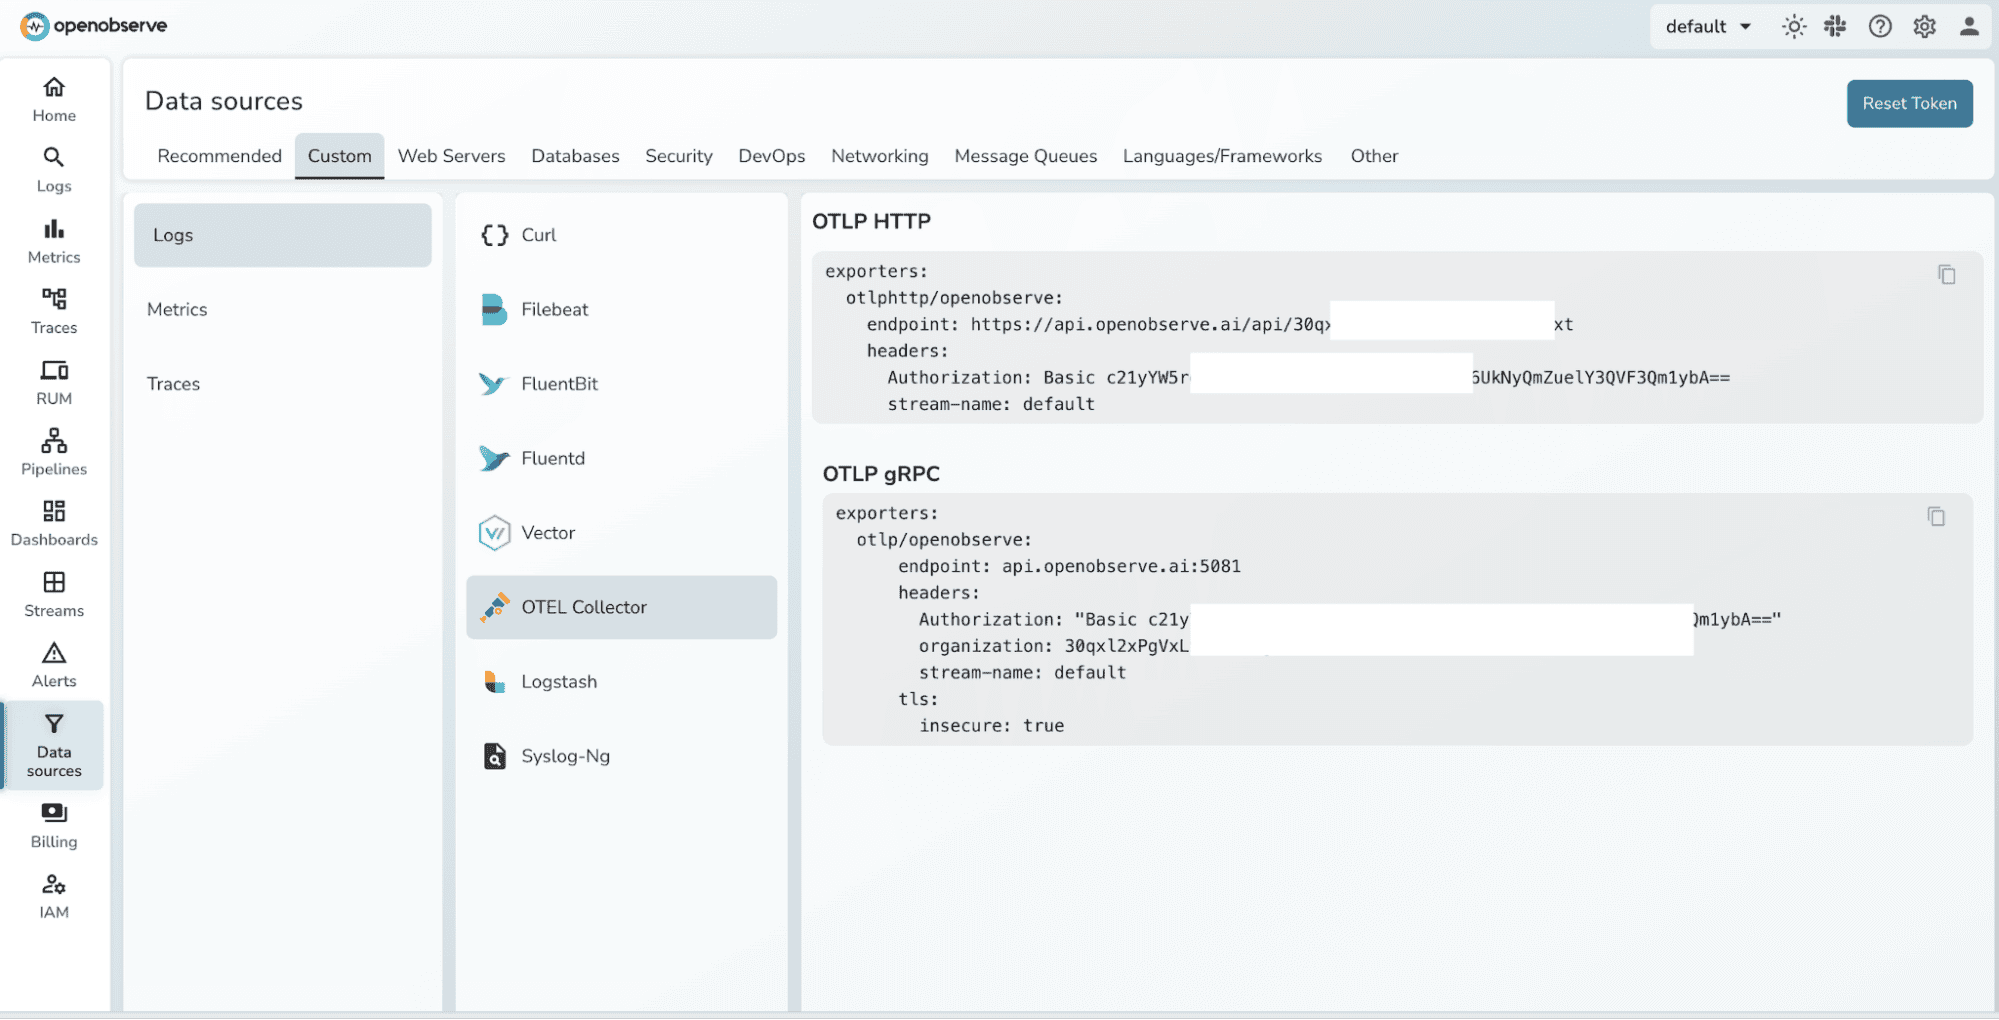
For OpenObserve Cloud, replace the endpoint with your organisation's cloud ingestion URL, set insecure: false, and use your cloud credentials in the Authorization header.
The full Contrib binary ships at ~120 MB because it bundles every community component. The OpenTelemetry Collector Builder (OCB) lets you compile a lean, purpose-built binary containing only the components your pipeline actually needs, useful when binary size or third-party dependency footprint is a concern.
Download OCB for your platform, write a manifest listing your required Go modules, then build:
# Download OCB (example: Linux AMD64)
curl --proto '=https' --tlsv1.2 -fL -o ocb \
  https://github.com/open-telemetry/opentelemetry-collector-releases/releases/download/cmd%2Fbuilder%2Fv0.142.0/ocb_0.142.0_linux_amd64
chmod +x ocb

# Build and run
./ocb --config builder-config.yaml
./_build/openobserve-collector --config otel-config.yaml
A minimal builder-config.yaml for an OpenObserve pipeline looks like this:
Instead of downloading the large default Collector that includes hundreds of components, OCB reads this file and builds a smaller Collector containing only the receivers, processors, exporters, and extensions you specify.
dist:
  name: openobserve-collector
  output_path: ./_build
  otelcol_version: 0.142.0

receivers:
  - gomod: go.opentelemetry.io/collector/receiver/otlpreceiver v0.142.0
  - gomod: github.com/open-telemetry/opentelemetry-collector-contrib/receiver/hostmetricsreceiver v0.142.0
  - gomod: github.com/open-telemetry/opentelemetry-collector-contrib/receiver/filelogreceiver v0.142.0

processors:
  - gomod: go.opentelemetry.io/collector/processor/batchprocessor v0.142.0
  - gomod: github.com/open-telemetry/opentelemetry-collector-contrib/processor/resourcedetectionprocessor v0.142.0

exporters:
  - gomod: go.opentelemetry.io/collector/exporter/otlphttpexporter v0.142.0
  - gomod: go.opentelemetry.io/collector/exporter/debugexporter v0.142.0

extensions:
  - gomod: go.opentelemetry.io/collector/extension/healthcheckextension v0.142.0
Any component not declared here will be unavailable at runtime, keeping both the binary size and the attack surface to a minimum.
When running workloads on Kubernetes, raw OTLP data from your applications lacks the context needed for effective investigation; there are no Pod names, Namespace labels, or Deployment IDs attached. The Contrib distribution solves this with the k8sattributes processor, which queries the Kubernetes API and automatically enriches every span, metric, and log record with Kubernetes-specific metadata.
In OpenObserve, this enrichment immediately becomes filterable. You can write queries like "show all error traces for pods in the payments namespace" without any additional instrumentation changes in your application code.
The filelog receiver is the standard way to collect application and system logs and forward them to OpenObserve. It supports glob patterns for multi-file collection, JSON and regex parsing operators, and multiline detection meaning it can correctly reconstruct stack traces that span multiple lines.
Combined with the transform processor, you can normalise log severity levels, extract fields from message strings, and attach service identifiers before the data lands in OpenObserve, keeping your queries clean and your index schema consistent.
High-throughput services can generate millions of spans per day. Sending all of them to OpenObserve is rarely necessary; most successful requests follow predictable patterns and provide limited diagnostic value.
The tail_sampling processor addresses this by collecting complete traces before applying sampling decisions. A typical policy keeps 100% of error traces, 100% of slow traces above a latency threshold, and a configurable percentage of everything else. Only what passes the policy reaches OpenObserve, dramatically reducing storage costs while preserving the signals that matter.
If your organisation is migrating from an existing tracing stack Jaeger, Zipkin, or a Prometheus pull-based metrics setup, Contrib provides native receivers for each of those formats. The Collector acts as a protocol translation layer, accepting legacy formats on one side and emitting OTLP to OpenObserve on the other. This allows teams to migrate their observability backend without changing application instrumentation in lockstep.
At scale, a single Collector tier is often insufficient. A common pattern is to run lightweight Collectors as agents on each node (or as a sidecar) that perform minimal local processing and forward to a centralised gateway Collector tier. The gateway applies heavier operations tail sampling, deduplication, routing to multiple backends before forwarding to OpenObserve.
This topology keeps per-node resource consumption low while enabling sophisticated pipeline logic at the gateway without duplicating configuration across every node.
Not all Contrib components carry the same stability guarantees. Each component is marked with one of three maturity levels that indicate how safe it is to use in production.
otlp, hostmetrics, filelog, resourcedetection, batch are all stable. Always check the component's README in the Contrib repository before adding a new component to a production pipeline.The OpenTelemetry Collector Contrib distribution provides everything you need to build a complete, production-grade observability pipeline that feeds OpenObserve. Its extensible component model covers data collection from virtually any source, gives you fine-grained control over transformation and sampling in-flight, and delivers data to OpenObserve via a standardised OTLP connection that requires no vendor-specific configuration.
For teams that need a leaner footprint or have strict security requirements, the OCB builder makes it straightforward to produce a purpose-built binary containing only the components your pipeline actually uses without giving up any of the ecosystem benefits of Contrib.
Whether you are getting started with a simple Docker-based single-node setup or architecting a multi-tier Kubernetes pipeline at scale, the patterns in this guide give you the foundation to instrument confidently and observe clearly.
No. Components that are declared but not referenced in any pipeline are never initialised. The larger binary size means slightly more startup memory, but at runtime only the components you actually use consume CPU and memory. An idle receiver sitting in the binary has zero impact on pipeline throughput.
Yes. If you use the full Contrib binary, all Core components are already included. If you use OCB to build a custom binary, you can freely mix Core module references and Contrib module references in the same manifest. The resulting binary will contain exactly what you declare.
For HTTP-based export, use the otlphttp exporter pointing to your OpenObserve instance on port 5080 (self-hosted) or your cloud endpoint. For gRPC-based export, use the otlp exporter. Both work; HTTP is typically easier to configure through firewalls and load balancers.
OpenObserve uses HTTP Basic authentication. Encoded credentials can be used to set the Authorization header in the otlphttp exporter's headers block. For production, store the encoded credentials in a Kubernetes Secret and reference it via an environment variable in your Collector configuration rather than hardcoding it in plaintext.
Use a DaemonSet when the Collector needs direct access to node resources reading log files from /var/log, scraping host metrics, or capturing Docker/containerd runtime stats. Use a Deployment when the Collector acts as a centralised gateway that receives OTLP from applications over the network. Many production setups use both: a DaemonSet agent tier and a Deployment gateway tier.
Passionate about observability, AI systems, and cloud-native tools. All in on DevOps and improving the developer experience.


