Oracle Database Performance Monitoring with OpenTelemetry and OpenObserve

Manas Sharma
August 28, 2025
7 min read
Don’t forget to share!
Try OpenObserve Cloud today for more efficient and performant observability.

Oracle Database is the backbone of countless enterprise applications, handling mission-critical workloads that can't afford downtime. But when performance issues hit - slow queries, session bottlenecks, or mysterious deadlocks - developers often find themselves scrambling through V$ views and alert logs trying to figure out what's happening.. Today, we're diving into how to monitor Oracle database observability using OpenTelemetry (OTel) for seamless instrumentation and OpenObserve for visualizing and analyzing those metrics and logs.
This setup is straightforward, leverages open-source tools, and delivers real-time insights into your database's health. Whether you're troubleshooting slow queries, tracking resource limits, or auditing access, this guide has you covered. Let's get started, by the end, you'll have a robust Oracle performance monitoring pipeline up and running!
Oracle Database is a powerful, enterprise-grade relational database management system (RDBMS) trusted for its scalability, security, and high availability. Establishing Oracle observability best practices and monitoring your Oracle DB is essential to:
We'll use the OpenTelemetry Collector's OracleDB receiver for metrics and filelog receiver for logs, piping data to OpenObserve for dashboards and alerts.
Before we start, ensure you have:
Oracle Database isn't natively supported on macOS, but Docker makes it easy. For Apple Silicon (M1/M2/M3), we'll use gvenzl/oracle-xe, which works well with emulation.
docker run -d --name oracle-xe -p 1521:1521 -e ORACLE_PASSWORD=password123 gvenzl/oracle-xe
docker logs oracle-xe. 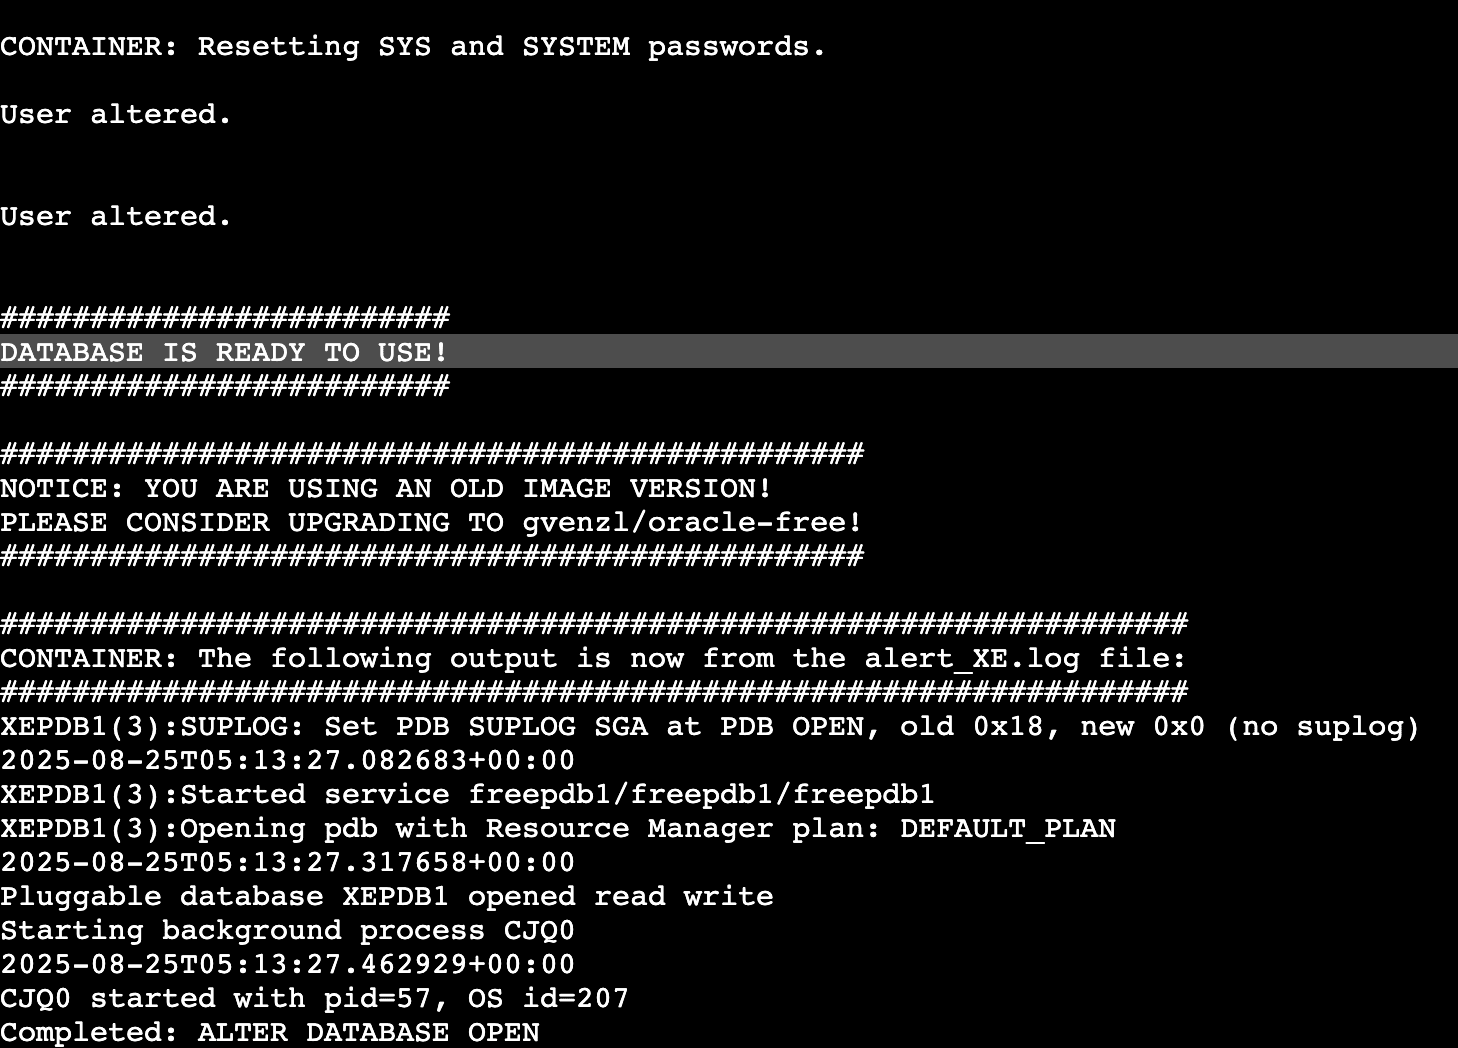
sqlplus system/password123@localhost:1521/XE
CREATE USER otel IDENTIFIED BY password123;
GRANT CONNECT, RESOURCE TO otel;
GRANT SELECT ON V_$SESSION TO otel;
GRANT SELECT ON V_$SYSSTAT TO otel;
GRANT SELECT ON V_$RESOURCE_LIMIT TO otel;
GRANT SELECT ON DBA_TABLESPACES TO otel;
GRANT SELECT ON DBA_DATA_FILES TO otel;
GRANT SELECT ON DBA_TABLESPACE_USAGE_METRICS TO otel;
EXIT;
Next, we need to install the OpenTelemetry Collector.
NOTE: The default Otel Collector doesn't have all the receivers, including the OracleDB one we are going to use to collect metrics from the DB. It has support for receivers like Kafka, Prometheus, Jaeger, etc. So, instead of using opentelemetry-collector, we are going to use opentelemetry-collector-contrib.
v0.115.1 with the latest version number: curl --proto '=https' --tlsv1.2 -fOL https://github.com/open-telemetry/opentelemetry-collector-releases/releases/download/v0.115.1/otelcol-contrib_0.115.1_darwin_arm64.tar.gz
tar -xvf otelcol-contrib_0.115.1_darwin_arm64.tar.gz
sudo mv otelcol-contrib /usr/local/bin/
otelcol-contrib --version
Receivers in the OpenTelemetry Collector are responsible for collecting telemetry data from various sources. They act as the entry point for data into the collector, allowing it to gather metrics, logs, and traces from different systems. Each receiver is designed to handle specific types of data and protocols.
Next, you’ll need to create a configuration file named otel-collector-config.yaml. This file defines how the Collector will behave, including what data it will receive, how it will process that data, and where it will send it.
receivers:
  oracledb:
    endpoint: localhost:1521
    username: otel
    password: password123
    service: XE
    collection_interval: 30s
    timeout: 10s

processors:
  batch:
    send_batch_size: 10000
    timeout: 10s

exporters:
  otlphttp/openobserve:
    endpoint: YOUR_API_ENDPOINT
    headers:
      Authorization: Basic YOUR_AUTH_TOKEN
      stream-name: default

service:
  pipelines:
    metrics:
      receivers: [oracledb]
      processors: [batch]
      exporters: [otlphttp/openobserve]
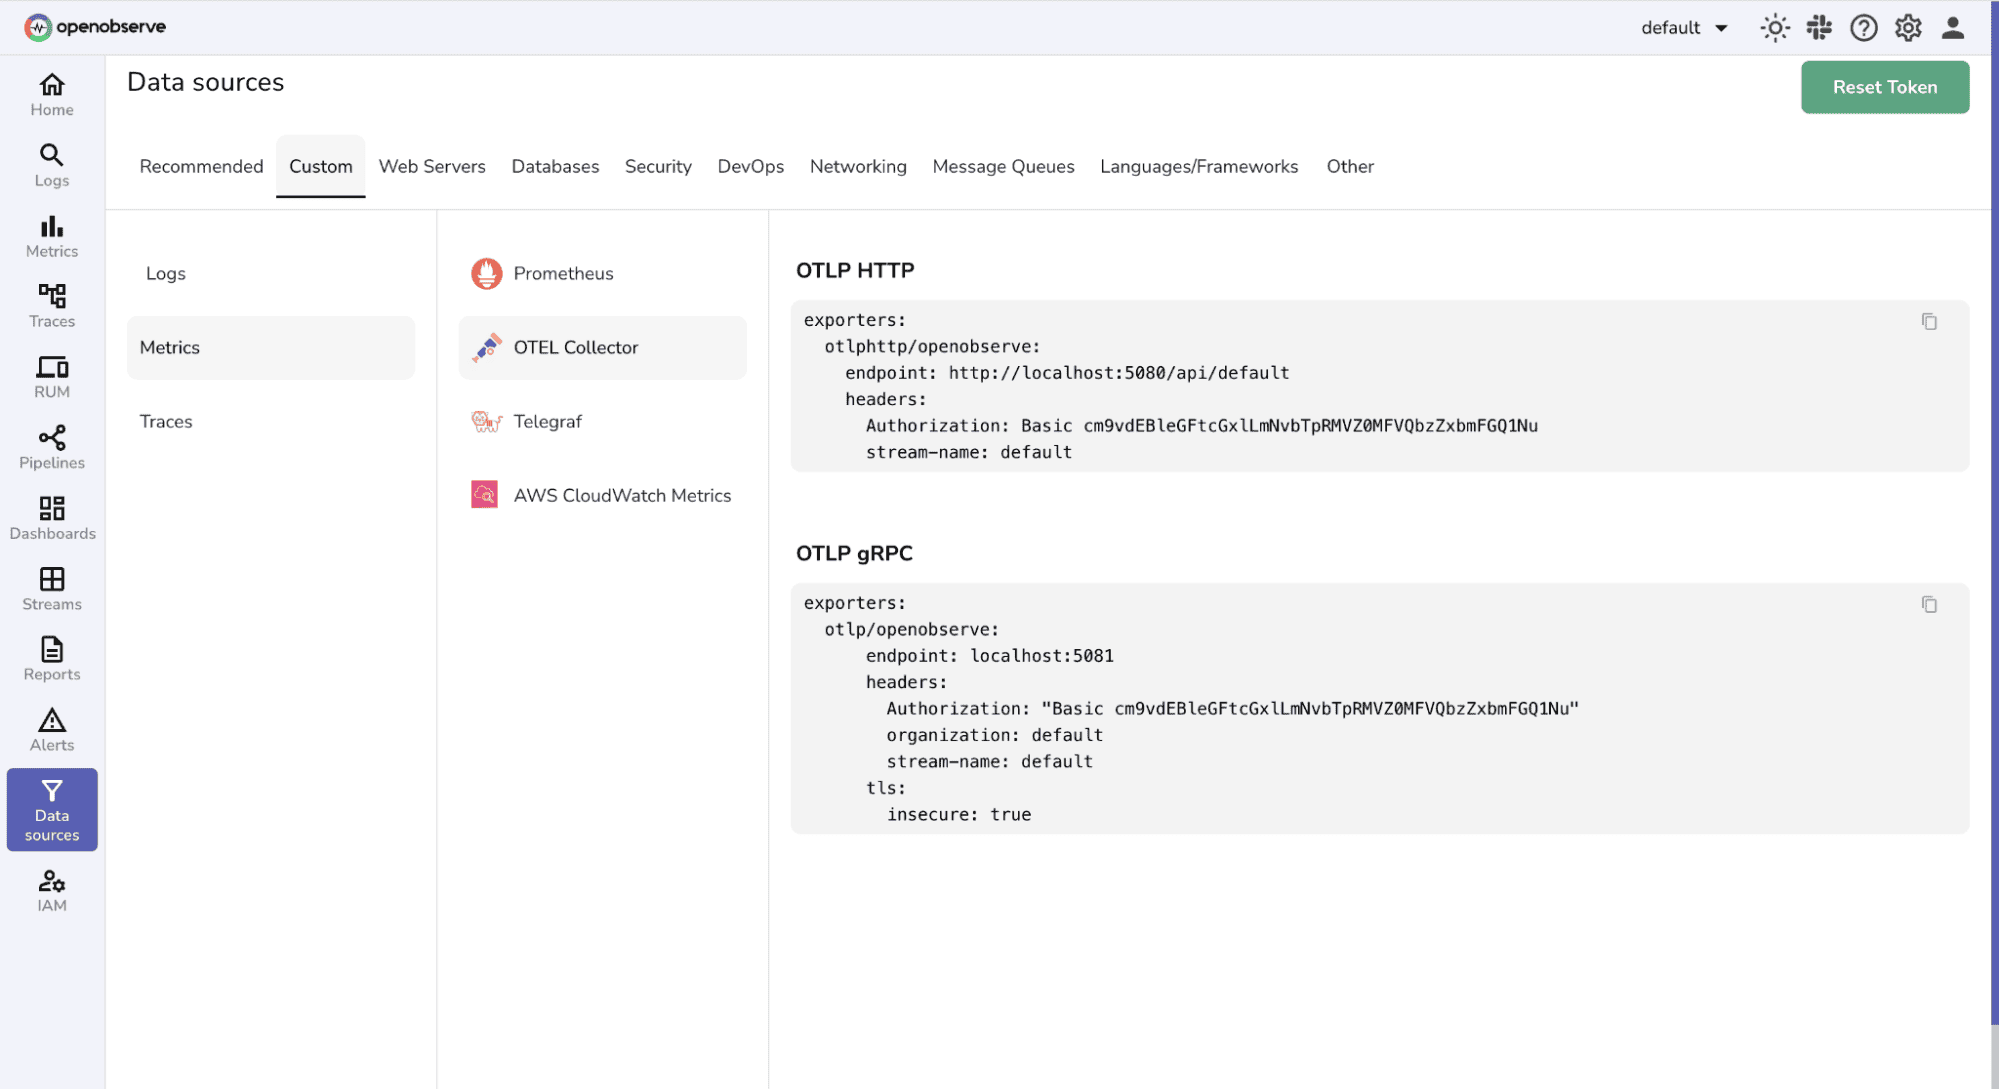
Exporters: Replace YOUR_API_ENDPOINT and YOUR_AUTH_TOKEN with your OpenObserve credentials (find them in your Data Sources -> Custom - > Metrics -> OTEL Collector).
The OracleDB receiver automatically collects these essential metrics:
| Metric | Description | Type |
|---|---|---|
oracledb.cpu_time |
Cumulative CPU time in seconds | Sum |
oracledb.executions |
Total SQL statement executions | Sum |
oracledb.logical_reads |
Number of logical reads | Sum |
oracledb.physical_reads |
Number of physical reads | Sum |
oracledb.sessions.usage |
Count of active sessions | Gauge |
oracledb.tablespace_size.usage |
Used tablespace in bytes | Gauge |
oracledb.user_commits |
Number of user commits | Sum |
oracledb.user_rollbacks |
Number of user rollbacks | Sum |
For a complete list of available metrics and configuration options, refer to the OpenTelemetry Oracle Database Receiver Documentation.
Oracle Database generates various types of logs stored in different directories:
/var/opt/oracle/log /u01/app/oracle/diag To capture these logs, the filelog receiver can be added to your configuration. It tails log files from specified paths:
receivers:
  filelog:
    include:
    - /var/log/example/compressed.log.gz # Replace exact log path as per use case
Note: The exact log paths can vary depending on your Oracle installation and configuration. Adjust the paths in the filelog receiver configuration according to your specific setup.
Start the collector:
otelcol-contrib --config /path/to/your/config.yaml
Check the console for startup logs. Metrics should flow every 30 seconds, and logs will stream as they’re written.
Once your Oracle Database metrics are flowing into OpenObserve, you can create powerful visualizations and dashboards.
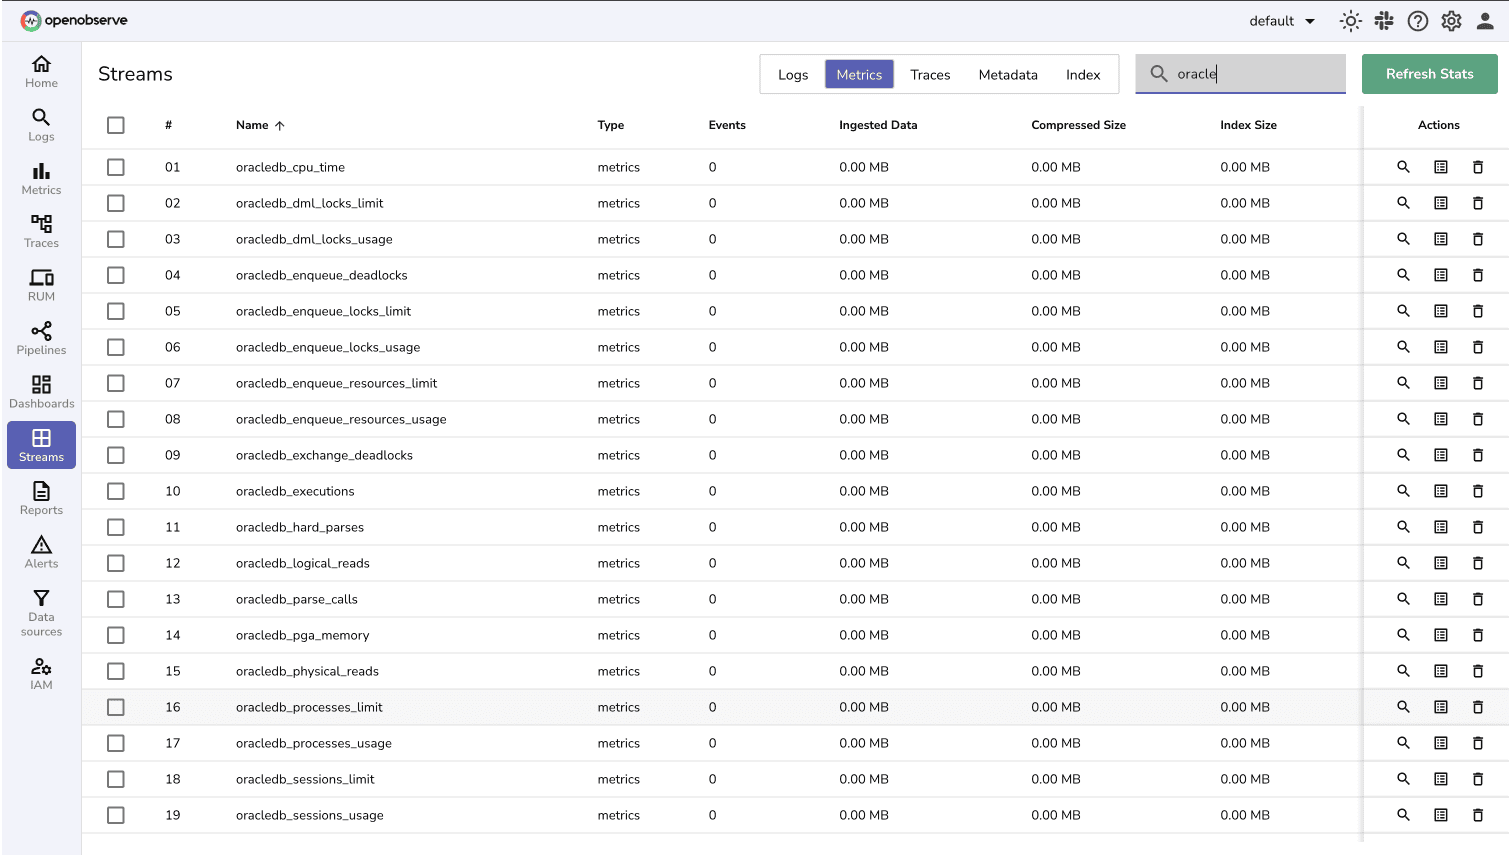
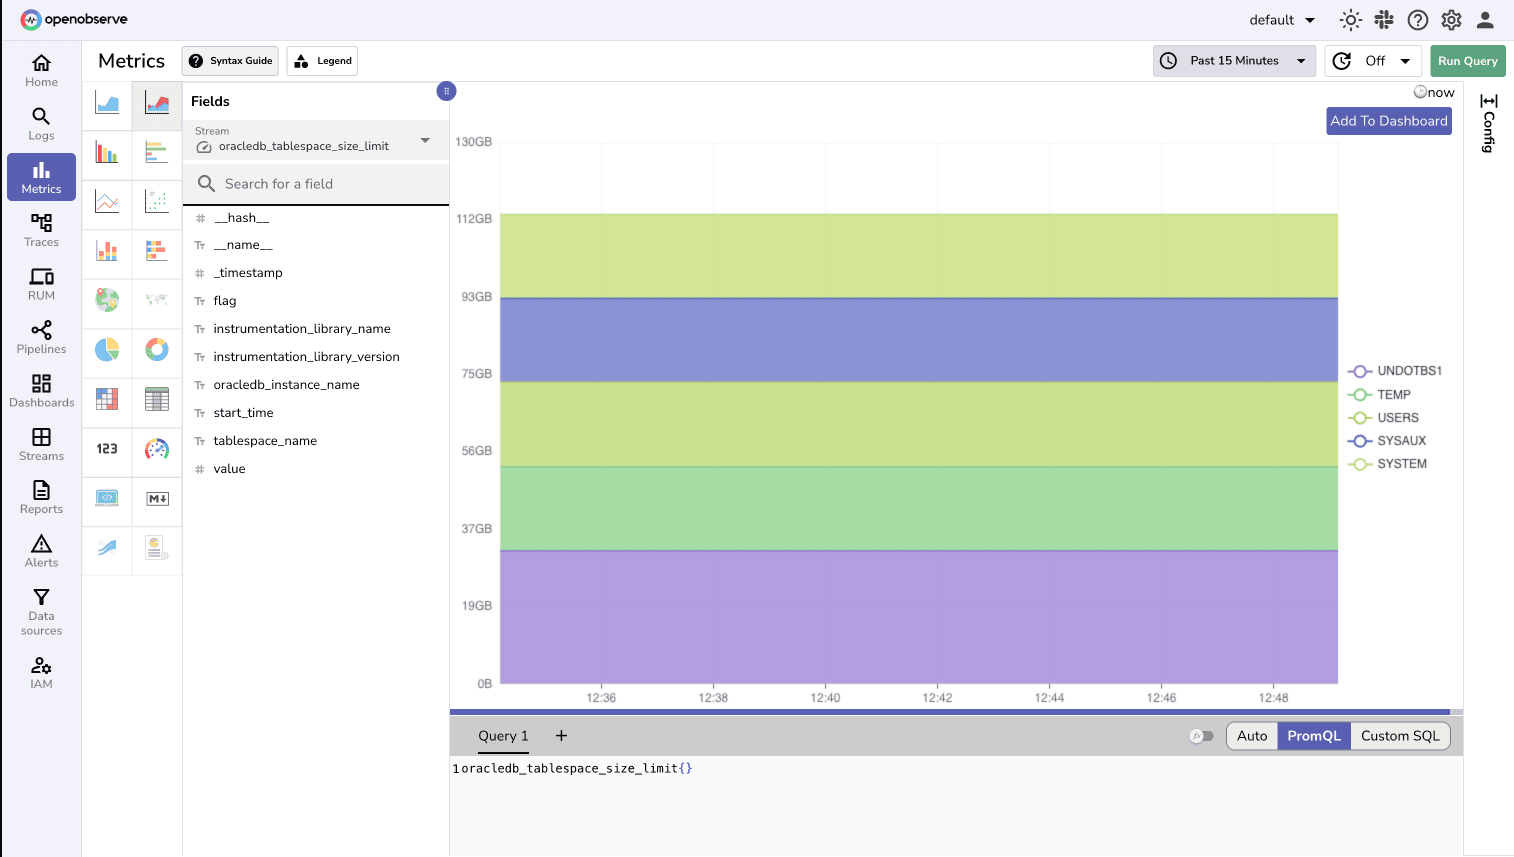
Navigate to the Streams section in OpenObserve to see your Oracle Database metrics flowing in real-time. You should see metrics appearing every 30 seconds as configured in your collector.
You can create custom queries using PromQL/SQL to analyze specific metrics:
Create comprehensive dashboards to monitor your database health. Here are some essential panels you can build:
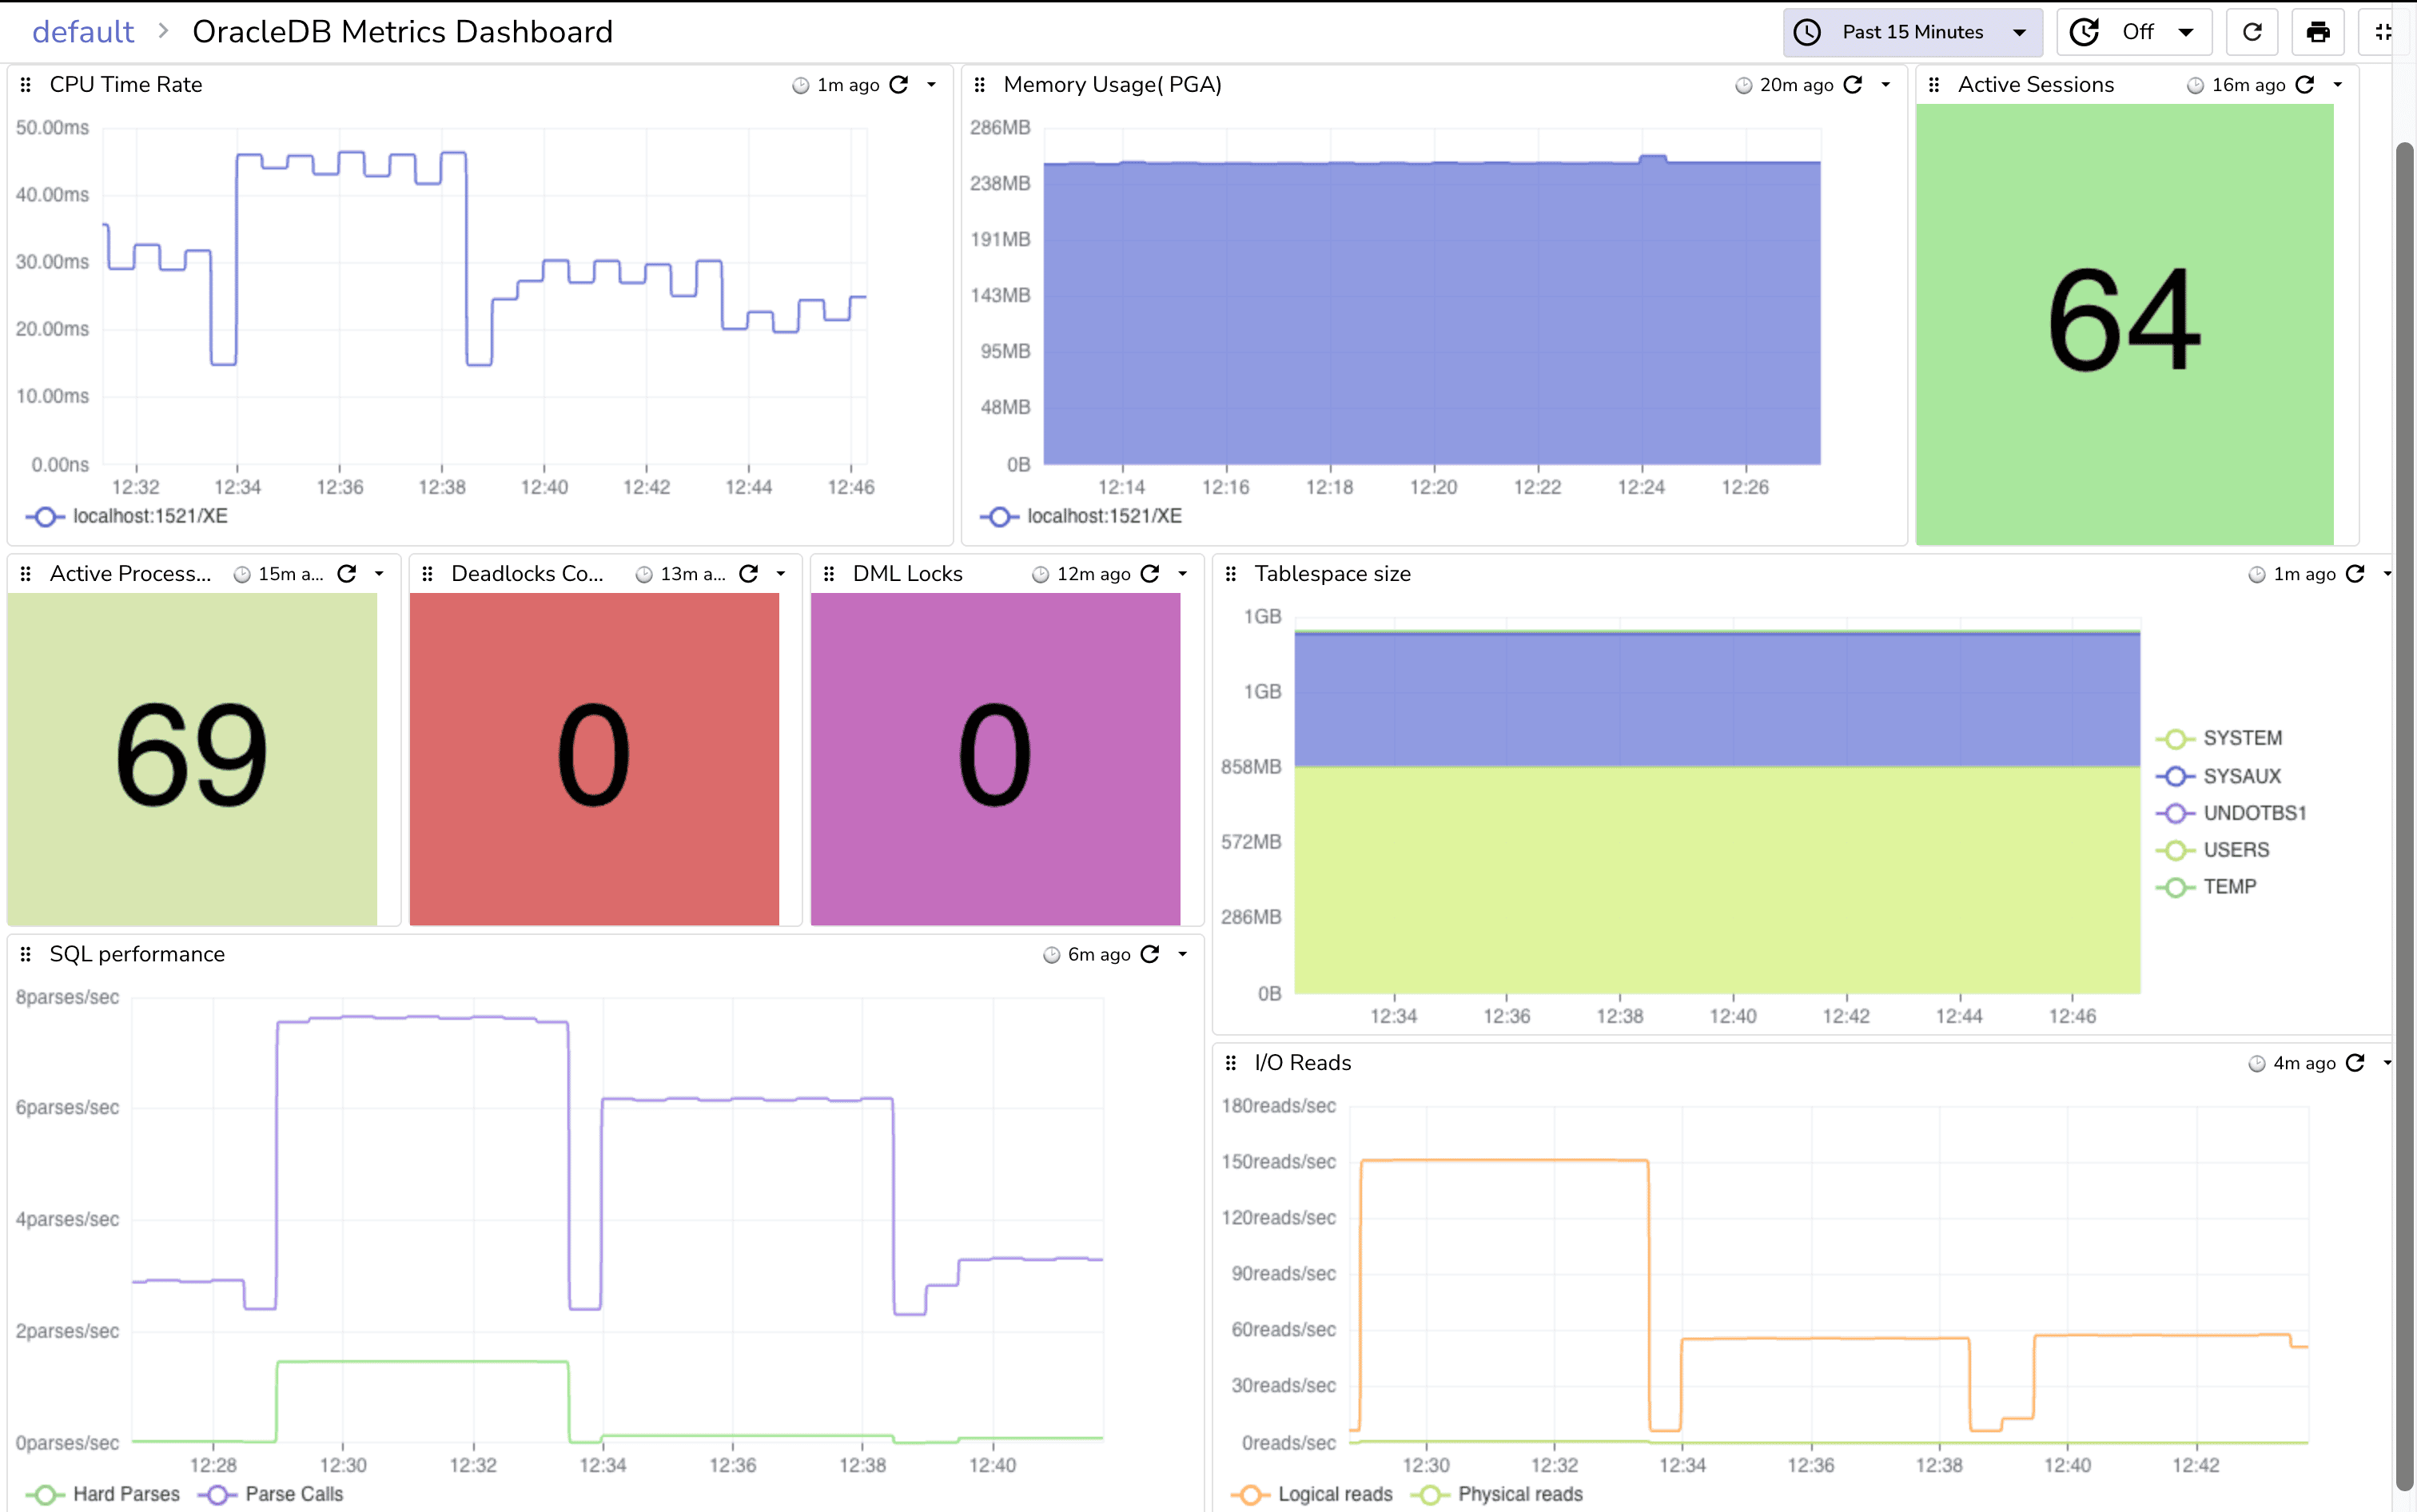
You can download this dashboard from GitHub.
If things don’t work:
docker ps | grep oracle-xe. telnet localhost 1521. sqlplus otel/password123@localhost:1521/XE.XE.docker exec to inspect). include patterns in filelog/oracle.otelcol-contrib --config otel-collector-config.yaml. timeout or adjust collection_interval if queries are slow.Congratulations! You’ve set up comprehensive Oracle Database monitoring with OpenTelemetry and OpenObserve. This pipeline helps you:
For advanced configurations, explore the OracleDB receiver documentation. For additional information on integrating Oracle with OpenObserve, see: Oracle Database Integration Guide.
Want to dive deeper? Check out related blogs:
* How to Set Up AWS RDS Oracle SE2 with OpenObserve: Complete Monitoring Guide
* Sending Logs from Oracle WebLogic to OpenObserve
Sign up for OpenObserve cloud account (14-day free trial) or visit our downloads page to self-host OpenObserve.
Happy monitoring! 🚀
Manas is a passionate Dev and Cloud Advocate with a strong focus on cloud-native technologies, including observability, cloud, kubernetes, and opensource. building bridges between tech and community.


