Exploring osquery Daemon and Shell on Linux for Logging and Observability

Chaitanya Sistla
November 30, 2024
6 min read
Don’t forget to share!
Try OpenObserve Cloud today for more efficient and performant observability.
Osquery is a powerful open-source tool that transforms your operating system into a high-performance relational database. By using SQL-like queries, administrators and security professionals can easily explore the system’s state, monitor activities, and collect valuable logs. This blog delves into setting up osquery on Linux, understanding its daemon and shell, and leveraging the OpenTelemetry (OTel) agent for log ingestion.
⚠️ Important Note ⚠️
| Configuring OpenObserve is out of the scope of this blog but if you want to get started then you can visit Quickstart documentation of O2. |
|---|
Osquery is a framework that allows users to query the system's data as if it were stored in a database. For instance, you can run queries on:
Its dual functionality as a daemon and shell makes osquery versatile for both real-time exploration and continuous monitoring.
osqueryd):osqueryi):For instance, running the shell:
#Type below to run shell
osqueryi
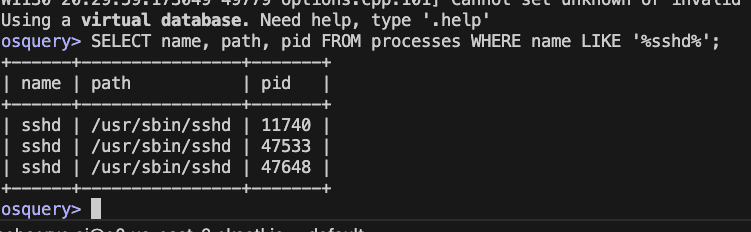
#Copy paste below to list all processes
SELECT name, path, pid FROM processes WHERE name LIKE '%sshd%';
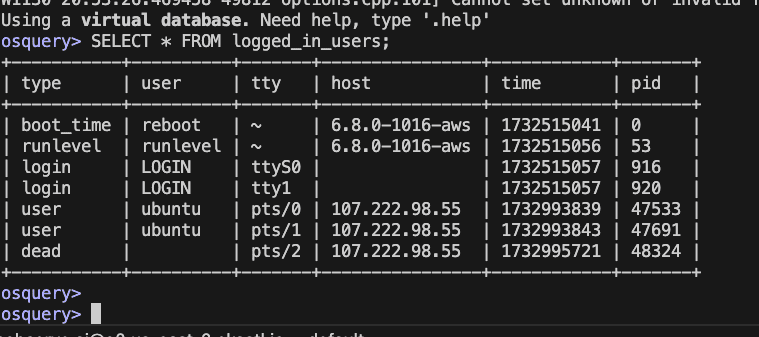
#Copy paste below to list all logged in users
SELECT * FROM logged_in_users;
Osquery uses a virtual table structure to represent system data. These tables fetch live system information, and queries are executed on them as SQL statements.
Following is a simple workflow:
osquery.conf to define what to monitor. Run the following commands to install osquery on Ubuntu
sudo apt update && sudo apt upgrade -y
sudo apt-key adv --keyserver hkp://keyserver.ubuntu.com:80 --recv-keys 1484120AC4E9F8A1A577AEEE97A80C63C9D8B80B
sudo add-apt-repository 'deb [arch=amd64] https://pkg.osquery.io/deb deb main'
sudo apt update
sudo apt install osquery -y
Check the installation by running below command
osqueryi --version
The below file helps log all the events that are returned as results of the queries under /var/log/osquery/
sudo vi /etc/osquery/osquery.conf

#enter the below and save it

{
  "options": {
    "config_plugin": "filesystem",
    "logger_plugin": "filesystem",
    "logger_path": "/var/log/osquery/",
    "disable_logging": false,
    "events_expiry": 3600,
    "schedule_splay_percent": 10,
    "utc": true,
    "verbose": false,
    "worker_threads": 2,
    "enable_monitor": true
  },
  "schedule": {
    "system_info": {
      "query": "SELECT * FROM system_info;",
      "interval": 3600
    },
    "logged_in_users": {
      "query": "SELECT * FROM logged_in_users;",
      "interval": 600
    },
    "listening_ports": {
      "query": "SELECT * FROM listening_ports LEFT JOIN processes ON listening_ports.pid = processes.pid;",
      "interval": 300
    },
    "file_events": {
      "query": "SELECT * FROM file_events WHERE action IN ('CREATED', 'UPDATED', 'DELETED');",
      "interval": 60
    },
    "process_events": {
      "query": "SELECT * FROM process_events;",
      "interval": 60
    },
    "user_groups": {
      "query": "SELECT * FROM user_groups;",
      "interval": 3600
    },
    "failed_logins": {
      "query": "SELECT * FROM last WHERE type = 'failed-login';",
      "interval": 300
    },
    "suspicious_cron_jobs": {
      "query": "SELECT * FROM crontab WHERE command NOT LIKE '%trusted-command%';",
      "interval": 600
    },
    "kernel_modules": {
      "query": "SELECT * FROM kernel_modules;",
      "interval": 600
    },
    "disk_encryption": {
      "query": "SELECT * FROM disk_encryption WHERE encrypted = 0;",
      "interval": 3600
    },
    "network_connections": {
      "query": "SELECT * FROM socket_events WHERE remote_address IS NOT NULL;",
      "interval": 60
    }
  },
  "decorators": {
    "always": [
      "SELECT uuid AS host_uuid FROM system_info;",
      "SELECT hostname FROM system_info;"
    ]
  },
  "file_paths": {
    "etc": [
      "/etc/%%"
    ],
    "logs": [
      "/var/log/%%"
    ]
  },
  "events": {
    "enabled": true,
    "subscriber_blacklist": []
  },
  "packs": {
    "osquery-monitoring": {
      "queries": {
        "osquery_info": {
          "query": "SELECT * FROM osquery_info;",
          "interval": 600
        },
        "schedule_monitor": {
          "query": "SELECT * FROM osquery_schedule WHERE name NOT IN (SELECT DISTINCT name FROM schedule);",
          "interval": 3600
        }
      }
    }
  }
}
sudo systemctl restart osqueryd
sudo systemctl enable osqueryd
Follow the instructions on setting up OTEL on linux on OpenObserve and use the below configuration to start the agent.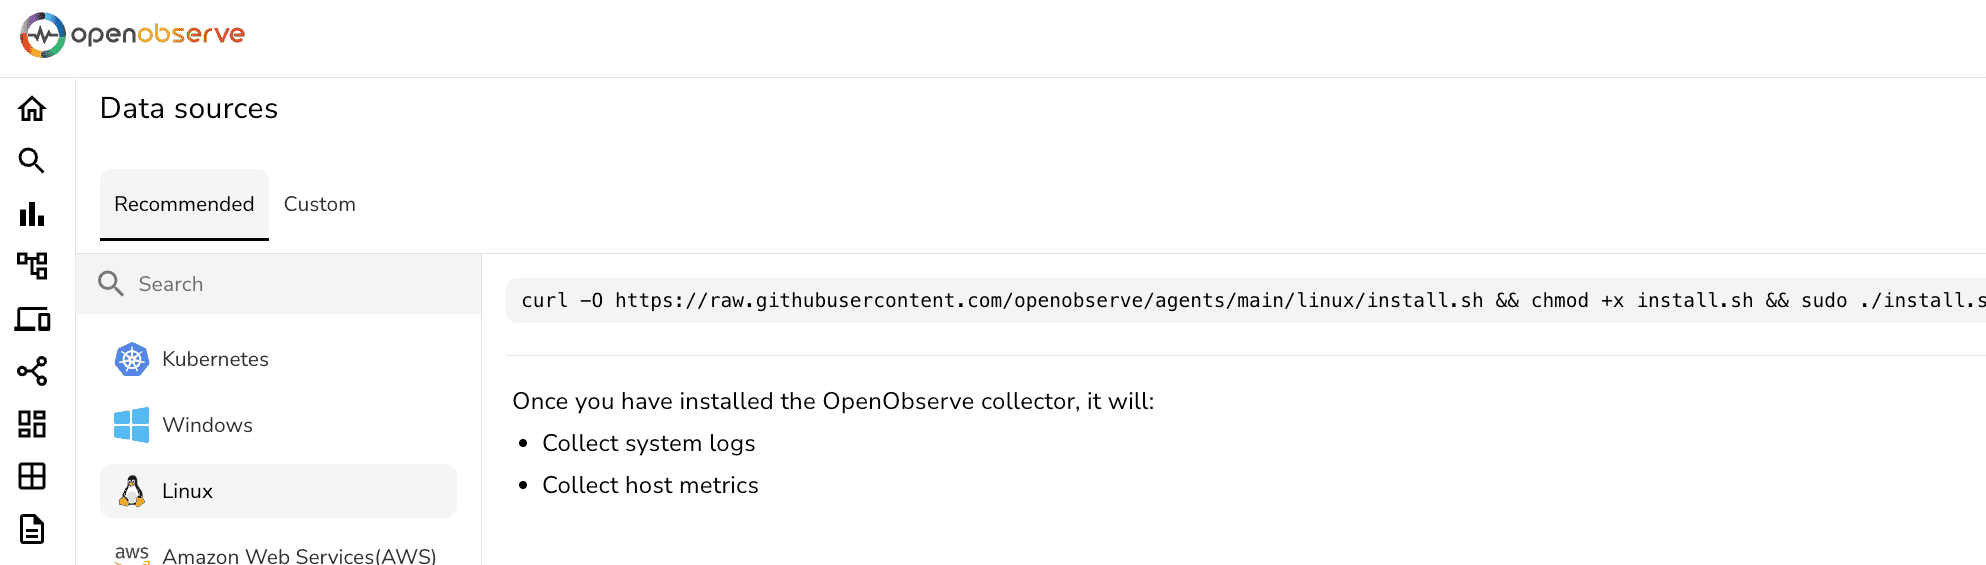
Replace O2_ENDPOINT and O2_TOKEN with the OpenObserve details respectively.
receivers:
  filelog/std:
    include: [ /var/log/osquery/osqueryd.results.log ]
    start_at: beginning
  processors:
  resourcedetection/system:
    detectors: ["system"]
    system:
      hostname_sources: ["os"]
  memory_limiter:
    check_interval: 1s
    limit_percentage: 75
    spike_limit_percentage: 15
  batch:
    send_batch_size: 10000
    timeout: 10s

extensions:
  zpages: {}

exporters:
  otlphttp/openobserve:
    endpoint: <O2_ENDPOINT>
    headers:
      Authorization: "<O2_TOKEN>"
      stream-name: osquery

service:
  extensions: [zpages]
  pipelines:
    logs:
      receivers: [filelog/std]
      processors: [resourcedetection/system, memory_limiter, batch]
      exporters: [otlphttp/openobserve]
Restart otel-collector by running the below command and you will see the logs ingesting to OpenObserve dashboard.
systemctl restart otel-collector
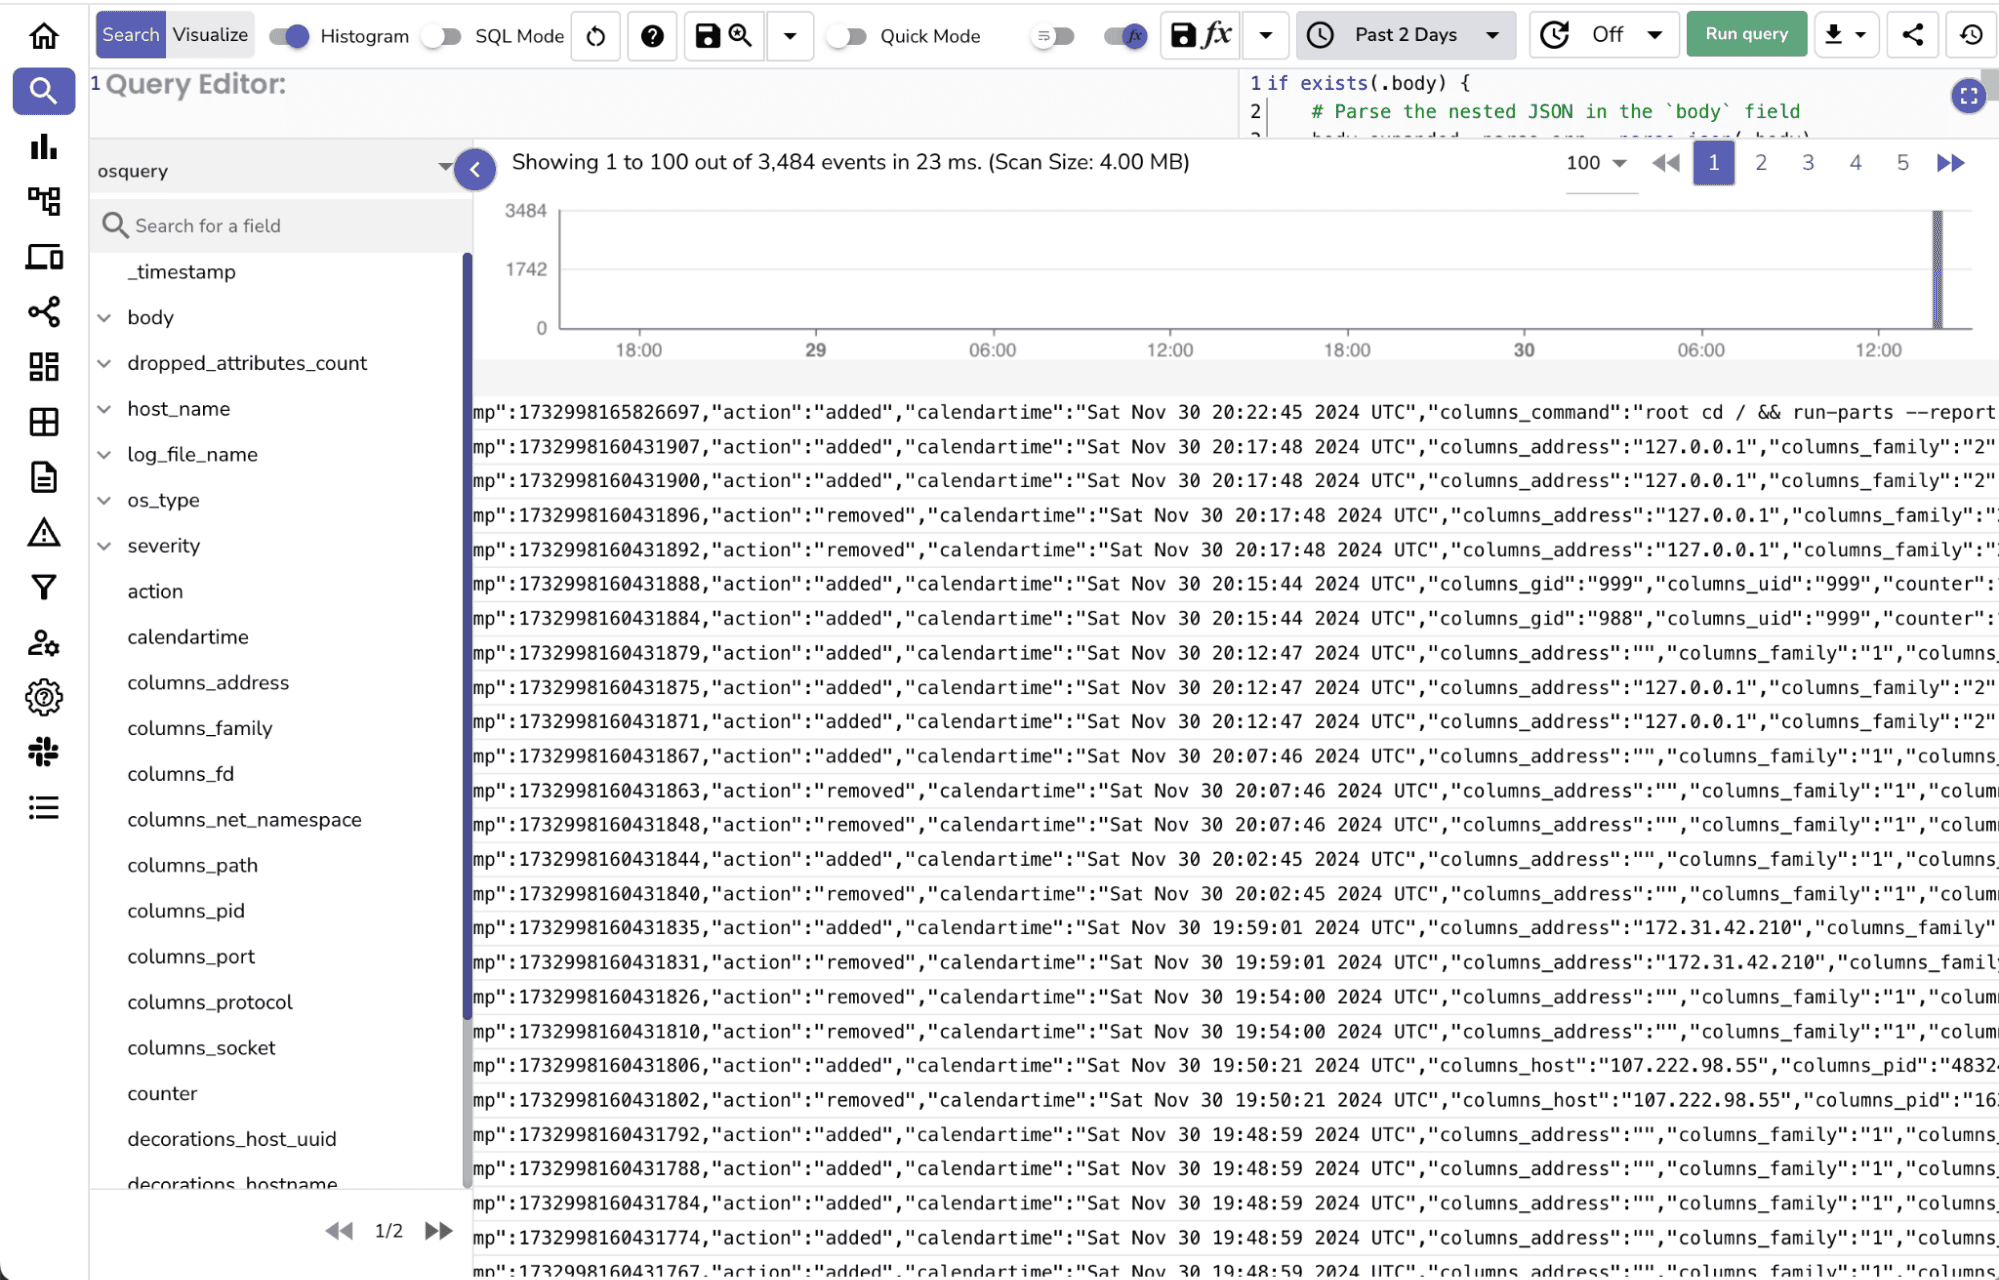
Use the below VRL function to transform the ingested logs by associating with the osquery stream for more detailed analysis.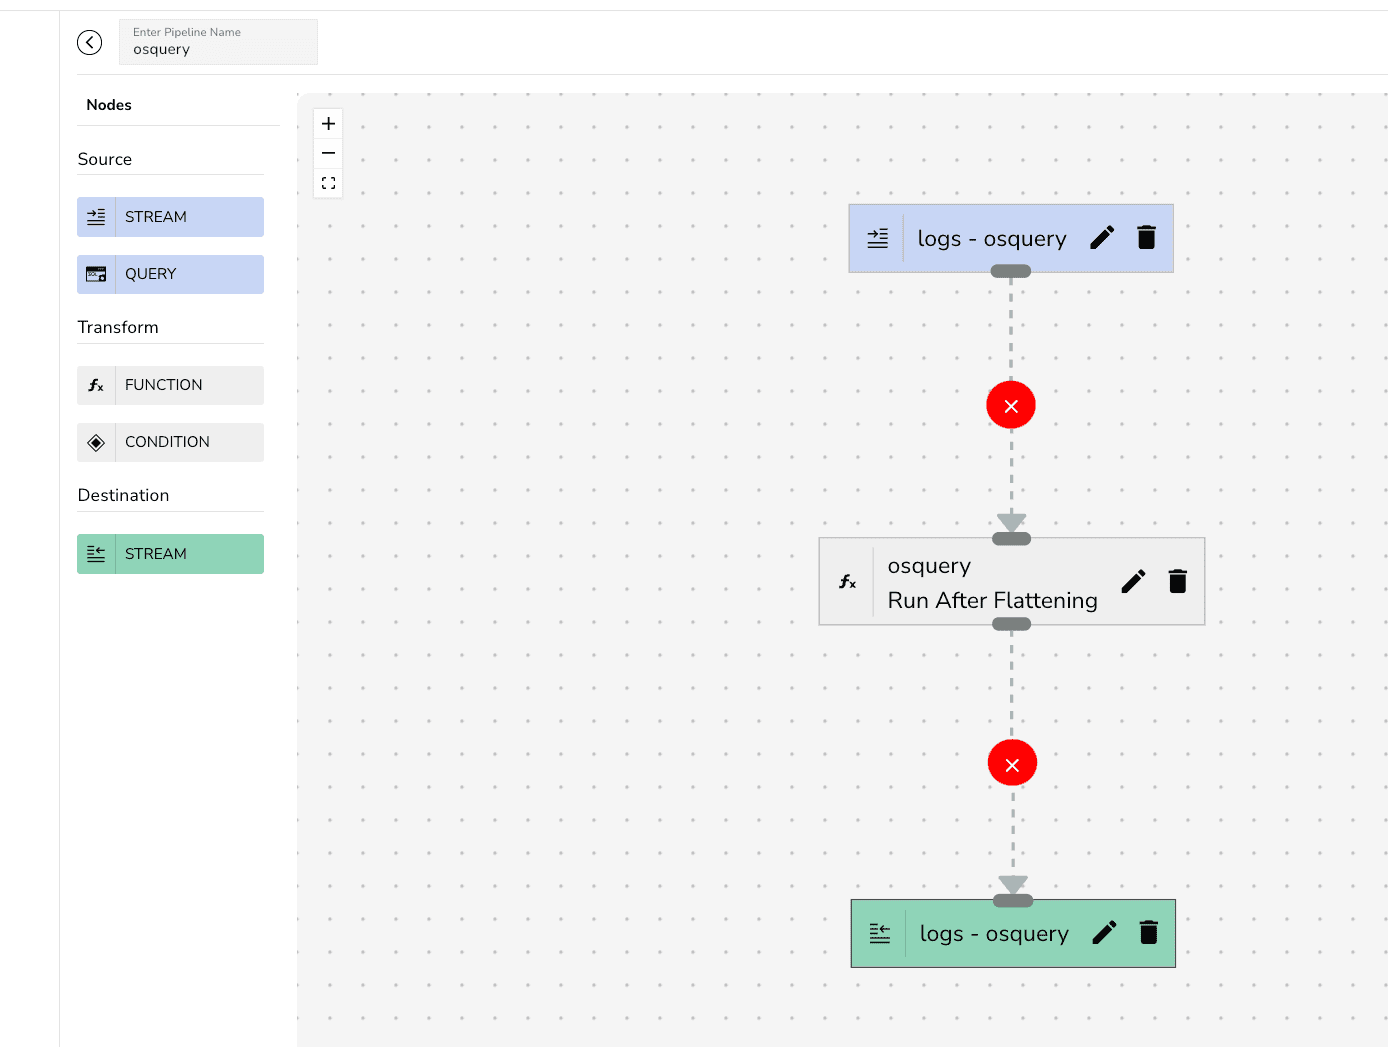
if exists(.body) {
   body_expanded, parse_err = parse_json(.body)
   if parse_err == null {
       ., merge_err = merge(., body_expanded)
       if merge_err == null {
           del(.body)
       }
   }
}
.
The osquery daemon generates two main log types:
Logs are stored in /var/log/osquery/ and can be analyzed locally or sent to a log management tool.
osqueryi before adding them to osquery.conf. OpenObserve serves as a robust observability platform that complements osquery's capabilities by offering centralized log ingestion, analysis, and visualization. By integrating osquery with OpenObserve, you can:
Ready to explore OpenObserve and its features? Sign-up on our cloud to get your account and start ingesting the logs.
Chaitanya Sistla is a Principal Solutions Architect with 17X certifications across Cloud, Data, DevOps, and Cybersecurity. Leveraging extensive startup experience and a focus on MLOps, Chaitanya excels at designing scalable, innovative solutions that drive operational excellence and business transformation.