RED Metrics: Monitoring Requests, Errors, and Latency for Microservices

Simran Kumari
December 01, 2025
8 min read
Don’t forget to share!
Try OpenObserve Cloud today for more efficient and performant observability.
If you are running microservices, you already know how quickly things can go wrong. A small spike in latency, a sudden dip in traffic, or a silent error storm can break user experience long before dashboards catch up. This is why the RED Metrics framework has become a foundational approach for SREs and developers who need clear, fast signals without drowning in noise.
In this article, we’ll explore what RED metrics are, why they matter, how to use them in real-world troubleshooting, and how to implement them in OpenObserve using practical SQL queries and dashboards.
RED stands for Requests, Errors, and Duration, three core indicators that describe how well a service is performing from a user’s perspective.
This framework was designed for request-driven systems, especially microservices that handle HTTP, gRPC, or RPC-style traffic. Unlike the Golden Signals (which also include saturation), RED focuses narrowly on what most directly impacts users.
RED metrics give you a quick health snapshot of any service without needing 20 dashboards or 50 PromQL queries. They work because they capture the symptoms that users feel first: slowness, errors, or missing functionality.
Here’s why they’re so valuable:
If Requests drop suddenly, something upstream broke. If Errors spike, your service is failing. If Duration increases, users will feel latency before you do.
Instead of treating RED as three isolated numbers, think of them as a story.
Requests tell you how much work your service is doing. Tracking this helps you answer simple but critical questions:
A sudden drop in requests usually indicates an upstream routing problem. A sudden spike might mean bots, retries, or cascading failures.
Errors show you how many requests didn’t succeed. Depending on your architecture, this could include:HTTP 5xx responses, Timeouts, Exceptions, gRPC/internal errors
Error patterns often reveal much more than static CPU/memory charts ever will.
Duration tells you how long requests take, but average latency is misleading.
Real systems need p95 and p99 latency to understand tail behavior.
Long-tail latency (e.g., p99) is usually the first thing users complain about.
A small DB slowdown, a cache miss storm, or a slow external service , all of these show up in Duration long before other metrics.
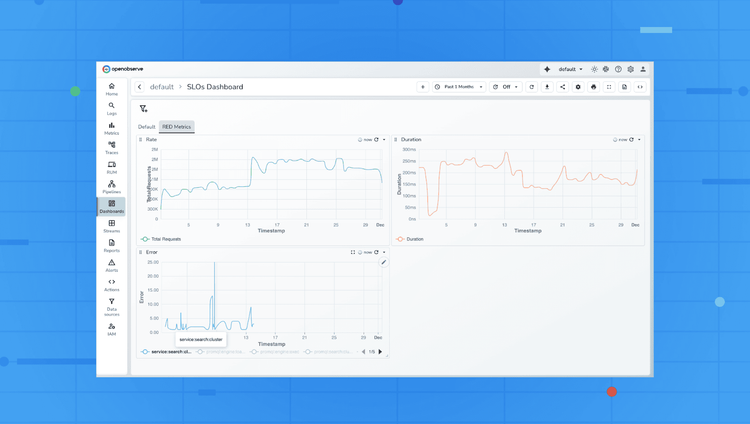
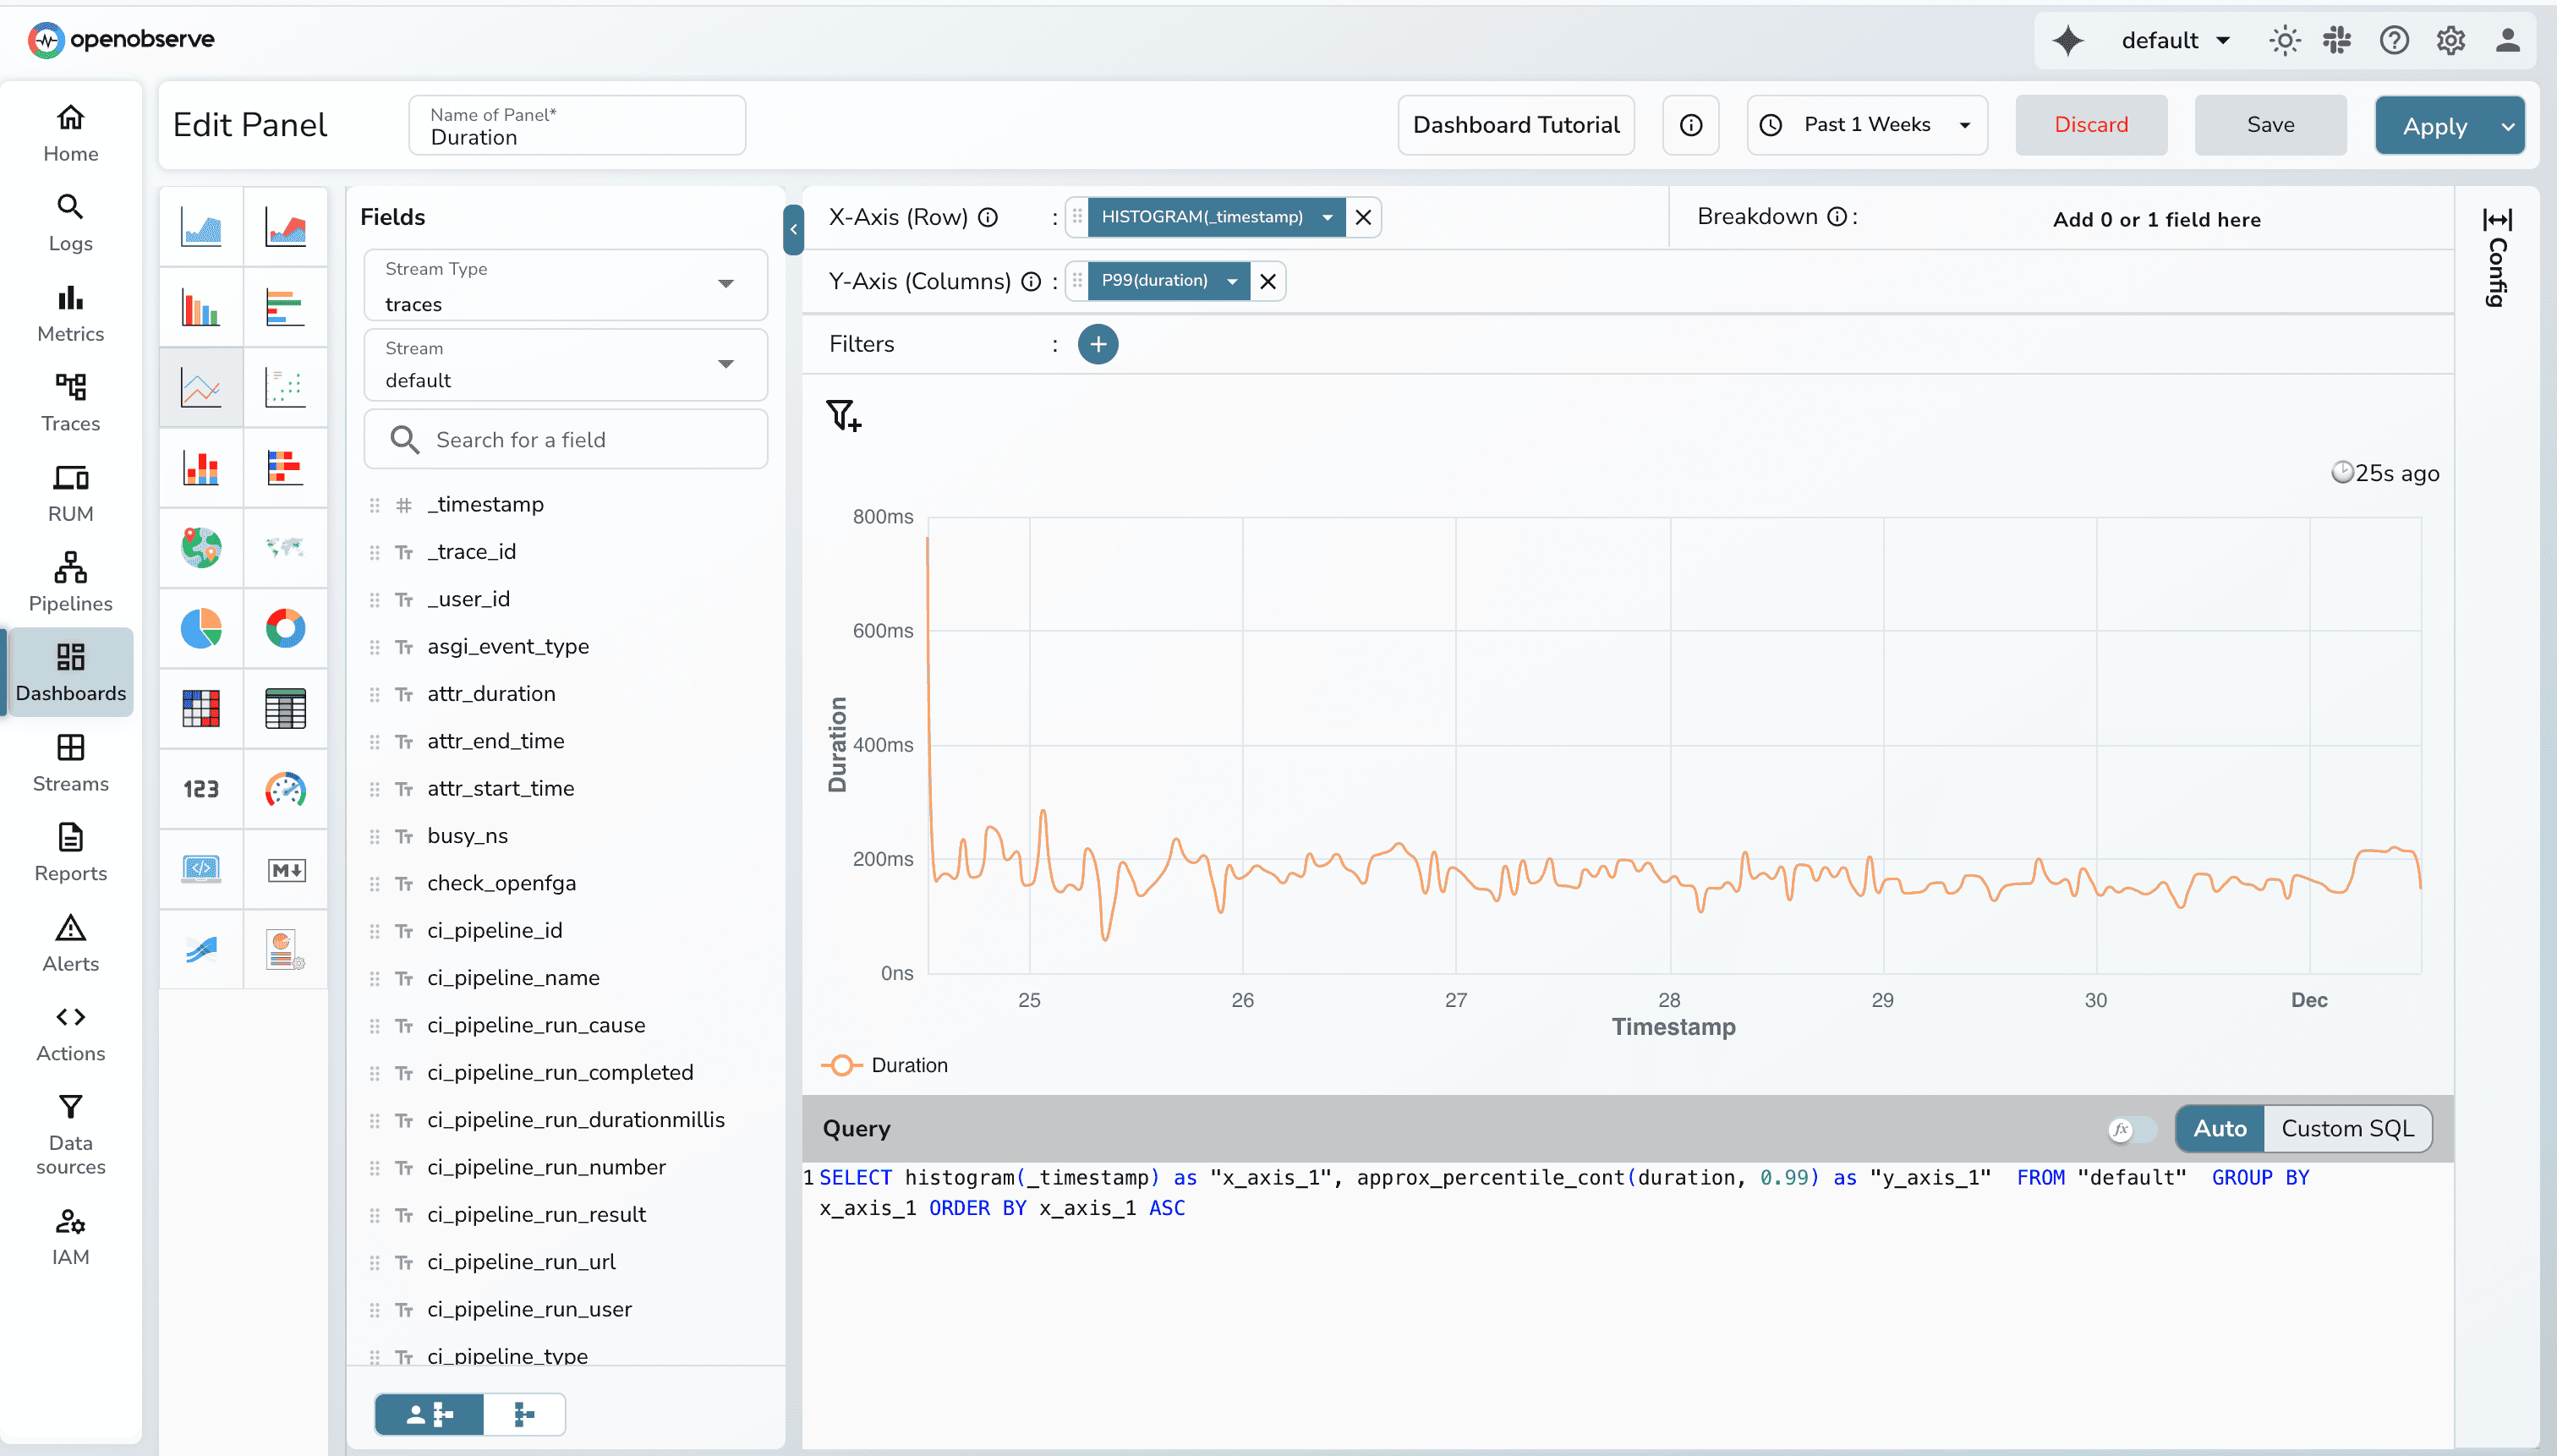
When plotting RED metrics in OpenObserve, the X-axis almost always uses a time histogram. Traces arrive with highly-granular timestamps (often microseconds), so plotting them directly creates unreadable charts. Using histogram(_timestamp) groups spans into consistent time buckets such as 10s, 1 min, or 1 hour, giving a smooth view of how traffic, errors, and latency trend over time.
The size of the bucket adapts automatically based on the dashboard’s time range. A short 30-minute range produces finer buckets, while longer ranges switch to wider buckets to keep charts digestible. This bucketing is crucial for multi-service systems, where thousands of spans arrive every minute.
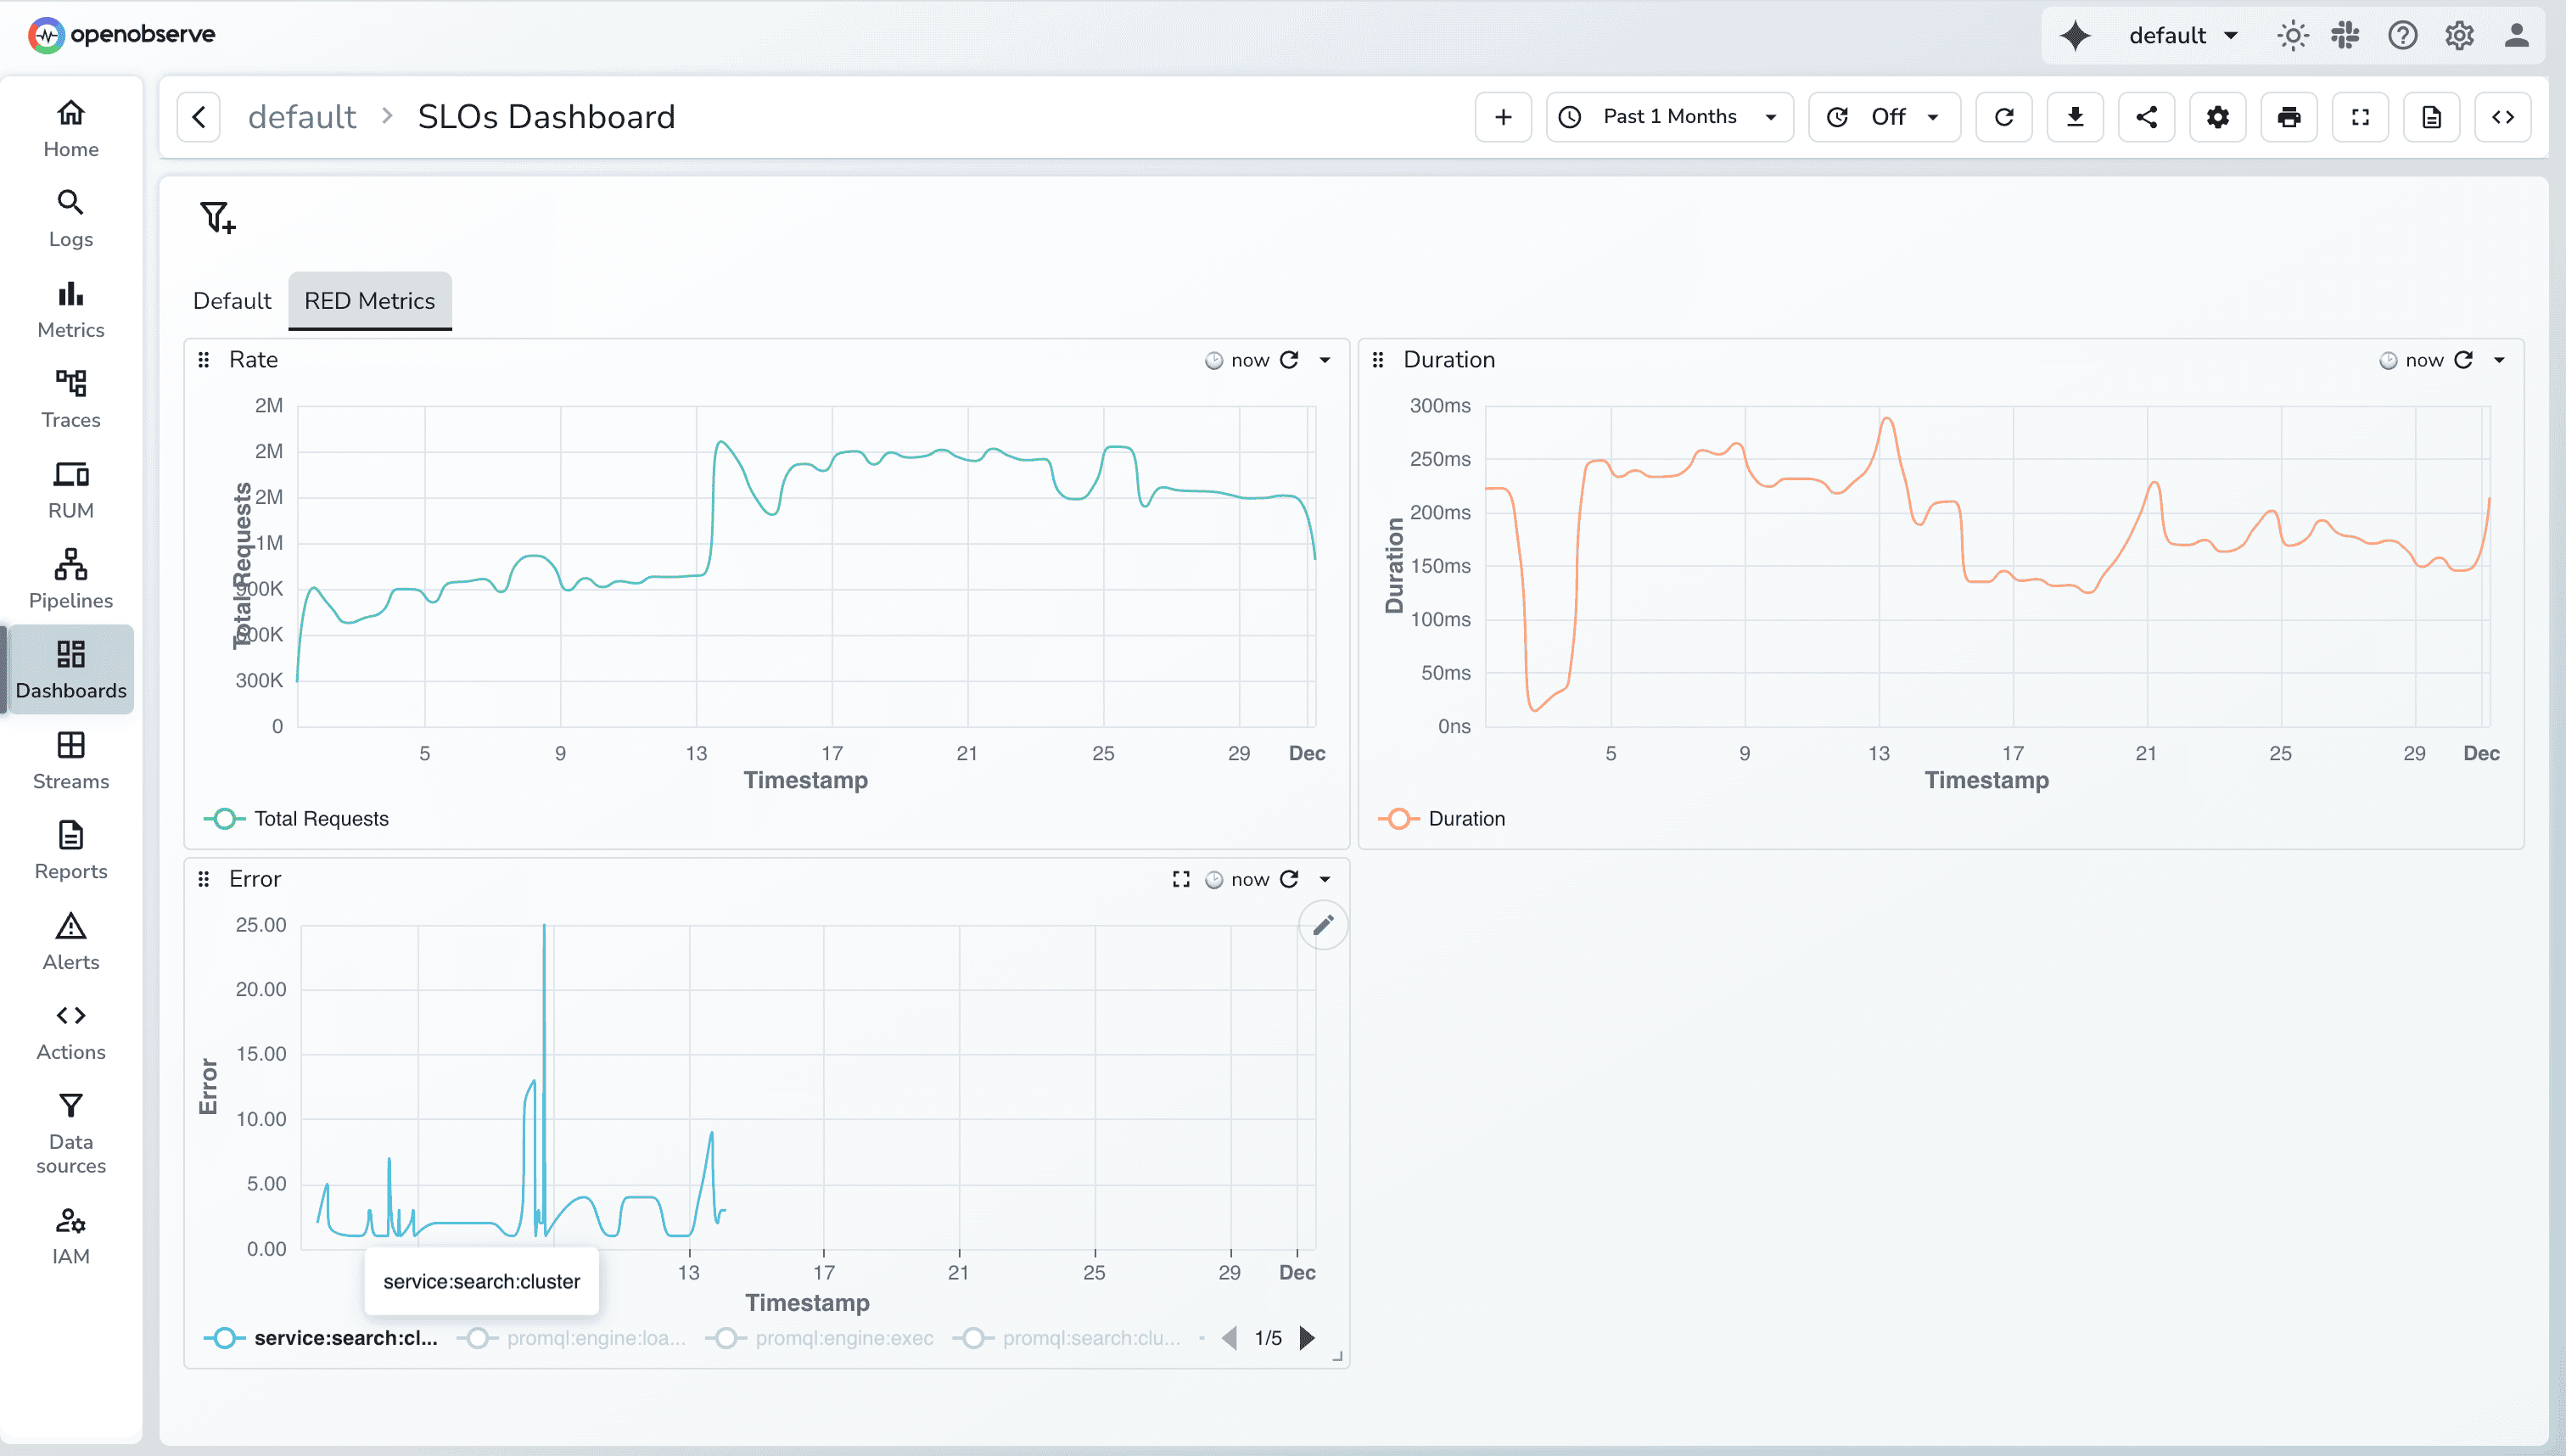
Requests panel can be used to visualize how many request your system processes over time. A line chart works best here because it highlights spikes, surges, and dips clearly. When paired with COUNT(_timestamp) on the Y-axis (which basically counts the number of records), it shows whether load is increasing, decreasing, or behaving abnormally.
Recommended setup
Note: You can filter based on different fields.
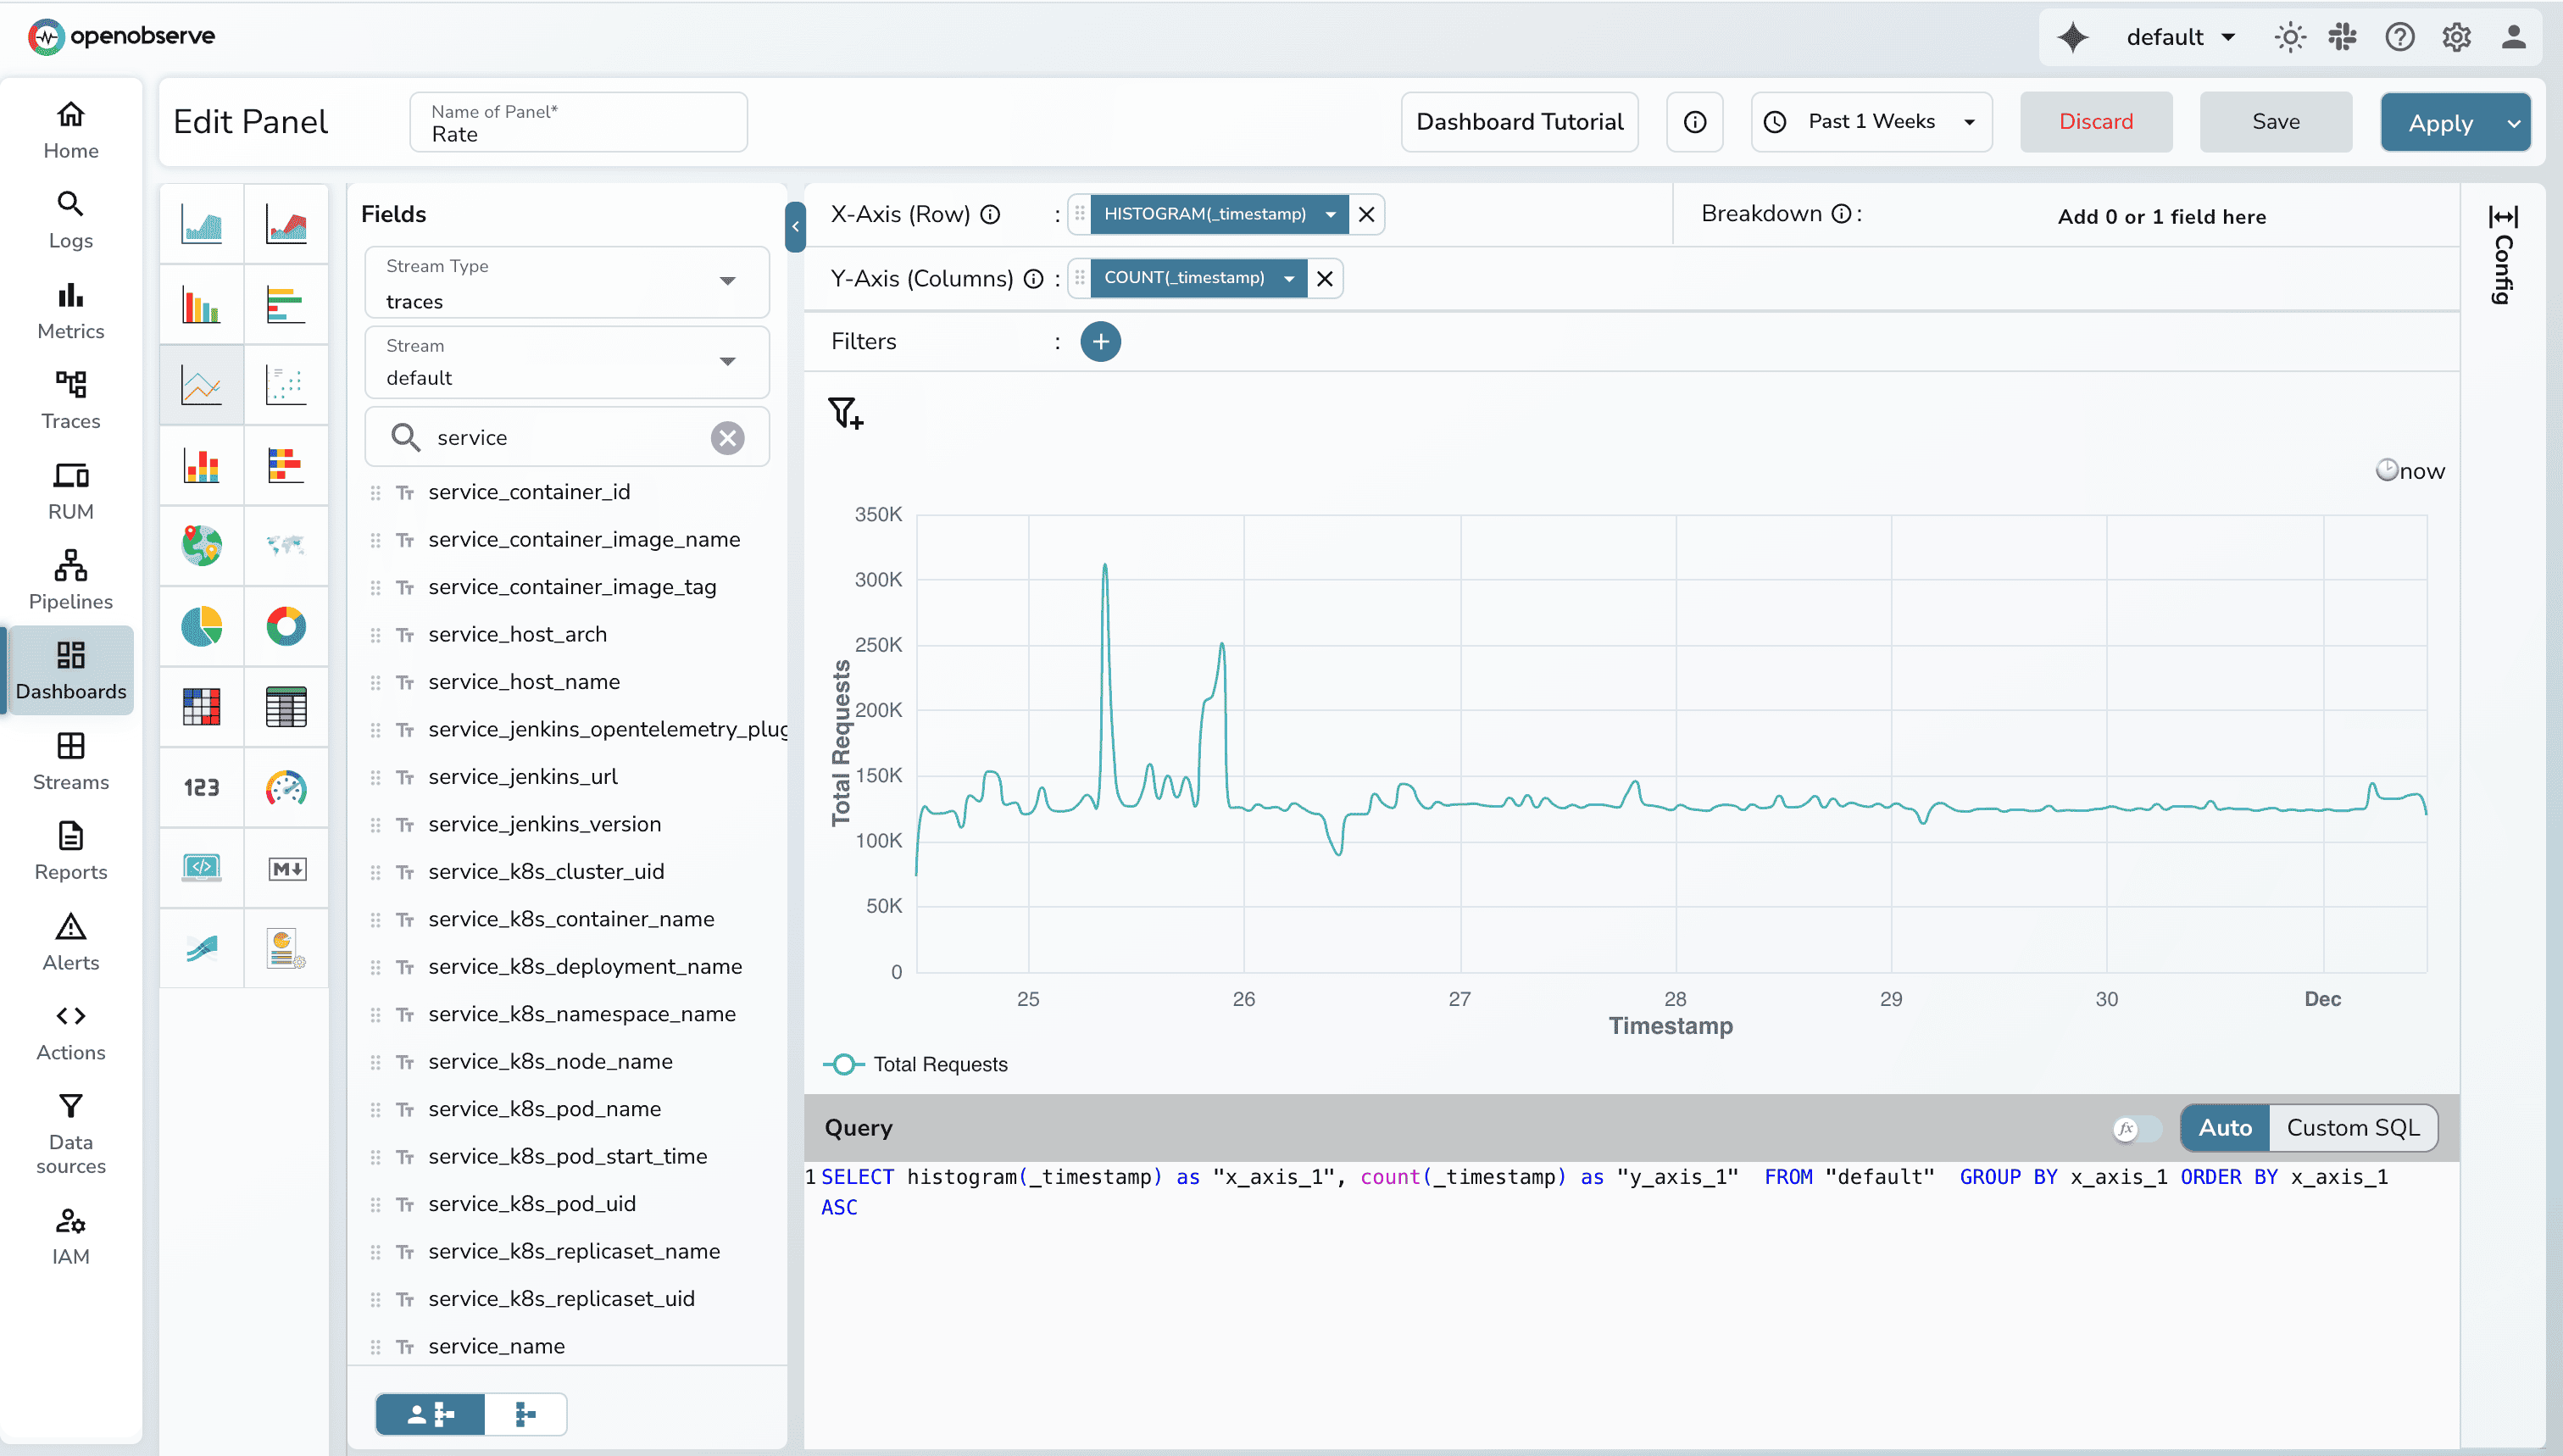
Errors are discrete events and often cluster in bursts. A line/bar chart makes these bursts immediately visible, especially when time buckets are small.
Recommended setup
http_status_code > = 500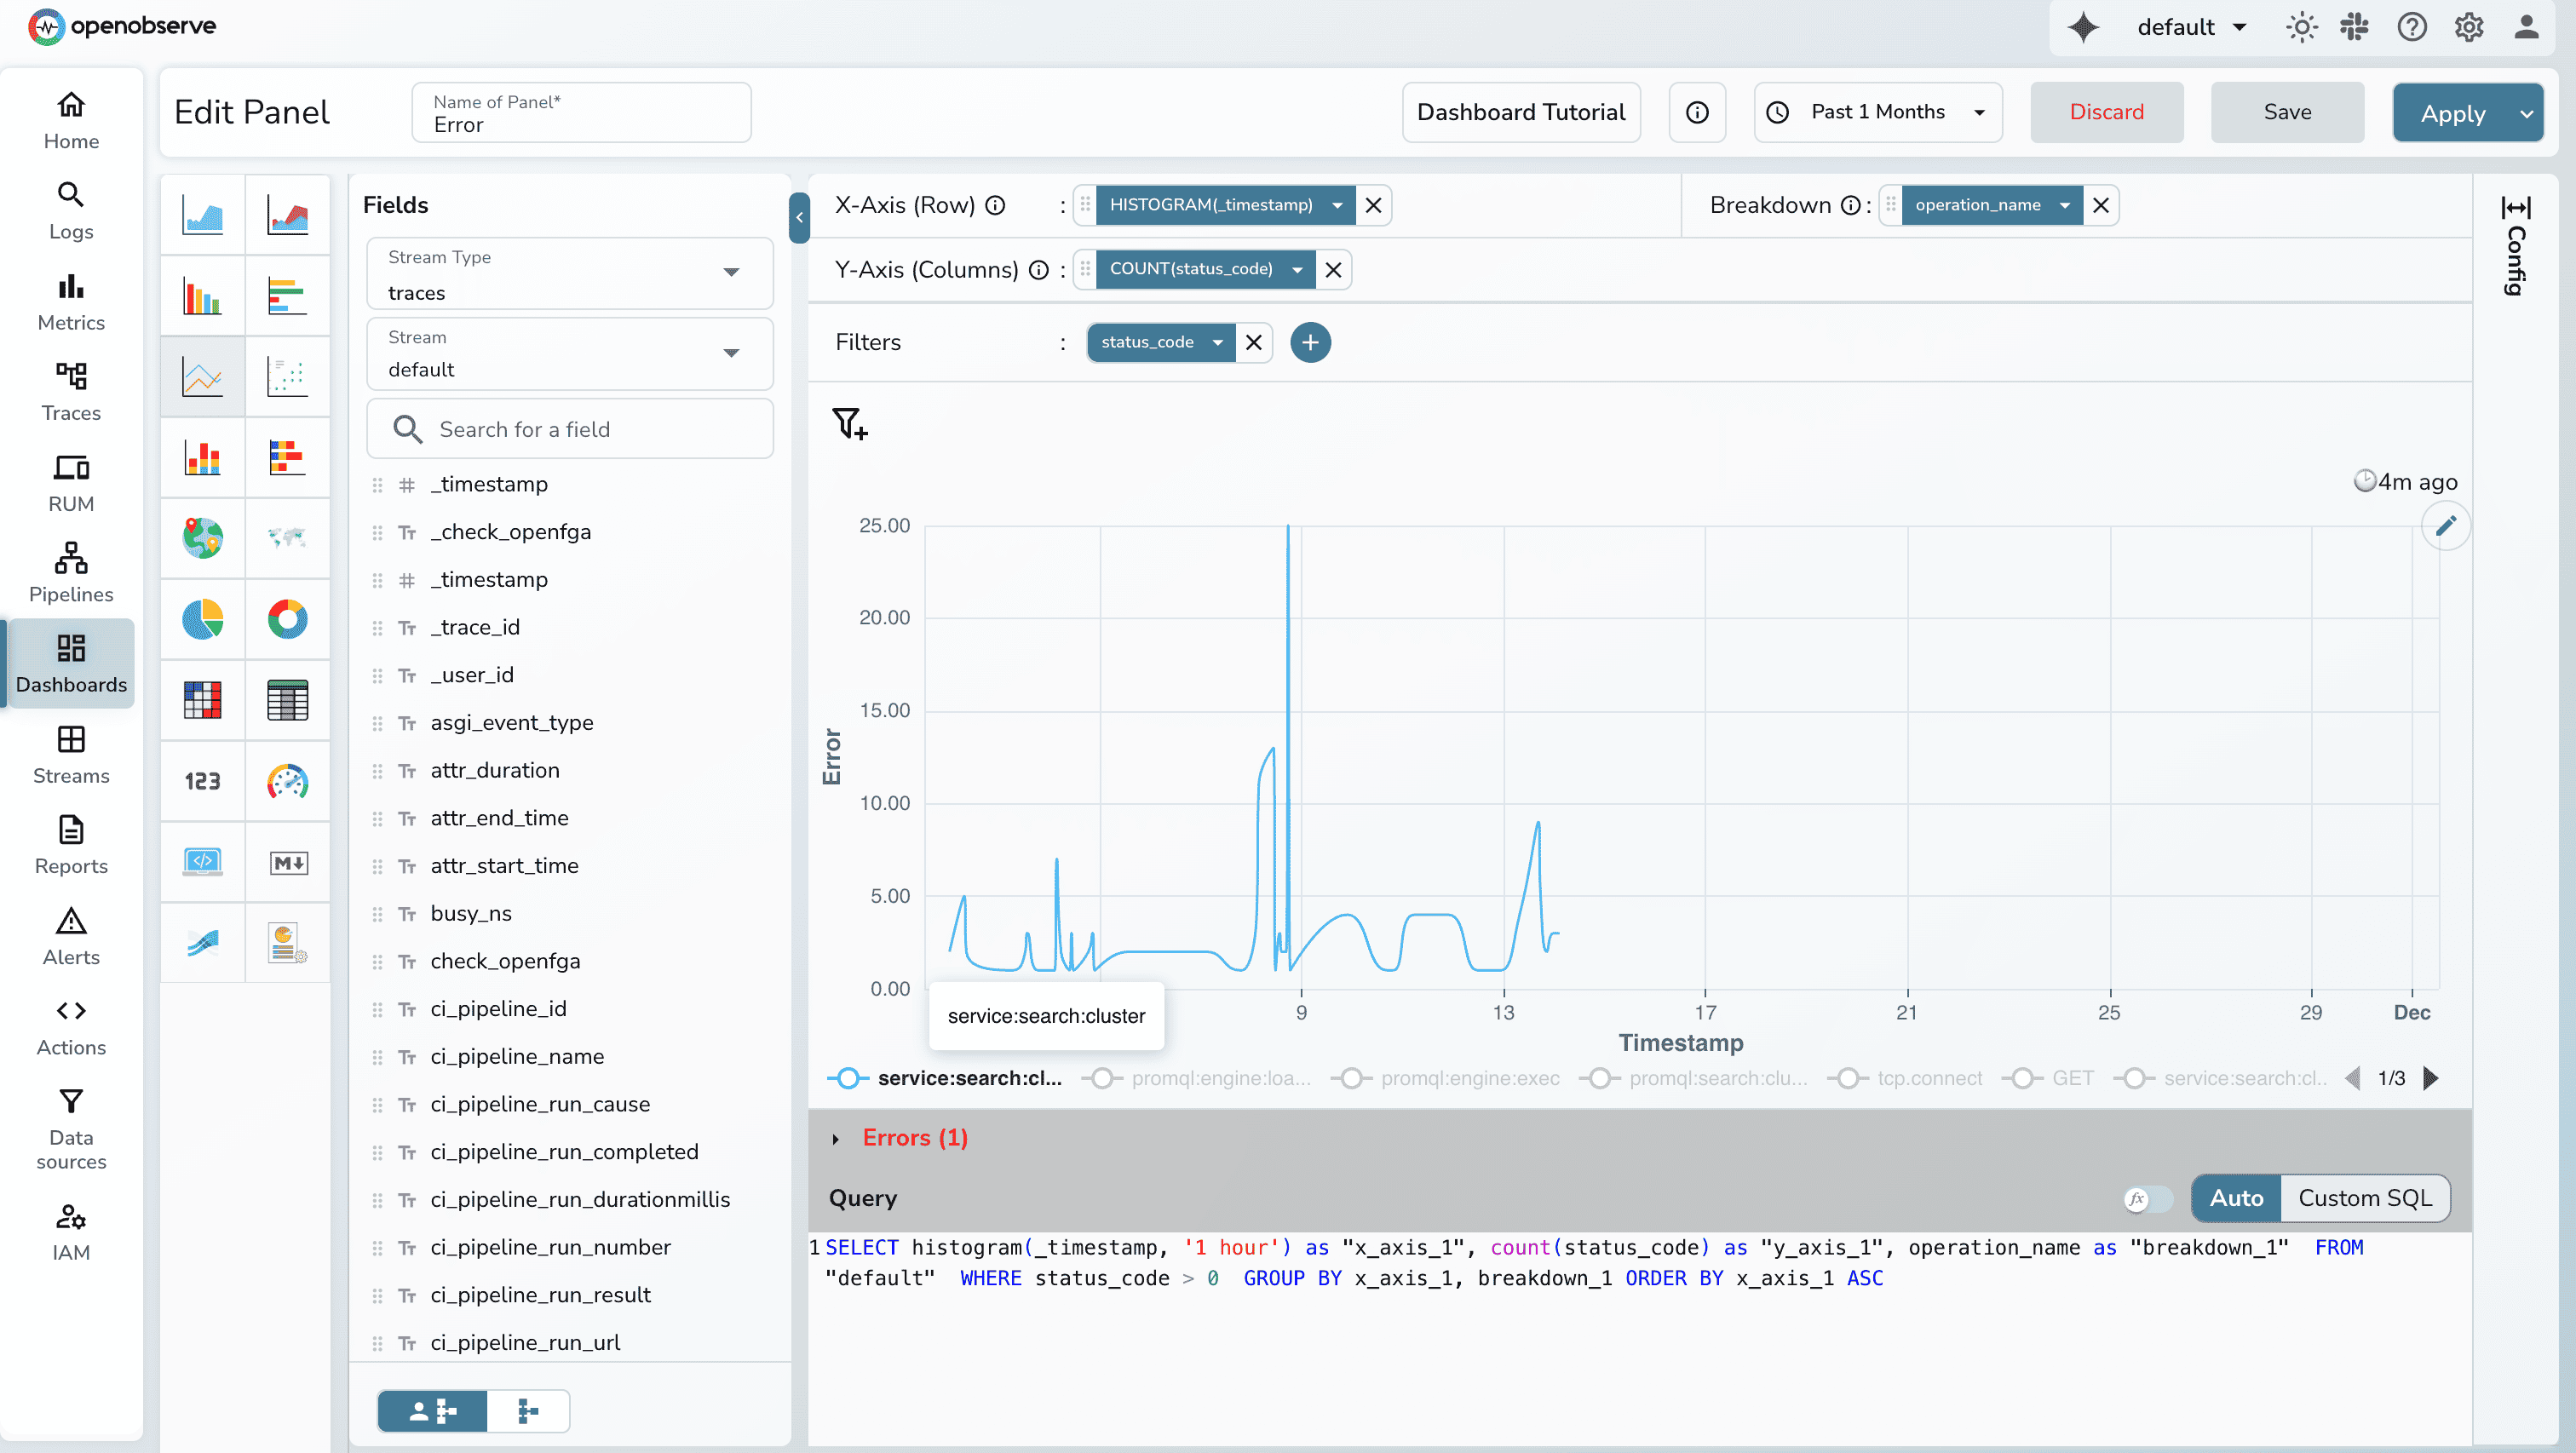
Latency is inherently continuous and best understood as a trend. A line chart emphasizes changes in performance over time and makes it easy to spot gradual degradation or sharp spikes.
For duration data, percentiles such as p95 or p99 are ideal. When plotted over time buckets, these show tail-latency behavior that averages can never capture.
Recommended setup
| Attribute | RED Metrics | Golden Signals |
| Focus | Microservices | Any system |
| Includes Saturation? | No | Yes |
| Best For | API-driven workloads | Infrastructure + Services |
| SLO Mapping | Very direct | Broader |
OpenObserve automatically derives Rate, Error, and Duration metrics from your OpenTelemetry traces and visualizes them at the top of the Traces UI. As soon as spans arrive, OpenObserve computes request throughput, error counts, and latency percentiles without requiring any metric exporters, Prometheus setups, or custom dashboards. This gives you RED insights the moment your tracing pipeline is connected.
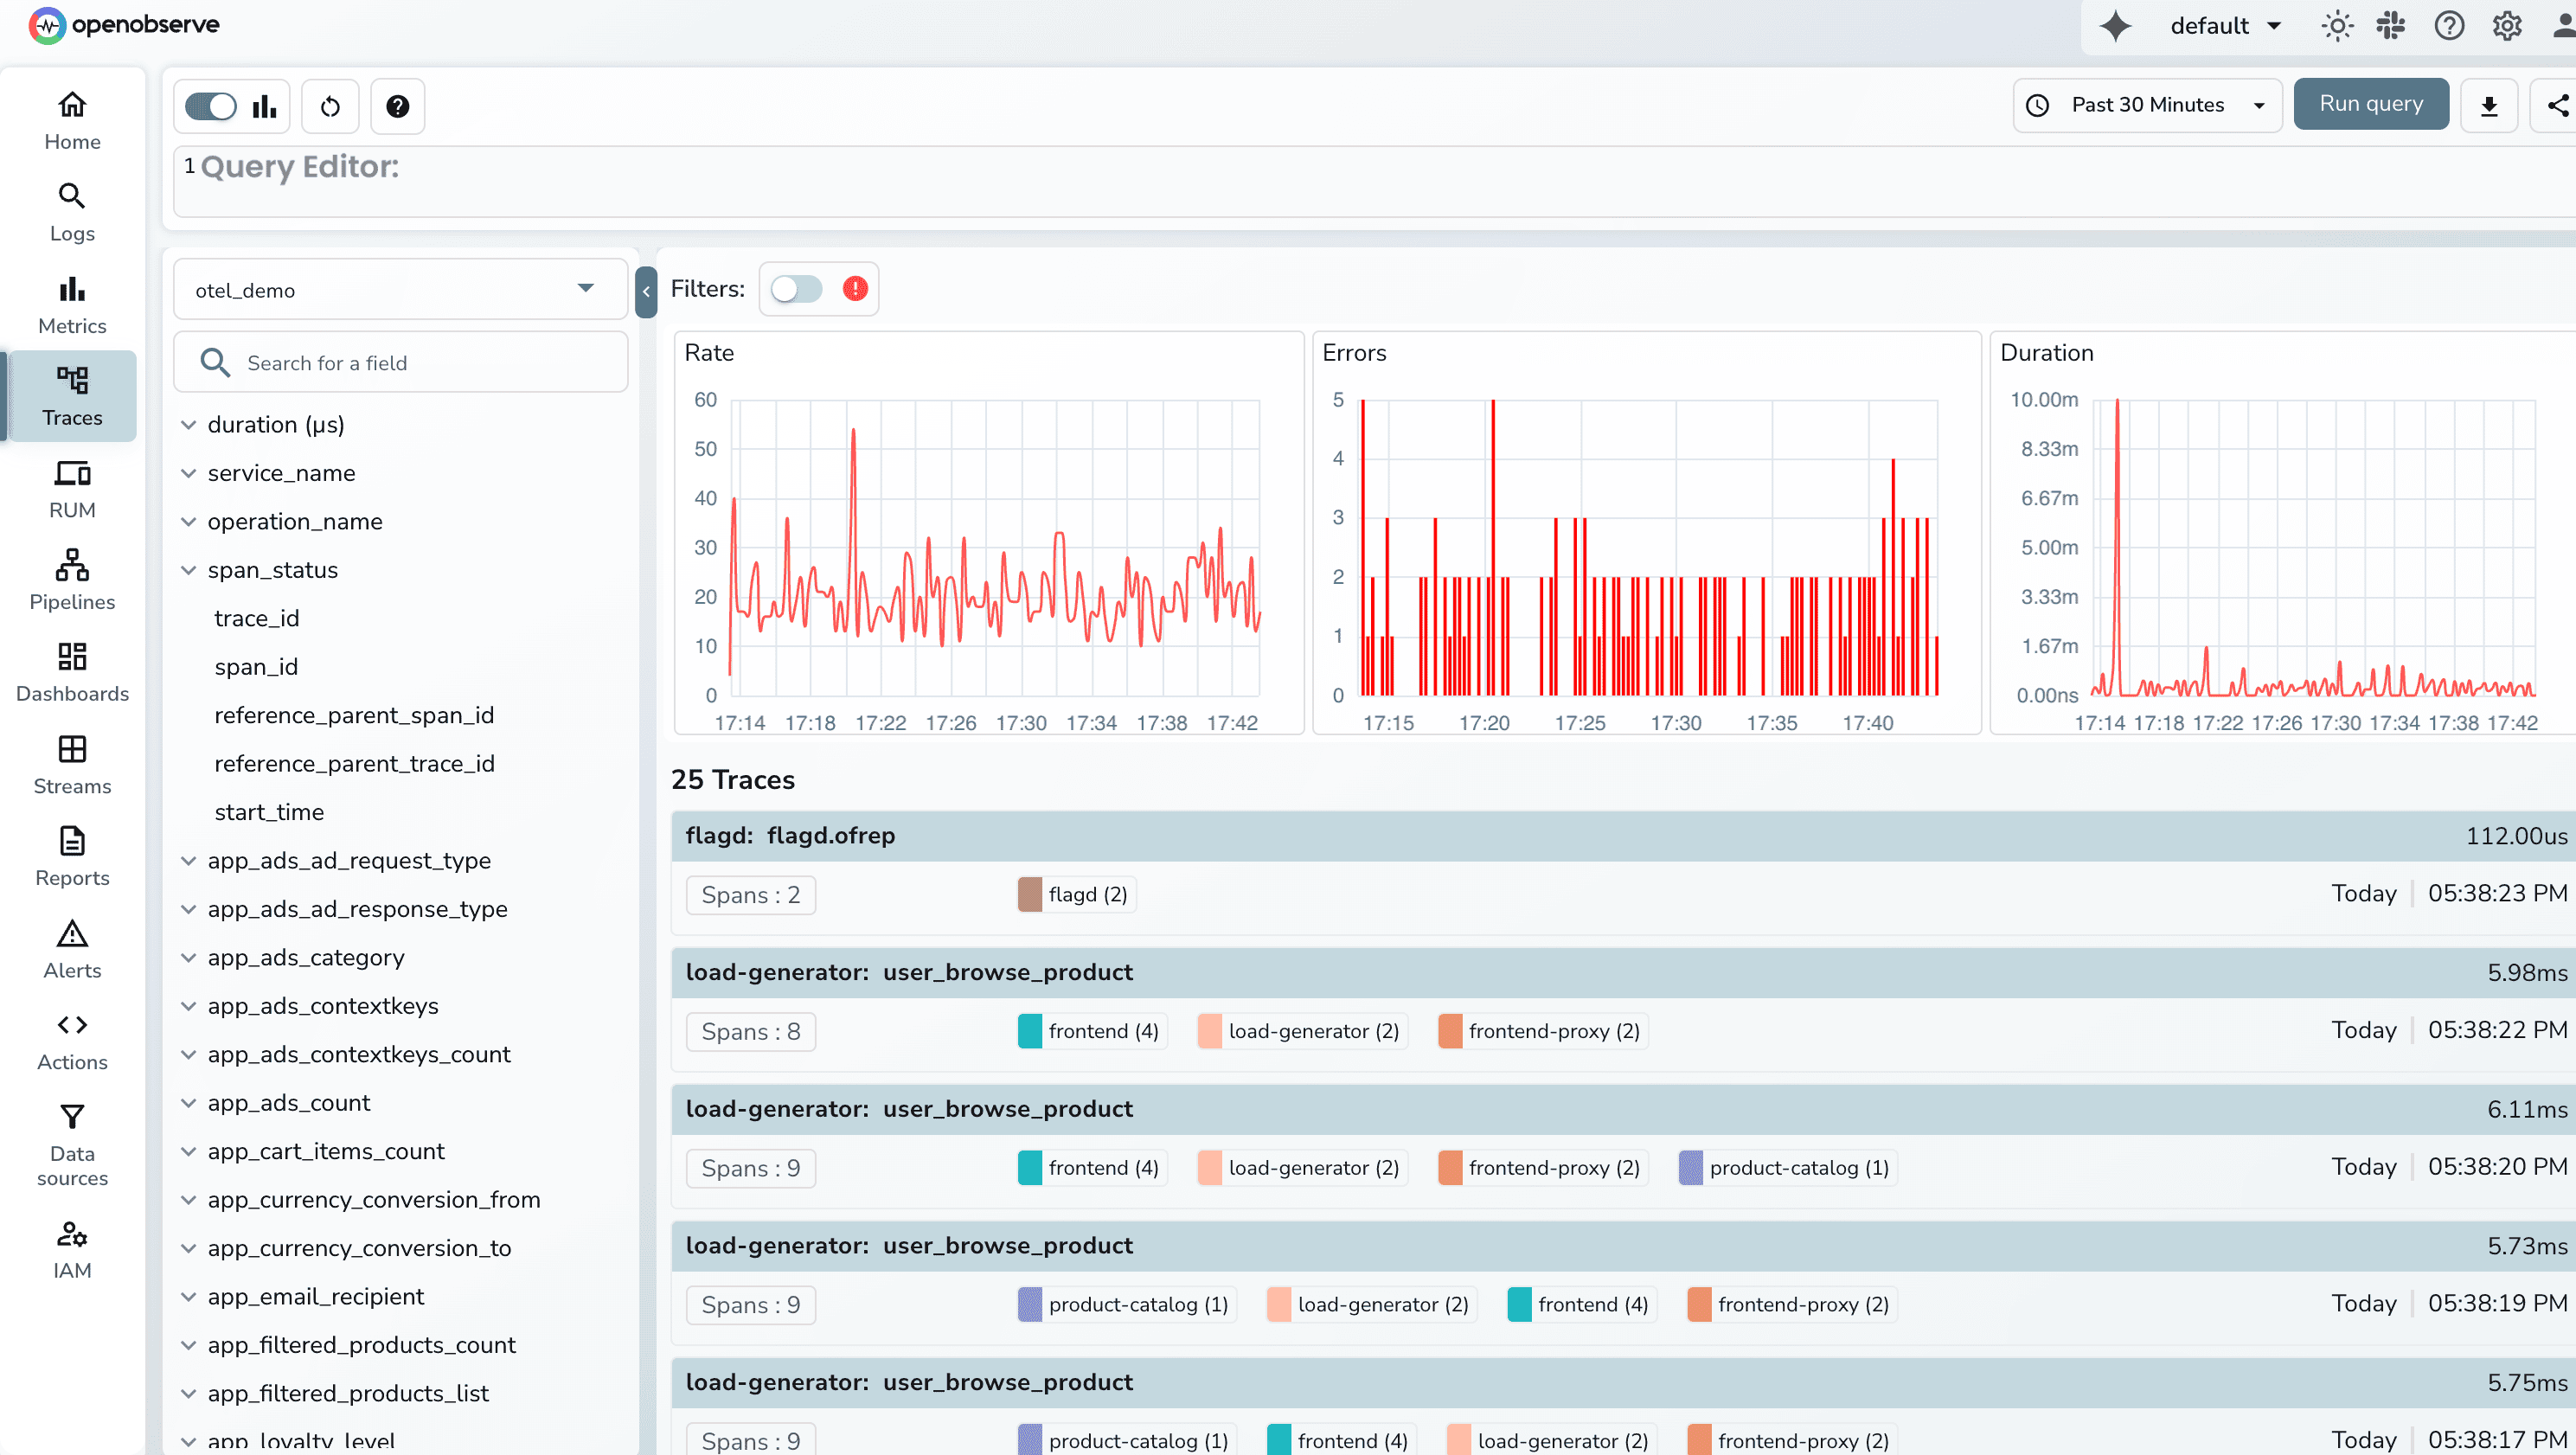
You can choose the time range for which you want to see the data and filter on the error traces to do root cause analysis.
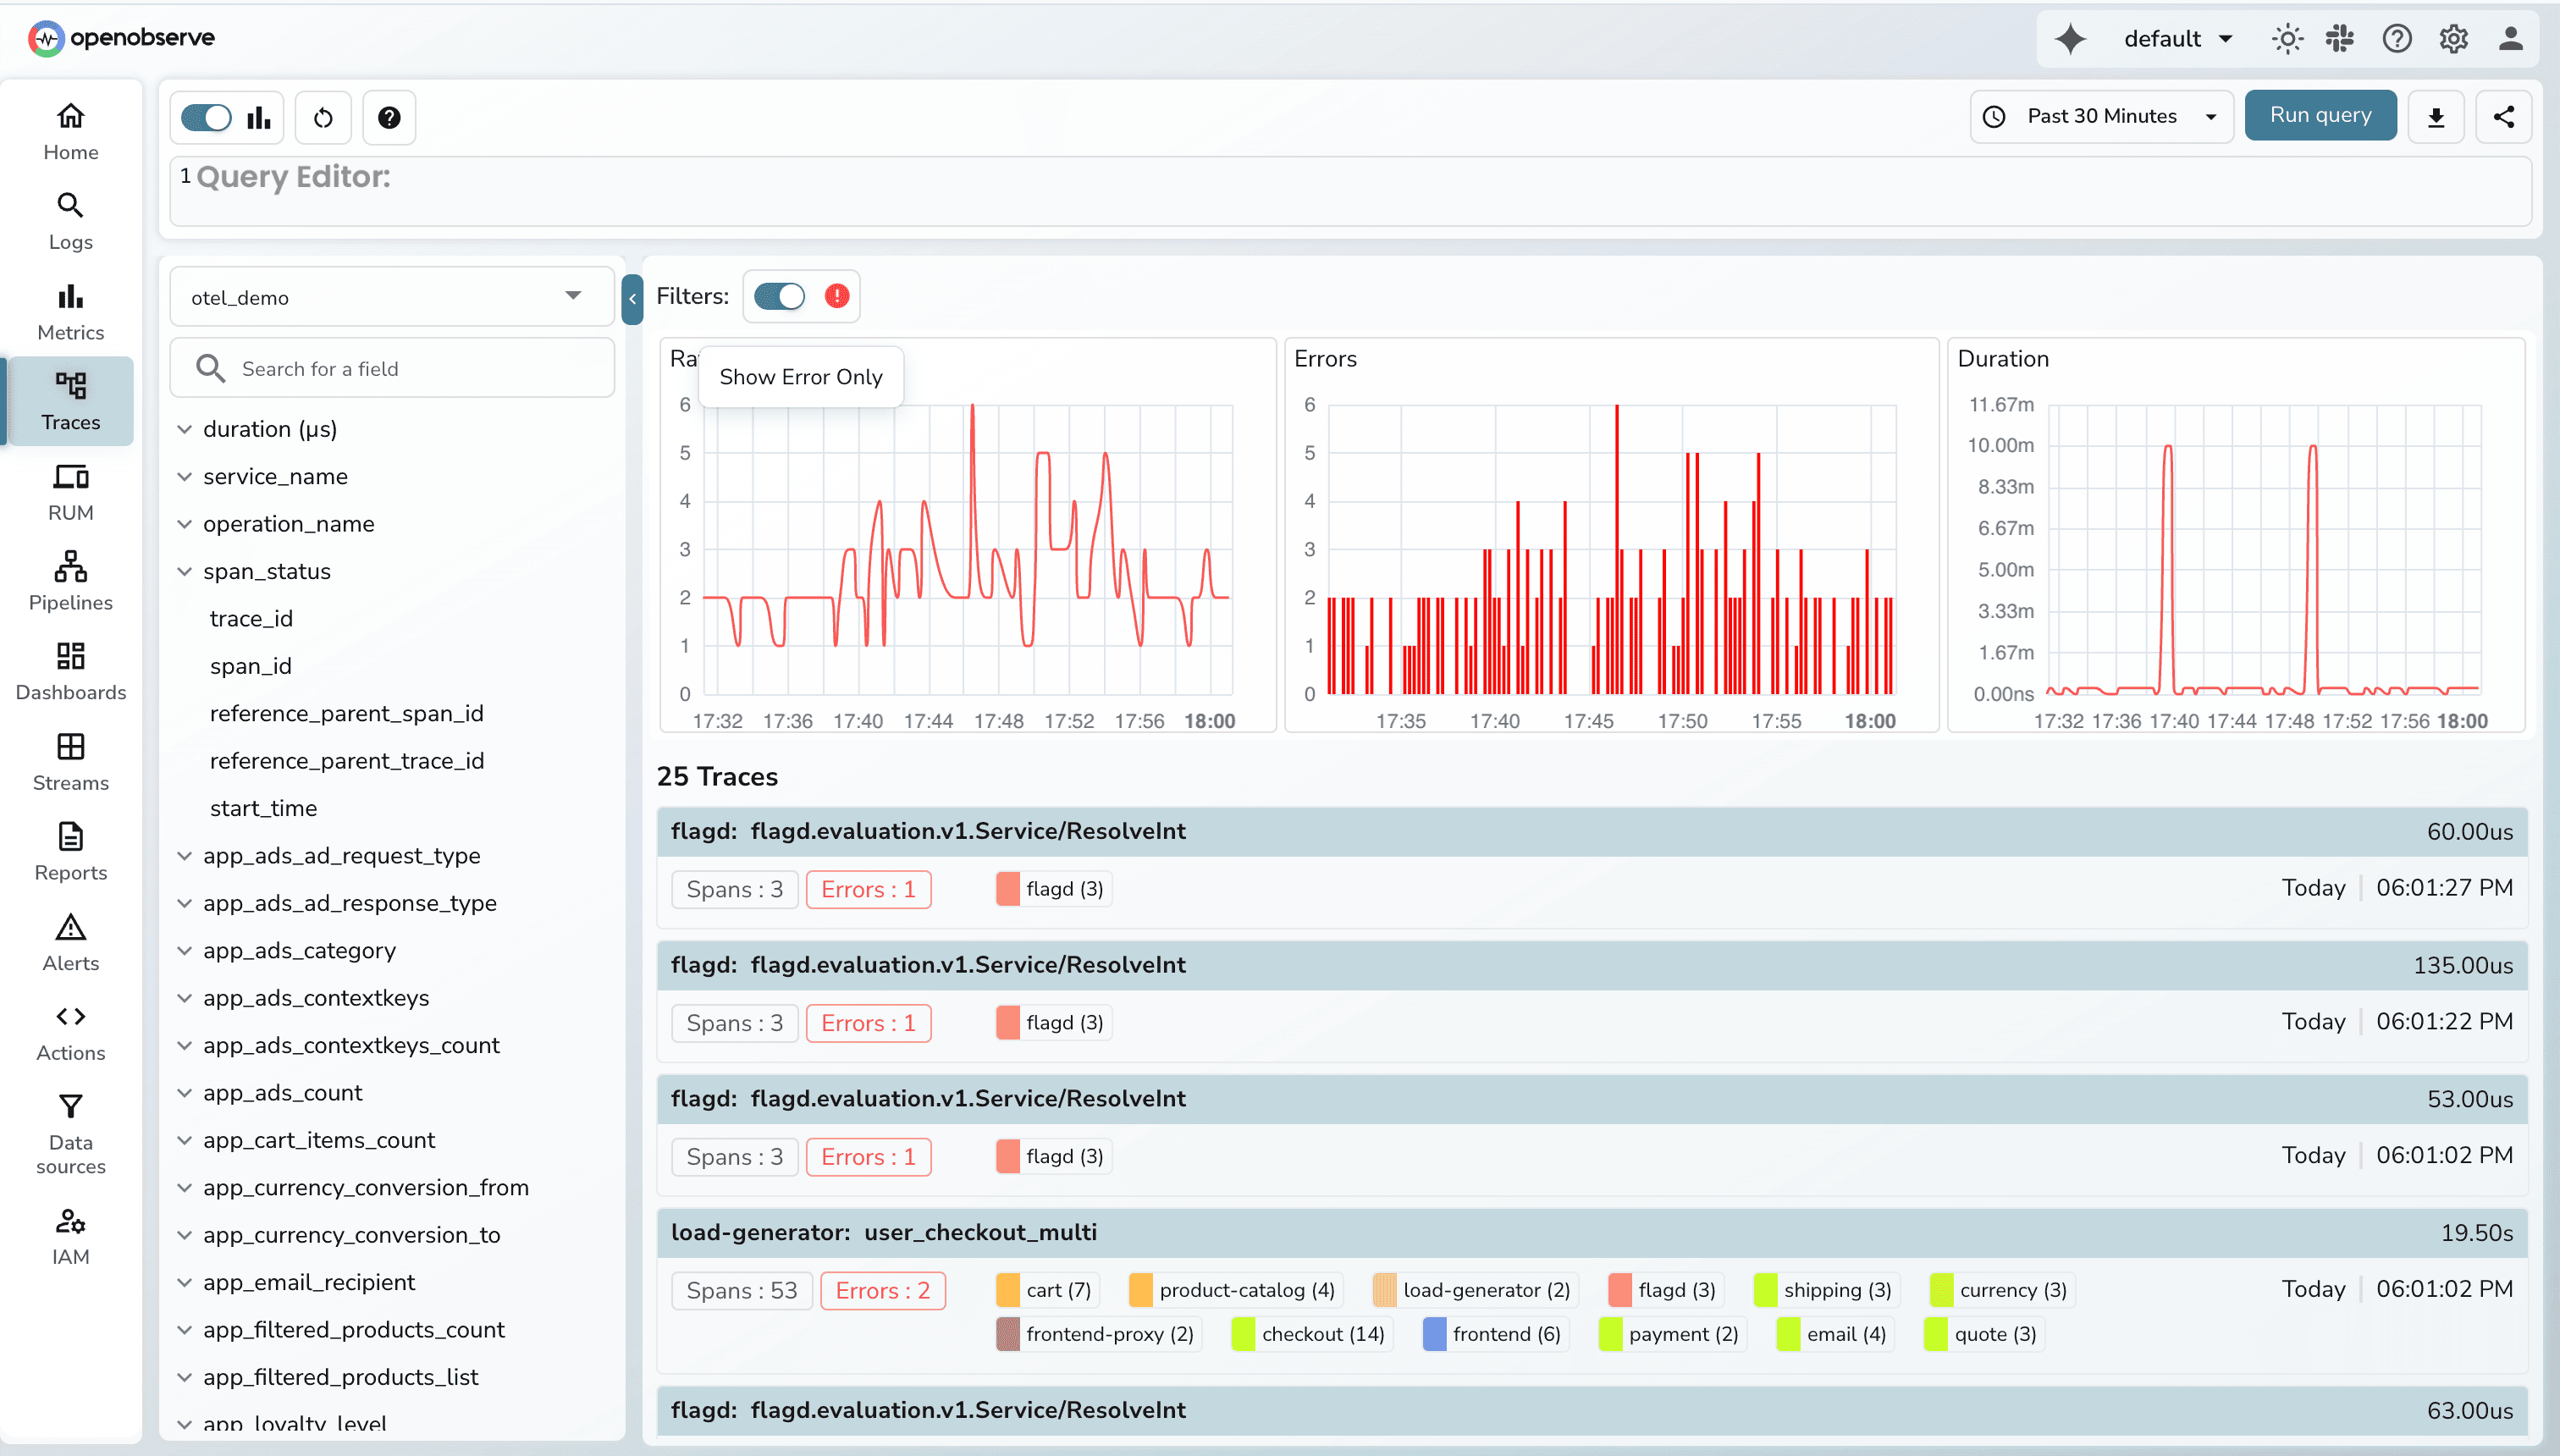
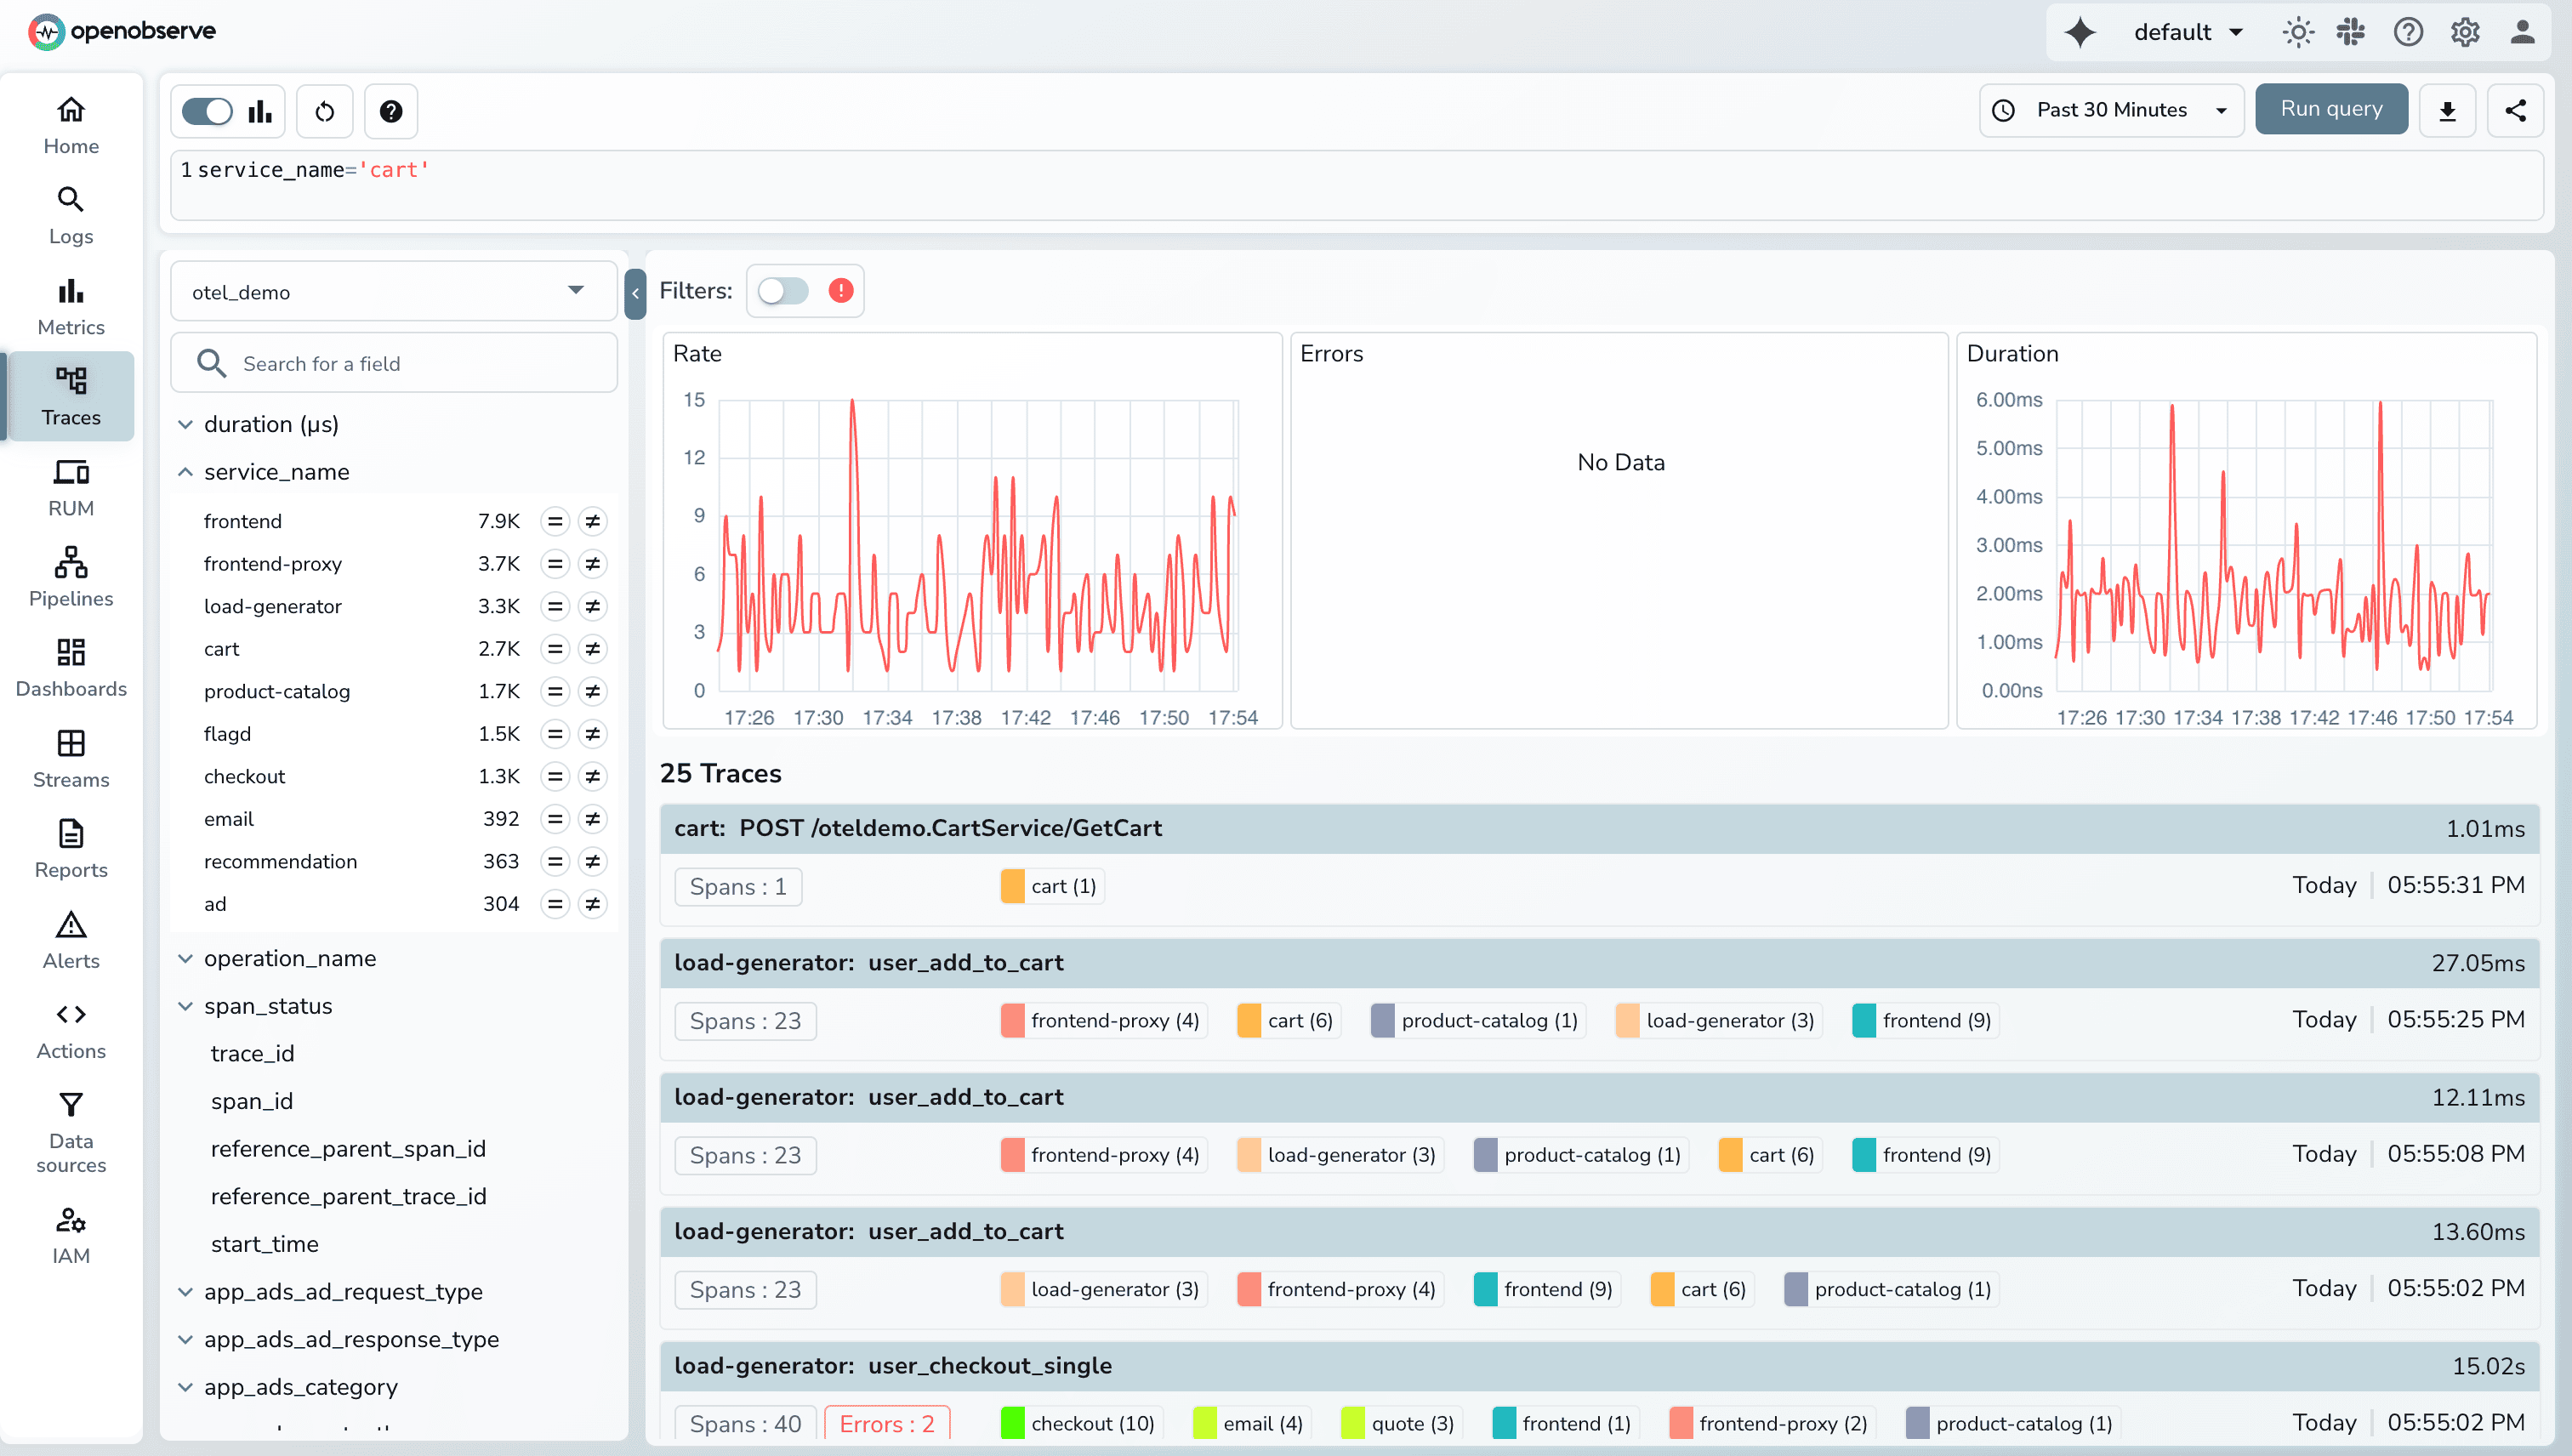
Additionally, you can filter based on different fields.
RED metrics( Requests, Errors, and Duration) offer a focused, user-centric view of microservice health. By concentrating on the signals that directly affect end-user experience, RED helps teams quickly identify issues, reduce alert noise, and make informed decisions during incidents. When combined with SLO-based alerting and percentile-based latency tracking, RED becomes a reliable foundation for both operational monitoring and performance optimization.
If you want to see RED metrics in action, OpenObserve makes it easy to collect, visualize, and analyze them across your services. From dashboards and endpoint-level breakdowns to burn-rate alerts and trace correlation, OpenObserve provides a unified platform to turn RED metrics into actionable insights.
1. Are RED metrics the same as Golden Signals?
Not exactly. Golden Signals include latency, errors, traffic, and saturation, while RED focuses only on requests, errors, and duration. RED is more specialized for microservices, whereas Golden Signals apply broadly to any system.
2. Should RED metrics use averages or percentiles?
Percentiles such as p95 and p99 are more accurate because they capture tail latency, which represents the worst user experiences. Averages hide spikes and make it harder to detect real performance problems.
3. Can RED metrics be derived from distributed traces?
Yes, especially when using OpenTelemetry. The duration of spans naturally represents latency, status codes indicate success or failure, and the volume of spans per endpoint gives you request counts.
4. Are RED metrics enough by themselves?
They are a strong starting point, but they don’t cover resource saturation, JVM metrics, queue depth, or host-level telemetry. RED should be combined with infra metrics or Golden Signals for complete operational visibility.
5. Why do SRE teams prefer RED during incident response?
RED surfaces the symptoms users feel, errors and slowness: before deeper metrics show anything unusual. It allows responders to quickly isolate problematic endpoints and focus debugging where it matters.
Passionate about observability, AI systems, and cloud-native tools. All in on DevOps and improving the developer experience.


