Datadog Pricing in 2026: What It Really Costs (With Examples)




Ready to get started?
Try OpenObserve Cloud today for more efficient and performant observability.
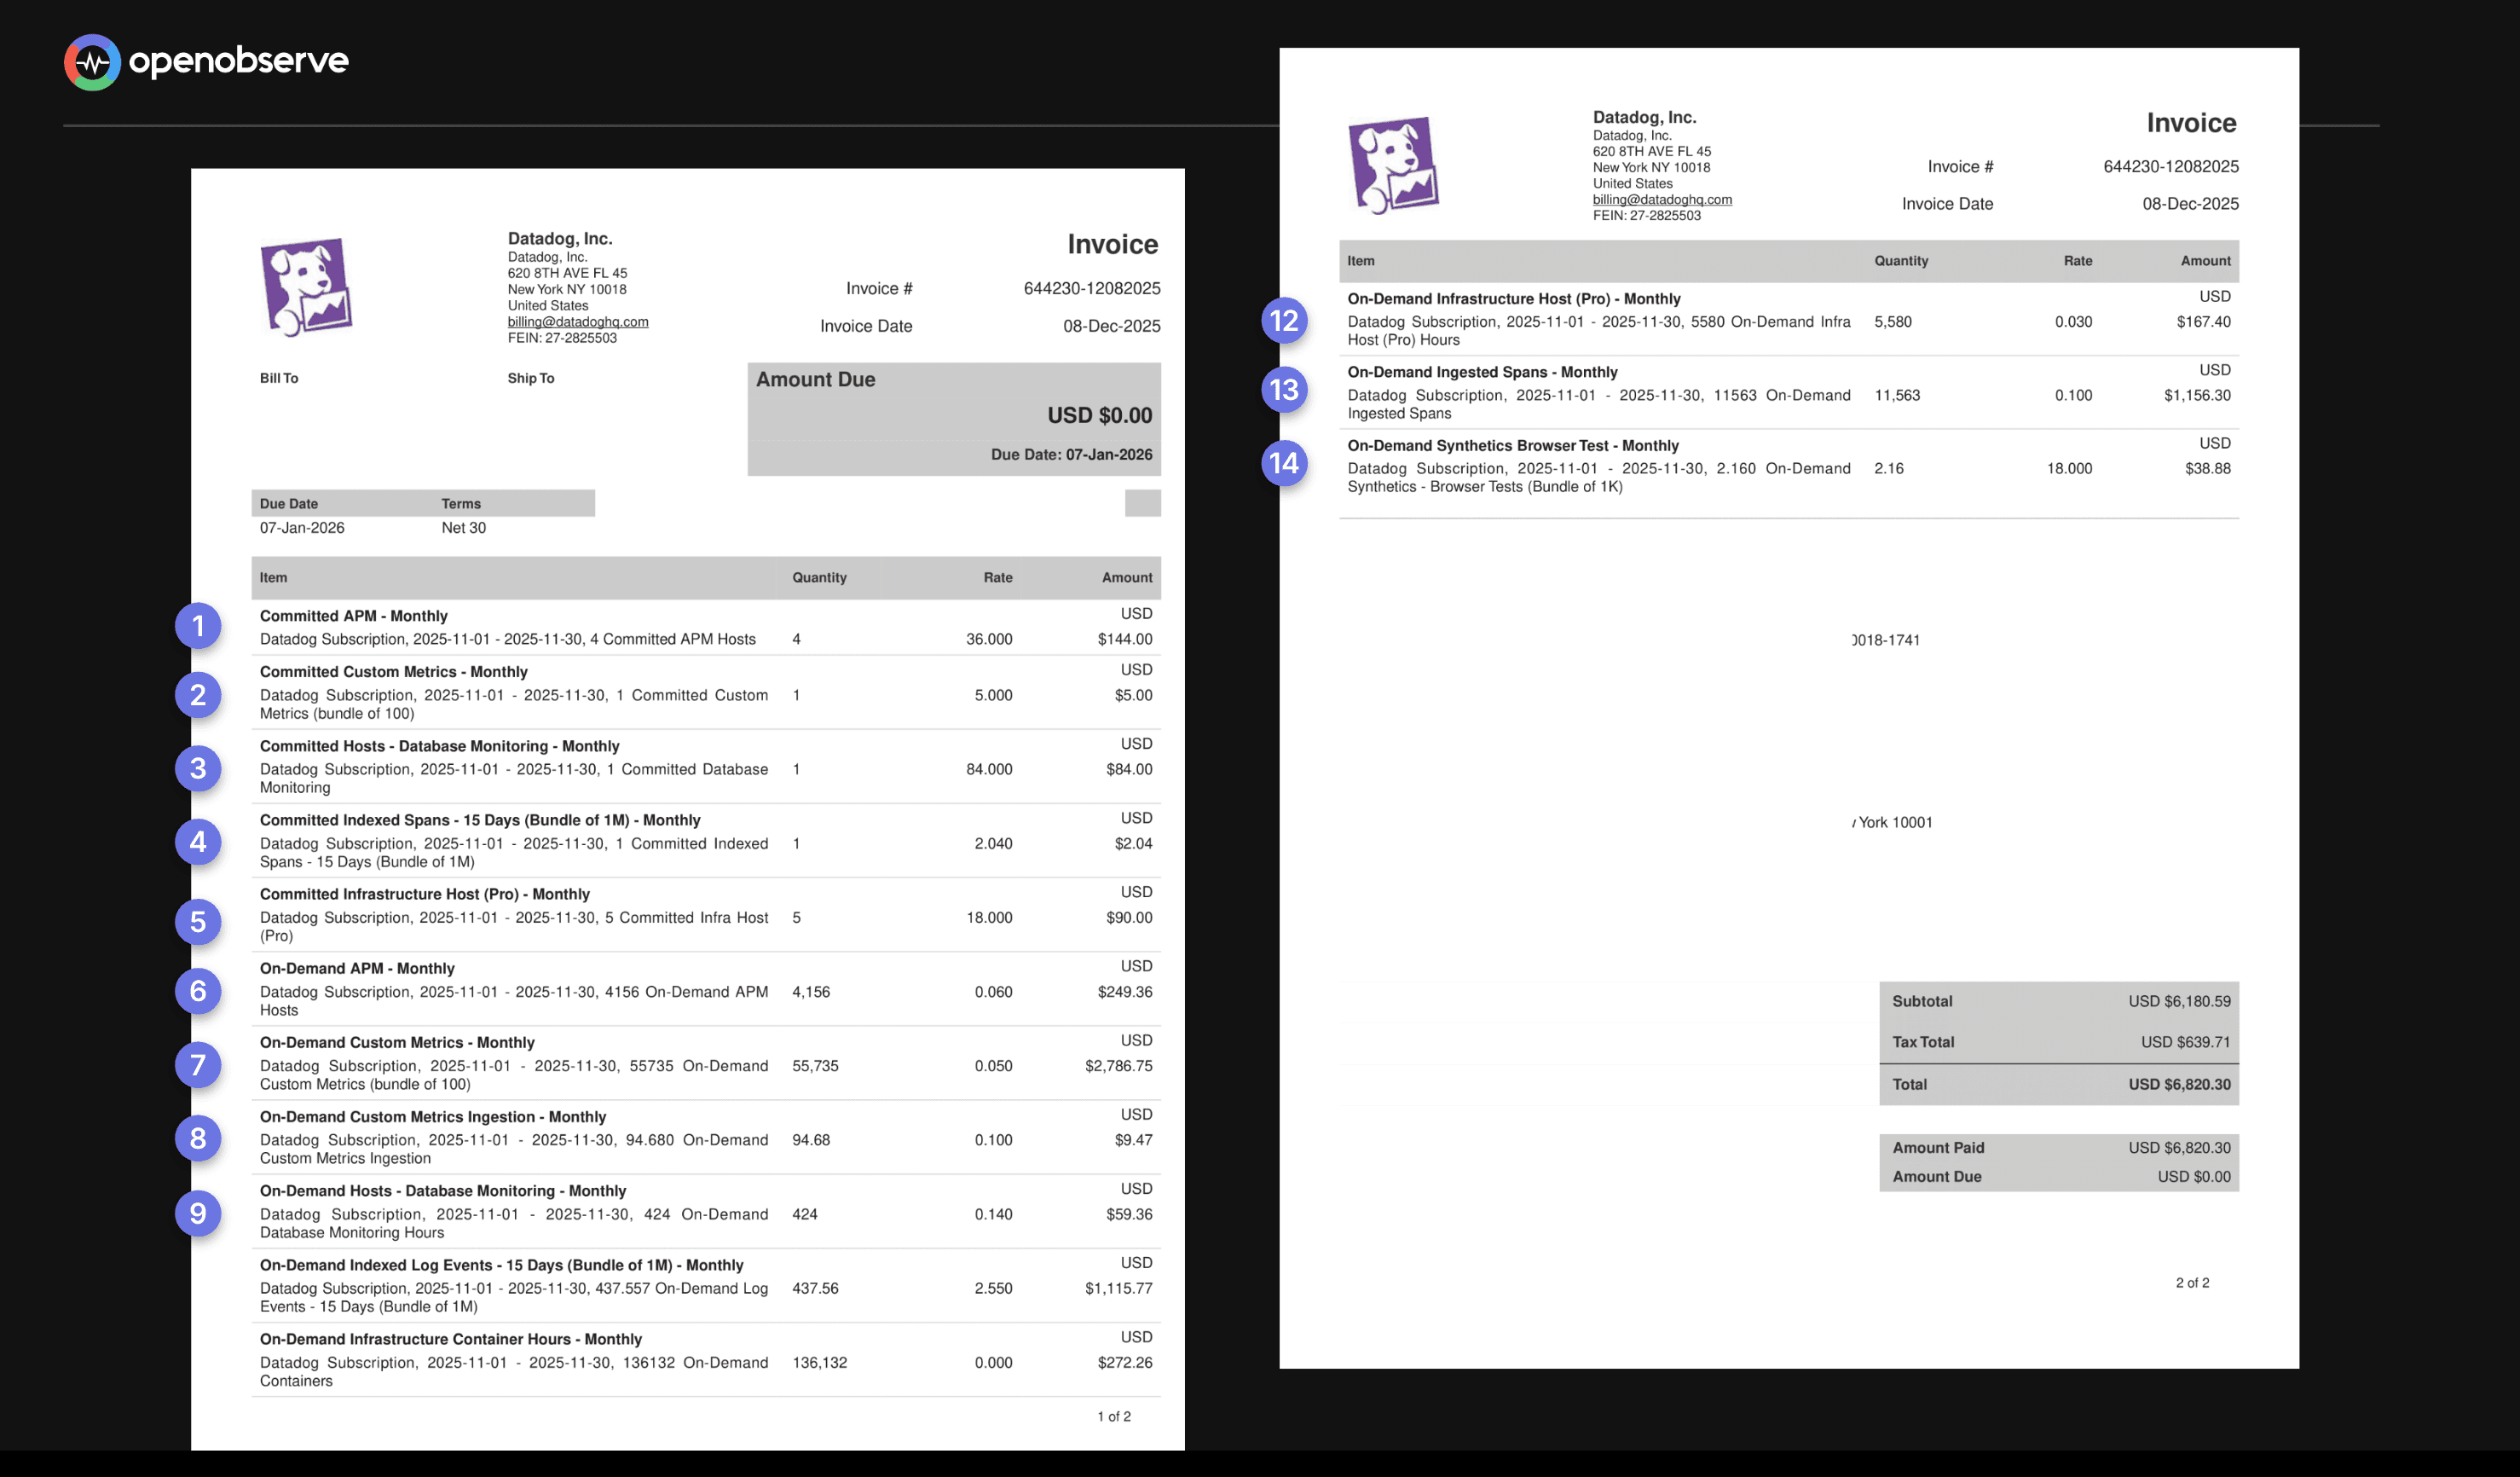
A 50-host team running Datadog APM and Infrastructure Monitoring pays around $2,300/month before logs, custom metrics, or RUM. Scale to 200 hosts for a product launch and that month's bill locks in at $6,200 for APM alone. Add custom metric overages and log indexing and mid-size teams routinely hit $10,000 to $30,000/month in ways their initial estimates never predicted.
Datadog is one of the most widely adopted observability platforms on the market. Its dashboards are polished, its integrations are broad, and its feature set spans infrastructure monitoring, APM, security, and real user monitoring. For many teams, it was the default choice for years.
But one thing comes up again and again in engineering communities, Slack channels, and Reddit threads: the bill.
Teams report invoices that were 3x, 5x, even 10x what they budgeted, not because they misunderstood the product, but because Datadog's pricing model has layers of complexity that only reveal themselves at scale or during unexpected traffic spikes.
At OpenObserve, we've spoken with hundreds of engineering teams who came to us after a Datadog billing shock. This post breaks down how Datadog's pricing actually works, where the pain points are, and what a more transparent model looks like.
The Core Problem: Multi-Dimensional Pricing
Most SaaS tools charge you for one thing: seats, API calls, or storage. Datadog charges for many things simultaneously, each with its own pricing metric, allotment structure, and overage calculation. You're not buying one product; you're buying a bundle of sub-products that each generate their own line items.
Forecasting your monthly bill requires understanding a dozen interrelated variables. A configuration change, a new service deployment, or a temporary traffic spike can silently trigger significant cost increases that only appear on next month's invoice.
Use our pricing calculator to estimate how much you could save by switching to OpenObserve.
Main Caveats in Datadog Pricing Explained
1. Per-Host Billing in a World of Dynamic Infrastructure
Datadog prices its core Infrastructure Monitoring and APM products on a per-host basis. In a world of containerized microservices and auto-scaling Kubernetes clusters, this model creates a structural mismatch between how you run software and how you get billed for monitoring it.
Infrastructure monitoring starts at $15 per host/month. APM with continuous profiler starts at $31 per host/month. The definition of a "host" is deliberately broad: a VM, a Kubernetes node, an Azure App Service Plan, or an AWS Fargate task can all count.
The High-Water Mark System
Billing isn't based on your average host count or even your peak. Datadog uses a high-water mark model: it measures your host count every hour, discards the top 1% of hours, and bills you for the entire month based on the next highest hour.
Example: Your application normally runs on 50 hosts. For a 5-day product launch, you scale to 200 hosts. Datadog ignores roughly 7 hours of your absolute peak, but for the remainder of that 5-day stretch, your count was consistently 200.
- Your APM bill for the full month: $6,200 (200 hosts × $31)
- Your expectation based on average usage: ~$2,260
You pay for your peak period for the entire month, regardless of the fact that your infrastructure returned to normal for the other 25 days.
The Container Trap
This issue is amplified in containerized environments. The intended setup is one Datadog Agent per Kubernetes node. But if the agent is mistakenly deployed inside every pod, each pod is billed as a separate host. A misconfiguration on a 50-node cluster running hundreds of pods can multiply your bill by 10x or more overnight.
2. Why Custom Metrics Become Expensive at Scale
This is frequently cited as the most unpredictable part of a Datadog bill. Datadog charges a premium for "custom metrics": any metric that doesn't come from a native Datadog integration. That includes virtually every application-level metric you create yourself, and critically, all metrics sent via OpenTelemetry are billed as custom metrics.
On Datadog's Pro plan, you receive 100 custom metrics per host as part of your allotment. Beyond that, overages are billed at $5.00 per 100 custom metrics/month, based on your monthly average.
These metrics are pooled across your infrastructure. If you have 10 hosts on the Pro plan, you have a "bucket" of 1,000 custom metrics. You aren't penalized if one host sends 500 and the others send none, as long as the total remains under 1,000.
At scale, custom metrics billing reaches 52% or more of the total Datadog invoice for some teams.
How Cardinality Explodes Your Bill
The cost is driven by cardinality: the number of unique combinations of a metric name and its associated tags. Adding a single tag with many unique values causes your metric count to multiply dramatically.
Example: You track API latency with one metric: api.request.latency. You have 10 endpoints, 3 HTTP status codes, and 3 customer tiers. That's already 90 unique custom metrics from a single metric name. Add a customer_id tag with 1,000 unique values and you instantly have 90,000 custom metrics, generating roughly $4,500/month in overages from one metric.
Metrics Without Limits™: A Complex Workaround
Datadog's answer to cardinality costs is a feature called Metrics Without Limits™, which lets you control which tag combinations are indexed. It adds another billing layer:
- Indexed metrics: billed at the standard overage rate
- Ingested metrics: a separate fee of $0.10 per 100 metrics for all data sent before filtering
You pay to send the data, then pay again to make it queryable: two separate charges for the same observability signal.
3. The Hidden Double Charge in Log Management
Datadog's log management follows a two-part tariff. You pay first to ingest your logs, then again to make them searchable.
- Ingestion: $0.10 per GB to collect, process, and archive logs
- Indexing: $1.70 per million log events to make them searchable for 15 days
Example: Your application generates 50 GB of logs per month (~100 million events).
| Cost Component | Amount |
|---|---|
| Ingestion (50 GB × $0.10) | $20 |
| Indexing (100M events × $1.70) | $170 |
| Total | $190/month |
To cut costs, you might index only 20% of your logs. That leaves 80% of your data invisible during an incident, precisely when you need full visibility most.
This pricing structure creates a perverse incentive: the teams that most need comprehensive logging are punished most heavily for it. Budget constraints lead to strategic under-logging, which leads to longer incident resolution times.
If you use Cloud SIEM, Datadog charges a third time: an additional fee (approx. $0.10 to $0.20 per million events) to "analyze" the logs you've already paid to ingest and index. This is often called the "Security Tax."
4. LLM Observability: The "Silent" Ingestion Premium
As teams move AI-powered applications into production using OpenTelemetry, Datadog's LLM Observability introduces a specialized billing layer that operates differently from standard APM tracing.
The "Auto-Mapping" Trigger
Datadog now natively supports OpenTelemetry GenAI Semantic Conventions. If your application emits spans with standard OTel tags (like gen_ai.system, gen_ai.request.model, or gen_ai.usage.input_tokens), Datadog's ingestion pipeline automatically recognizes and routes this data into the LLM Observability product. This provides instant dashboards, but also triggers a volume-based fee separate from your existing APM contract.
The Cost Breakdown
Unlike the flat per-host fee of APM, LLM Observability is billed on a high-granularity usage model:
- Token Ingestion: ~$0.10 per 1,000 tokens (prompts and completions combined)
- Session Billing: If integrated with Real User Monitoring, additional charges of ~$1.50 per 1,000 sessions apply for end-to-end AI visibility
- The Surprise Factor: A team processing 40 million tokens a day sees a charge of $4,000/day, often appearing on the bill before the team realizes they've moved beyond "standard" tracing
The Configuration Trap
The opt-out is not a simple toggle in the Datadog UI. Billing is triggered by the presence of specific metadata in your OTel spans:
- Default Ingestion: By default, the Datadog Agent and OTLP intake process any recognized GenAI attributes
- Manual Suppression: To avoid these charges, engineers must manually configure their OpenTelemetry Collector or Datadog Agent to drop or mask GenAI-specific attributes before the data reaches Datadog's servers
If you use OTel to monitor an LLM and don't explicitly filter your spans, you're opted into token-based billing by default.
A Simplified Breakdown of Datadog's Core Product Pricing
Prices based on publicly available information for annual billing as of 2026. Always verify against Datadog's official pricing page.
| Product | Pricing Metric | Starting Price | Key Risk |
|---|---|---|---|
| Infrastructure Monitoring | Per host/month | $15 | High-water mark billing; container misconfiguration multiplies costs |
| APM & Continuous Profiler | Per host/month | $31 | Expensive in microservices; same high-water mark risk |
| Log Management: Ingest | Per GB | $0.10/GB | You pay even for logs you never search |
| Log Management: Index | Per million events | $1.70/M events | Double-billing to make logs searchable; 15-day default retention |
| Custom Metrics | Per 100 metrics/month (overage) | $5.00/100 | High-cardinality tags cause exponential growth; OTel metrics land here |
| Real User Monitoring (RUM) | Per 1,000 sessions | $1.50 | Scales directly with user traffic; can spike unpredictably |
| Database Monitoring | Per DB host/month | $70 | Expensive at scale; separate from infrastructure billing |
| Synthetic API Tests | Per 10,000 test runs | $5.00 | Frequency and multi-location tests multiply costs |
| Cloud Security Management | Per host/month | $15 | Adds to existing per-host costs |
For how Datadog's synthetic pricing and features compare to the rest of the market, see Best Synthetic Monitoring Tools in 2026, and for the worked math on what per-test-run billing costs as check frequency and locations scale, see Datadog Synthetic Monitoring Pricing: The Per-Test Trap.
Why OpenObserve Takes a Different Approach
OpenObserve was built to address the pain points teams experience with platforms like Datadog. The core philosophy: instrument your systems comprehensively without making financial trade-offs about what data to keep.
Usage-Based Pricing with No Hidden Multipliers
OpenObserve Cloud pricing is tied to data volume, not infrastructure topology. No per-host charges, no custom metric taxes, no tiered indexing structures.
| What You Use | Price |
|---|---|
| Logs, Metrics, Traces, RUM, Session Replay, Error Tracking (Ingestion) | $0.50 per GB |
| Logs, Metrics, Traces, RUM, Session Replay, Error Tracking (Query) | $0.01 per GB queried |
| Pipelines (Data Processed) | $0.20 per GB |
| Additional Retention (beyond 15 days) | $0.10 per 30 days |
| AI Assistant and AI SRE Agent | $0 during preview |
No per-host multipliers. No separate indexing tier for log search. No custom metric allotments or overage fees. No automatic premium activation for LLM spans.
OpenTelemetry Native
OpenObserve is designed from the ground up to work natively with OpenTelemetry. Logs, metrics, and traces sent via OTel are treated as standard data, not as premium "custom metrics." There is no financial penalty for adopting open standards.
Teams using OTel on Datadog face unexpected custom metric charges because every OTel metric bypasses Datadog's native integrations and lands in the custom metrics bucket. On OpenObserve, OTel is the default path, not an expensive edge case.
140x Lower Storage Costs via Columnar Architecture
OpenObserve uses Apache Parquet columnar storage with approximately 40x compression, backed by S3-compatible object storage. This architecture delivers dramatically lower storage costs compared to index-heavy alternatives like Elasticsearch, and enables petabyte-scale observability without requiring specialized infrastructure.
The stateless architecture also means very low RPO/RTO: nodes can be rapidly restarted, and data durability is backed by S3's 11-nines (99.999999999%) reliability.
No Surprise Bills for AI-Powered Applications
LLM traces and spans are treated as standard trace data in OpenObserve. There is no separate product tier, no automatic activation charge, and no per-day premium. Teams building AI-powered applications are billed the same way as any other workload: by data volume ingested.
Flexible Deployment: Cloud, Self-Hosted, or Enterprise
- OpenObserve Cloud: Fully managed, pay-as-you-go, 14-day free trial. No infrastructure to manage.
- Self-Hosted (Open Source): Full-featured and production-ready. Single binary, deploys in under 2 minutes. Always free.
- Enterprise: SSO/SAML, advanced RBAC, multi-region federation, audit trails, bring-your-own-cloud or on-premise. Contact sales.
Full Comparison: Datadog vs OpenObserve
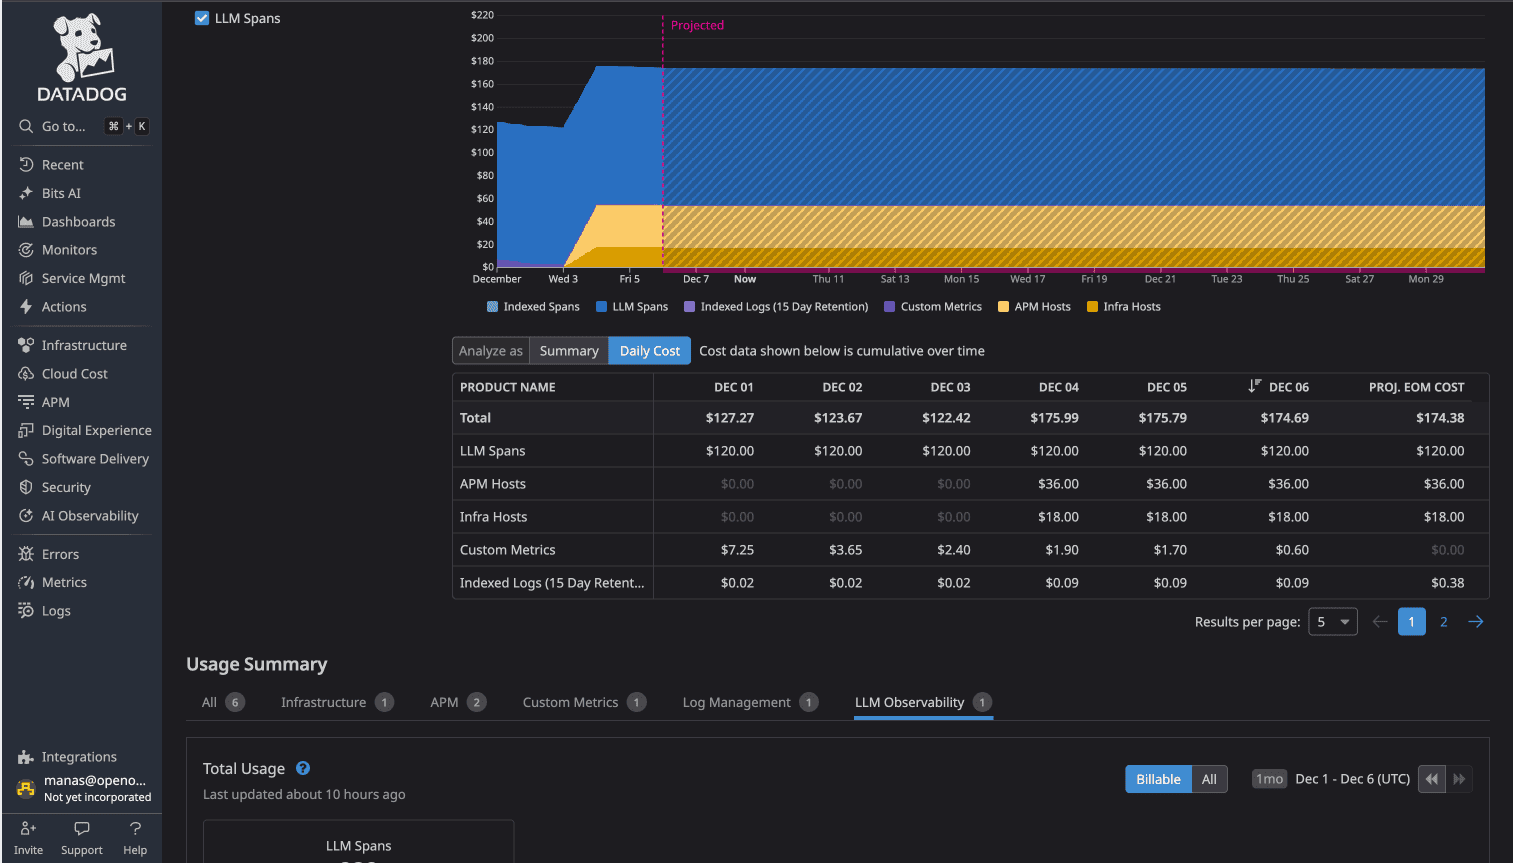
Real-world comparison: Using the OpenTelemetry Demo application (16 microservices, Kafka, PostgreSQL, OpenAI instrumentation), a side-by-side test showed Datadog costing approximately $174/day vs OpenObserve at approximately $3/day for identical telemetry data: a 58x cost difference. The gap is driven not by feature differences but by architectural choices: per-host pricing, custom metric overages, LLM observability activation, and tiered retention all compound simultaneously on Datadog.
- Full comparison
- Part 1: Logs - Automatic Field Discovery, SQL Queries, and 90% Cost Savings
- Part 2: Metrics - Drag & Drop, SQL, PromQL, High Cardinality
- Part 3: Traces/APM - OTel Native, No Hidden Tiers
- Part 4: Dashboards - Prebuilt, Drag & Drop, Custom
- Part 5: Alerts, Monitors, Destinations
- Part 6: Real User Monitoring
- Part 7: Pipelines
- Part 8: IAM SSO, RBAC
- Part 9: Cost
Datadog Pricing: The Numbers That Matter
- Baseline for 50 hosts: $750/mo (Infrastructure at $15/host) + $1,550/mo (APM at $31/host) = $2,300/mo before logs, metrics, or RUM
- High-water mark trap: Scale to 200 hosts for a 5-day launch and the entire month bills at the 200-host rate: $6,200 for APM alone
- Custom metrics ceiling: 100 metrics/host included; overages at $5 per 100 metrics/month. Every OTel metric counts as a custom metric by default
- Cardinality multiplier: One metric plus a
customer_idtag across 1,000 customers = 90,000 custom metrics = ~$4,500/mo overage from a single instrumentation decision - Log double-billing: 50 GB/month fully indexed = $190/mo (ingestion + indexing). Index only 20% to cut costs and 80% of your logs are invisible during incidents
- Cloud SIEM surcharge: A third fee ($0.10-$0.20 per million events) on logs you have already paid to ingest and index
- LLM observability auto-activation: 40 million OTel tokens/day triggers ~$4,000/day in charges unless GenAI spans are explicitly filtered before reaching Datadog
- Real-world gap: OTel Demo app (16 microservices, Kafka, PostgreSQL, OpenAI): Datadog $174/day vs OpenObserve $3/day for identical telemetry
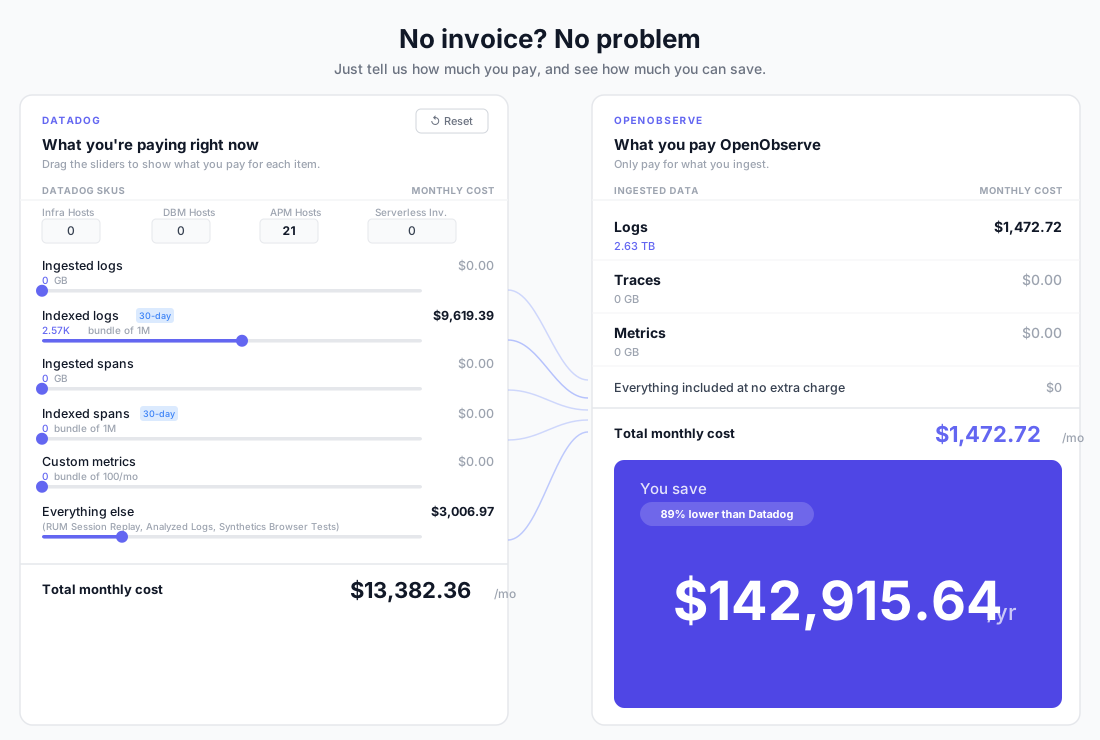
OpenObserve Cloud includes a 14-day free trial. No credit card required. Or run the Bill Analyzer to see your exact savings before switching.
Frequently Asked Questions
About the Author
Simran Kumari

Passionate about observability, AI systems, and cloud-native tools. All in on DevOps and improving the developer experience.
Follow OpenObserve on Google
Add OpenObserve as a preferred source to see more of our articles in Google Search and Top Stories.












