Sending Data from OpenObserve Pipelines to Splunk Using Splunk HTTP Event Collector (HEC)

Md Mosaraf
June 20, 2025
4 min read
Don’t forget to share!
Try OpenObserve Cloud today for more efficient and performant observability.
Sometimes, after processing logs through OpenObserve pipelines, you may need to forward that data to other systems for further analysis or compliance. One popular destination is Splunk, thanks to its powerful analytics and alerting capabilities.
In this blog, we’ll walk through how to send processed log data from OpenObserve to Splunk using its HTTP Event Collector (HEC)—a flexible, high-performance interface for ingesting JSON-formatted events over HTTP or HTTPS. By integrating OpenObserve with Splunk via HEC, you get the best of both worlds-- OpenObserve’s real-time observability and Splunk’s deep search and visualization features. This easy setup will help you create a unified, end-to-end view of your logs across platforms.
There are many scenarios where sending OpenObserve data to Splunk is beneficial, such as:
Here’s what you will need to send OpenObserve data to Splunk:
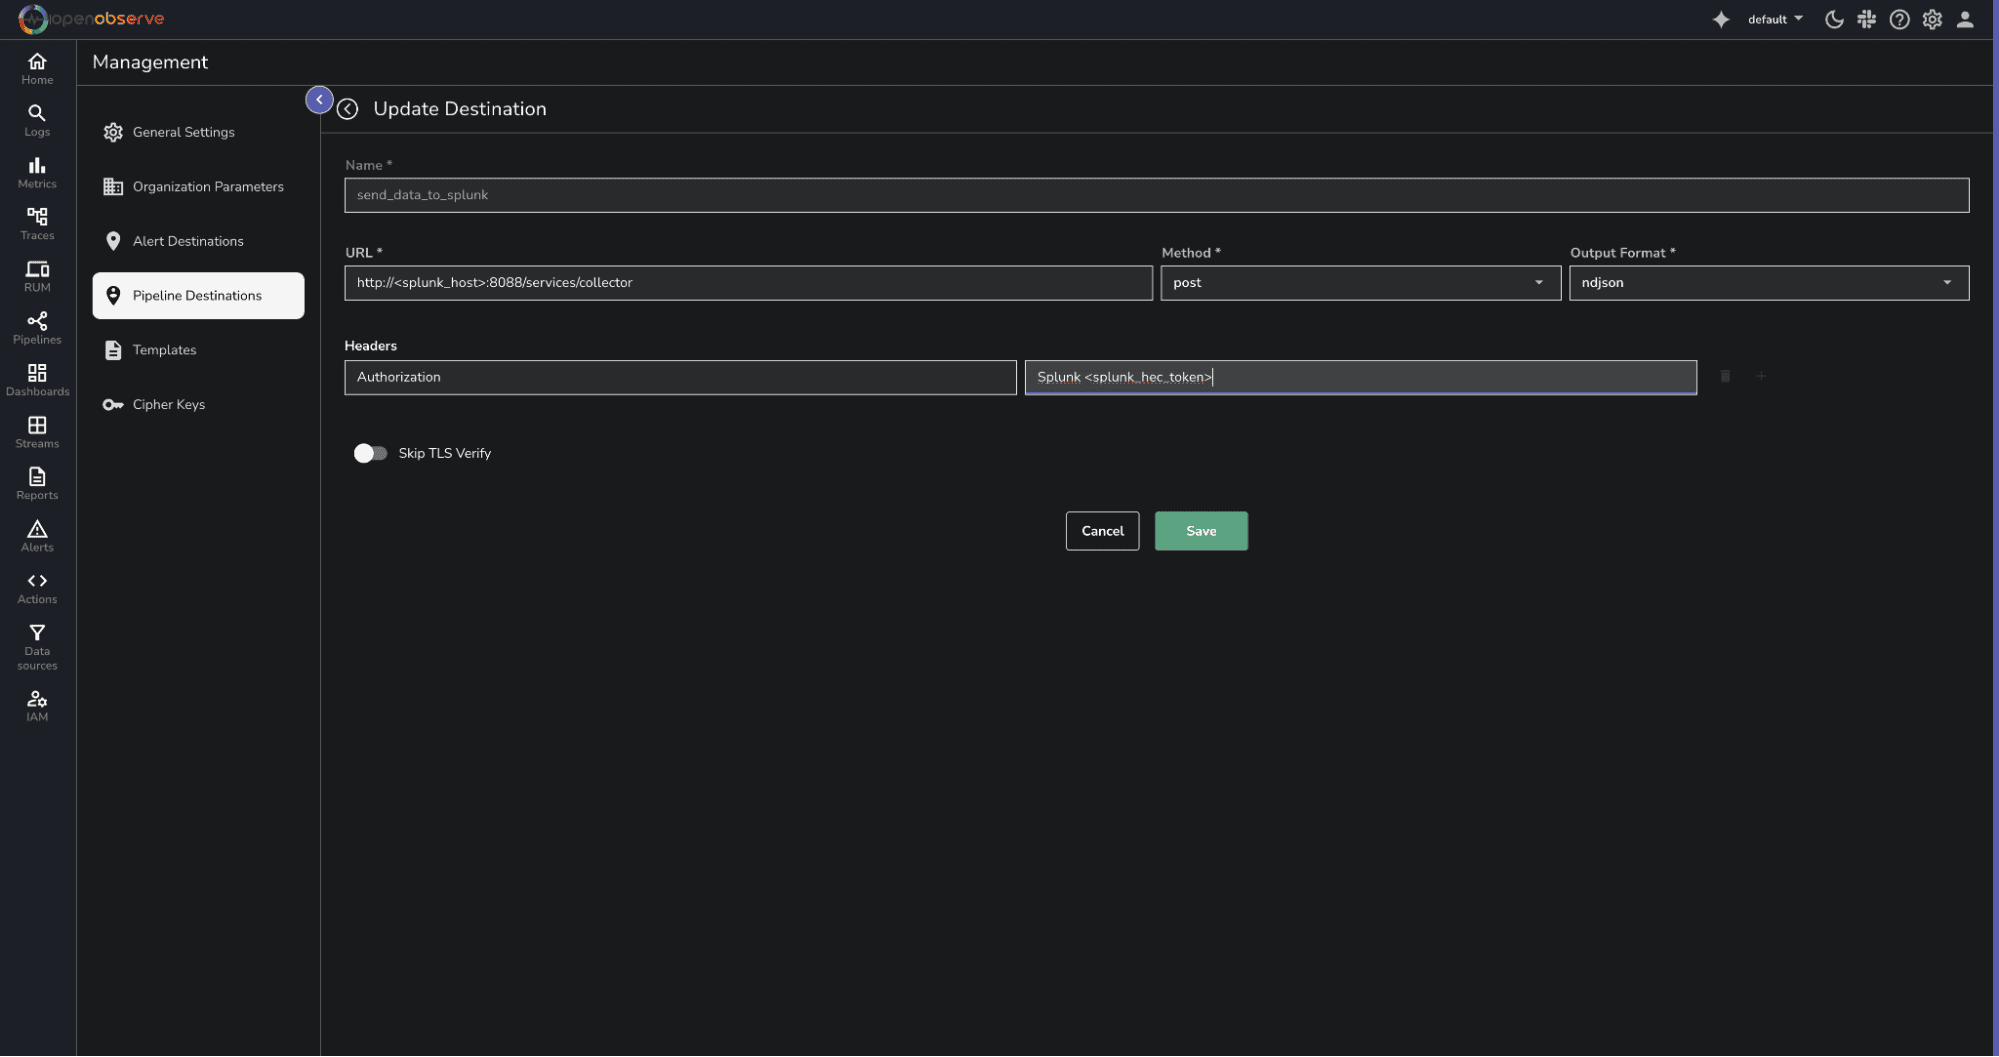
Click Save.
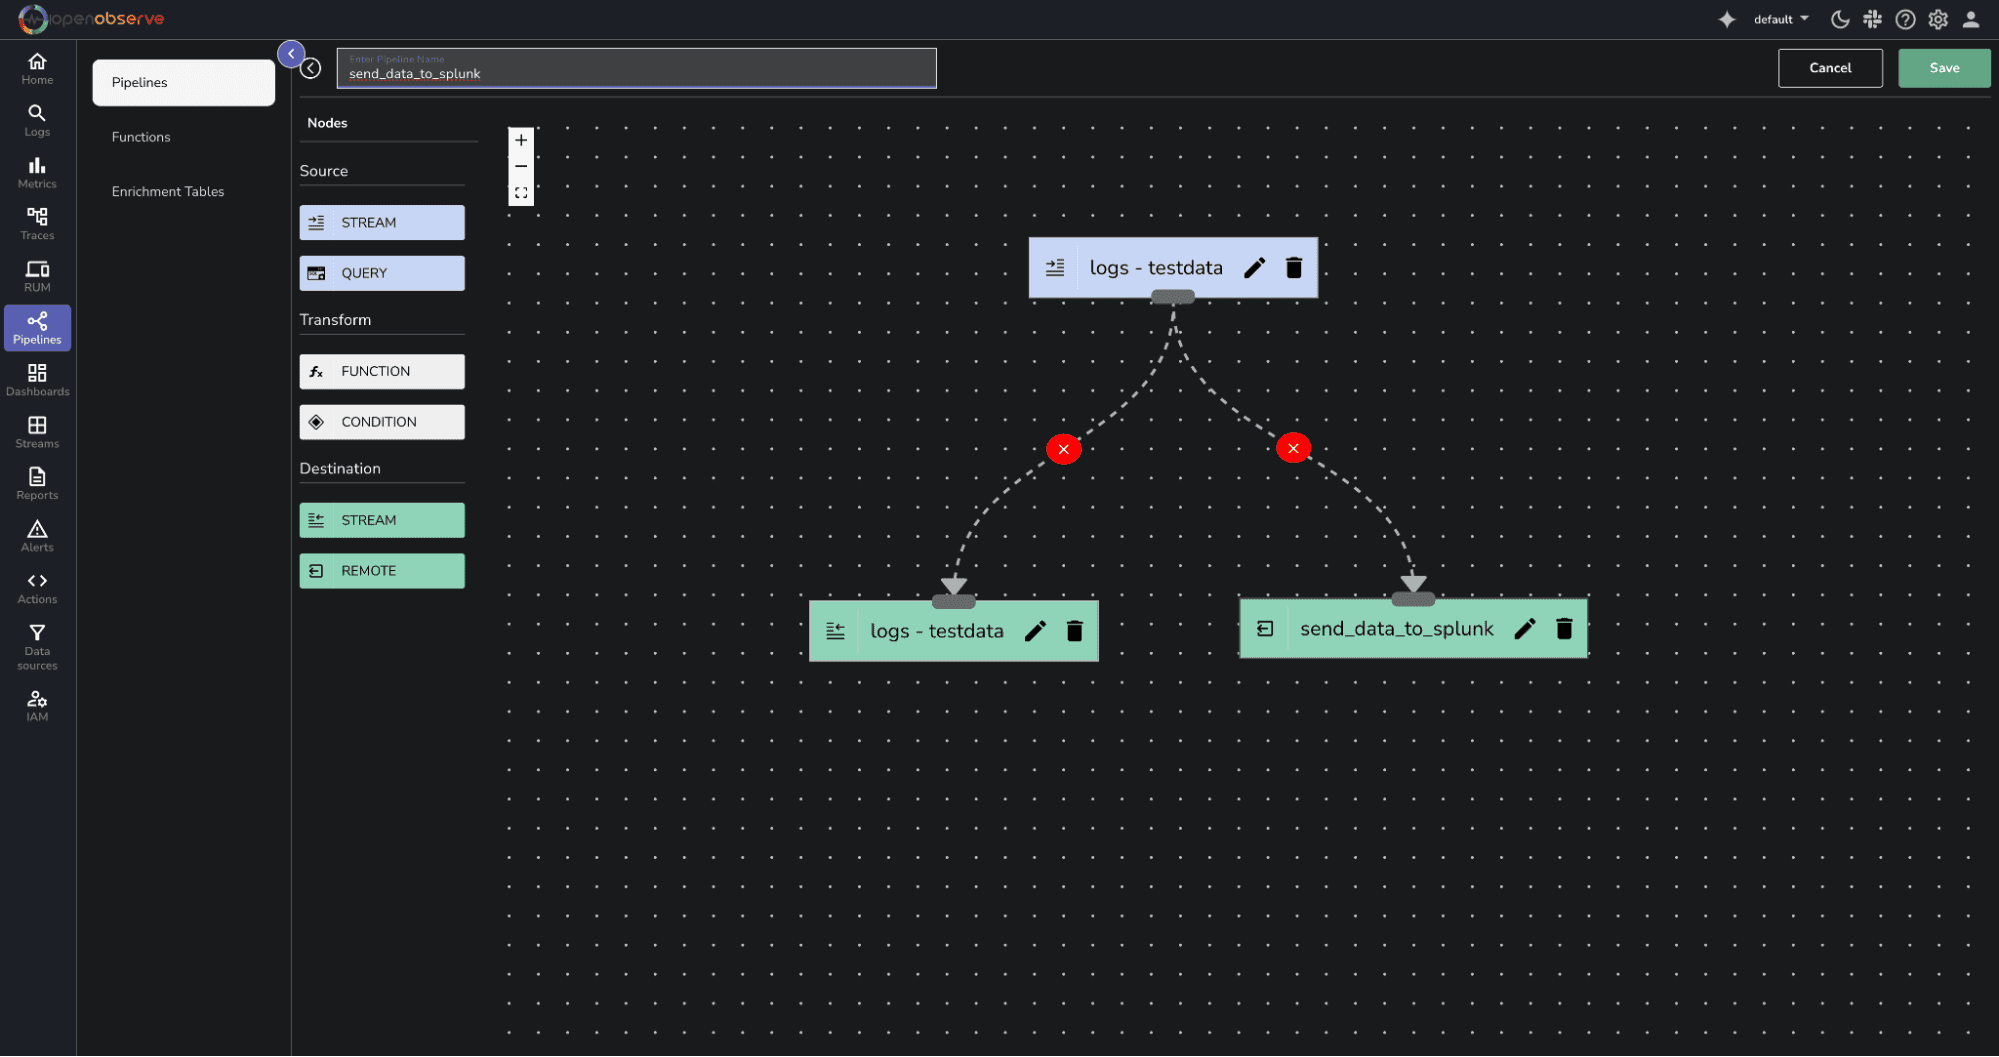 4. Click on Save.
Using curl, send test events.
curl -u mosraf@openobserve.ai:5xHyvwn4C5agaLcD -k https://api.openobserve.ai/api/2xGA0Bu9jONzJurSbT4i44Ce9h0/testdata/_json -d '[{"level":"info","job":"prod","log":"test message for openobserve"},{"level":"error","job":"prod","log":"test message for openobserve"}]'
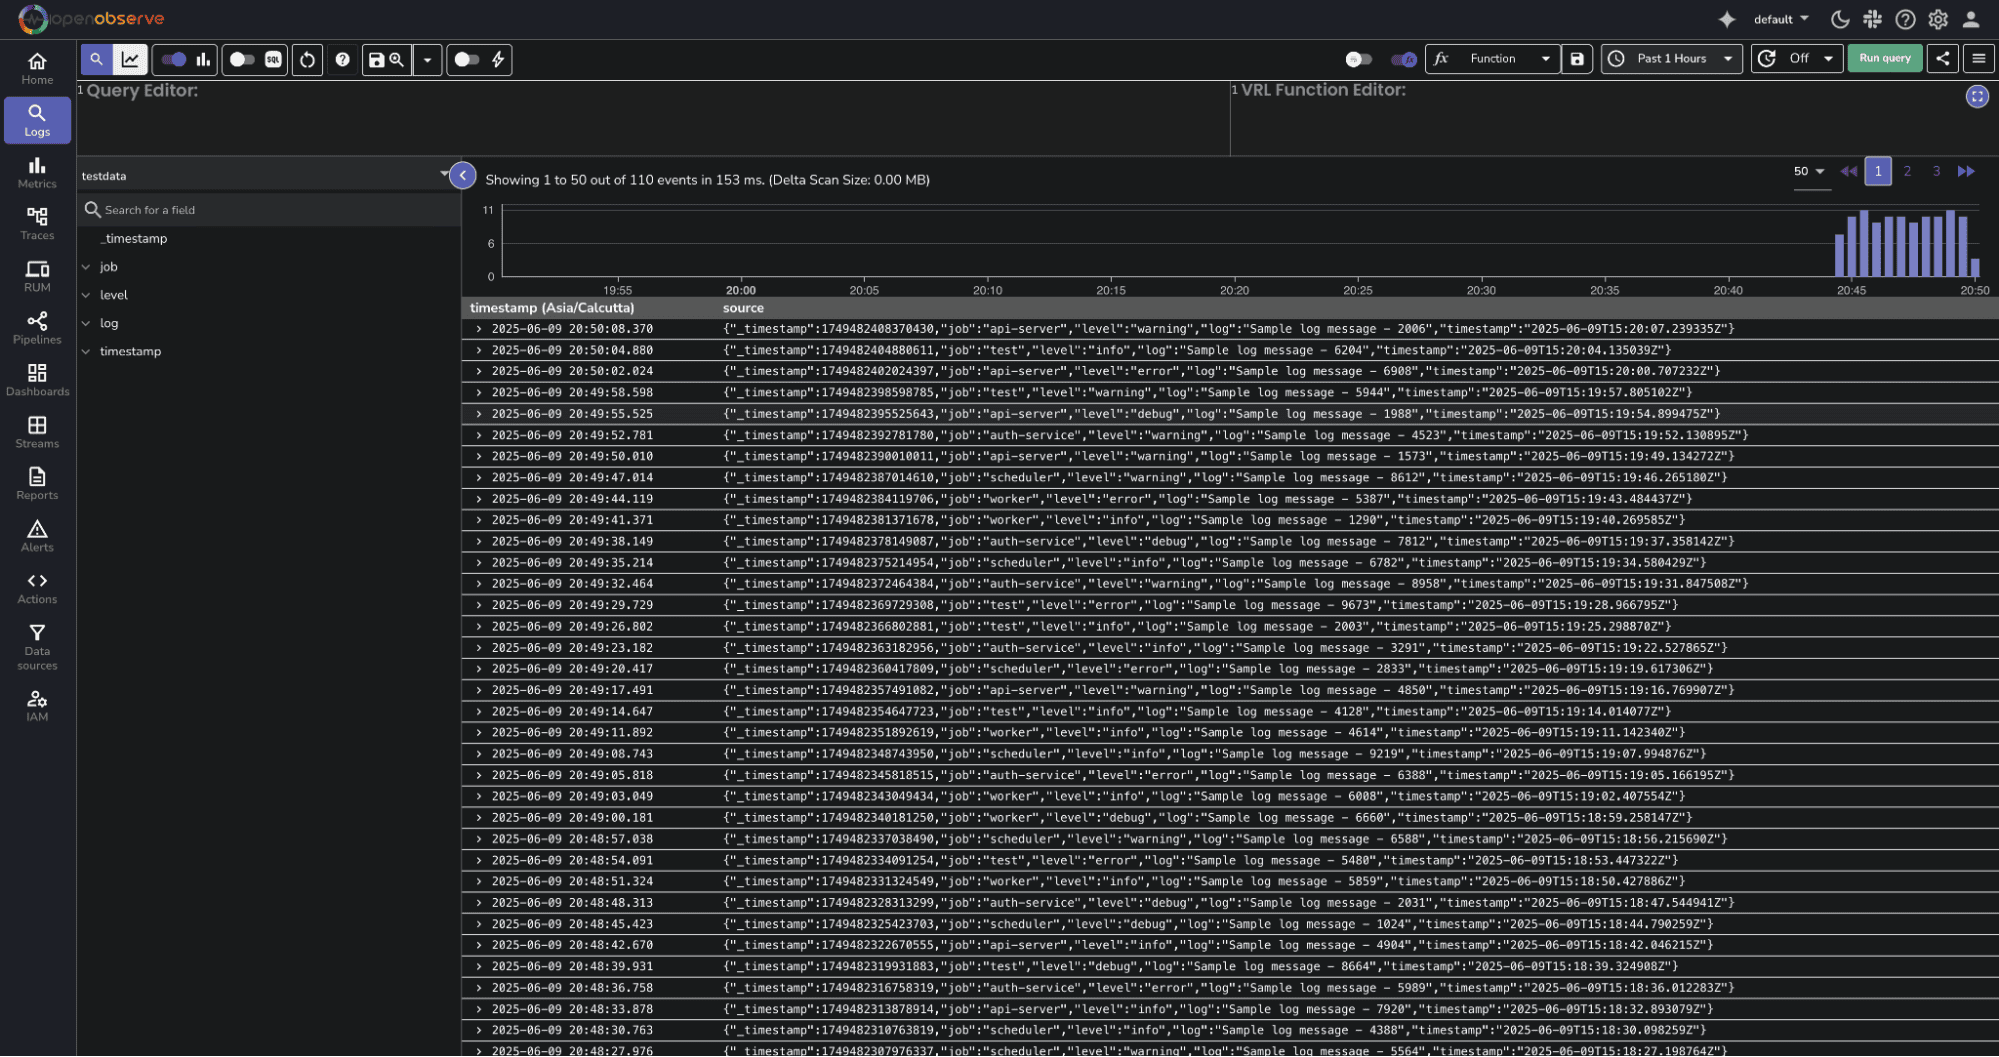
Run a search in OpenObserve to confirm your event was ingested:
Run a search in Splunk confirm your event was ingested:
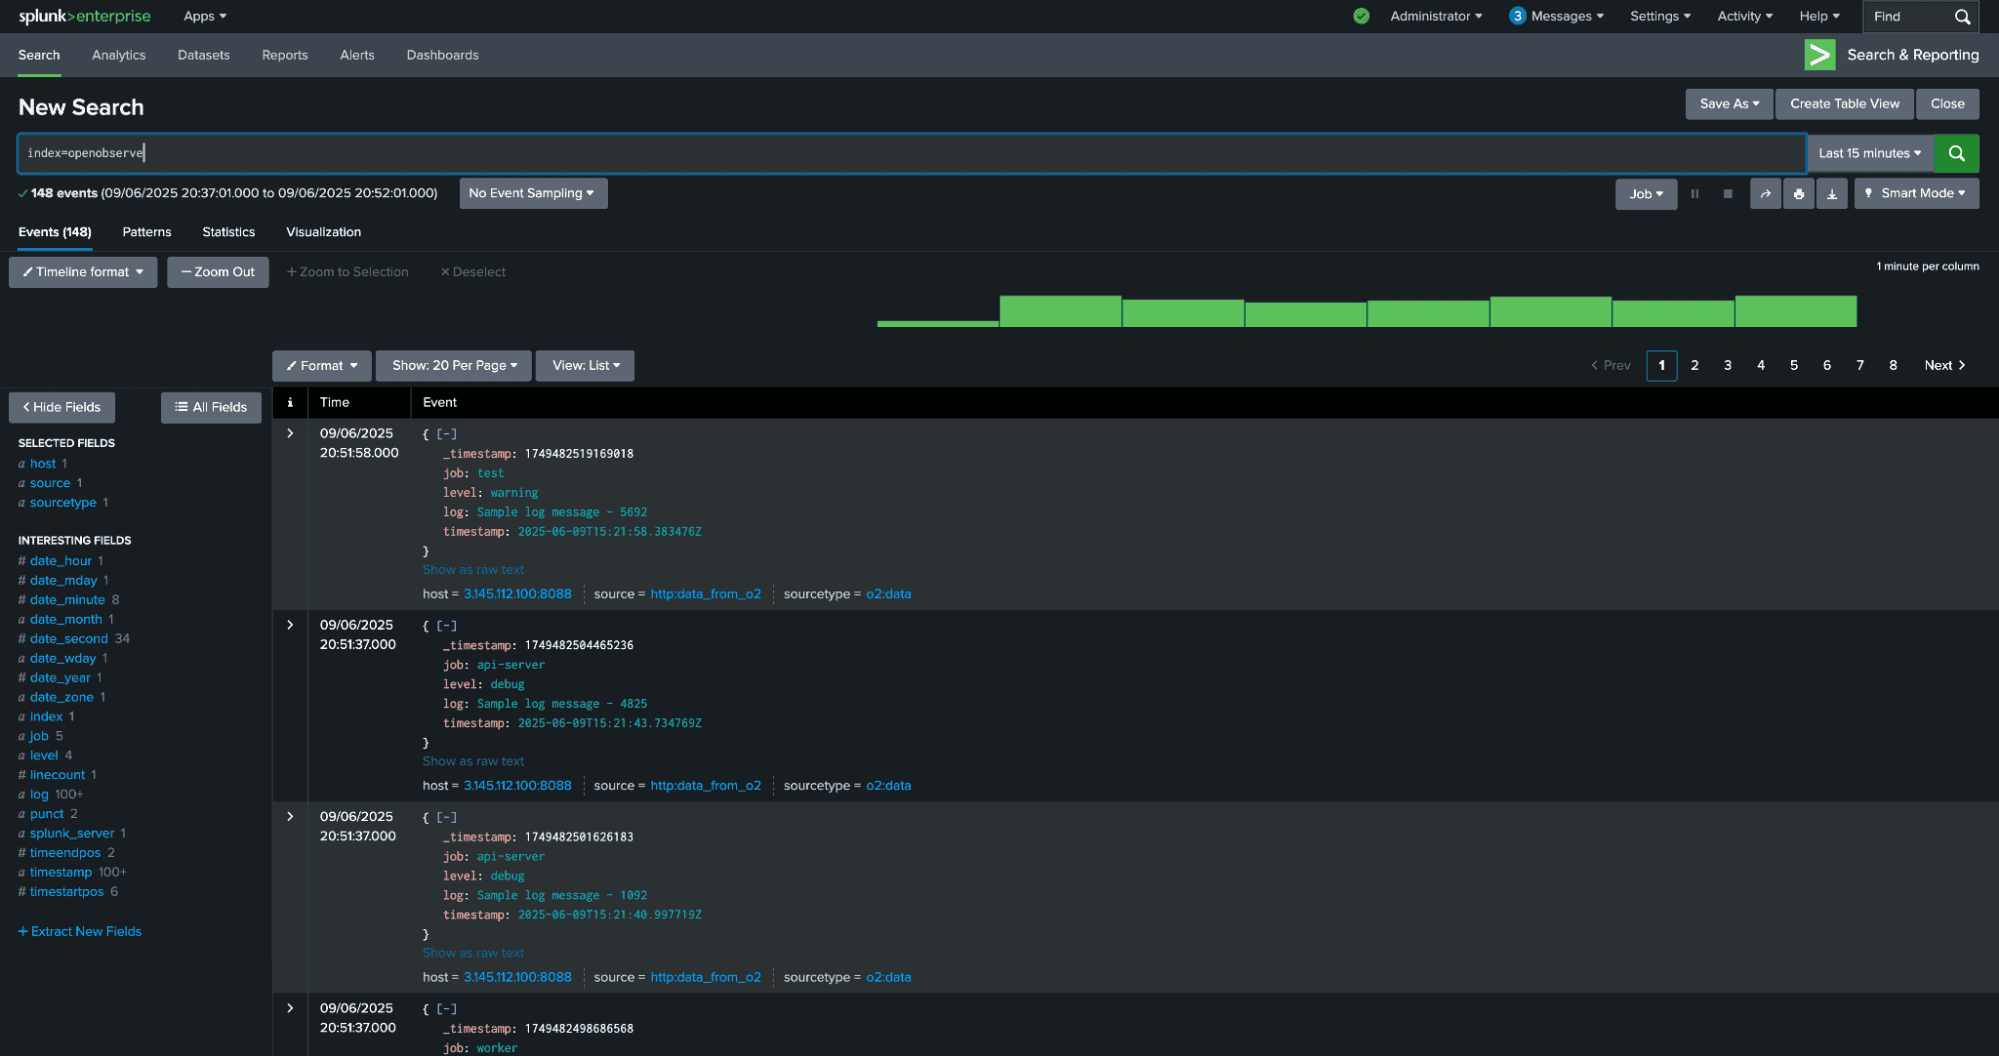 You should see the event from OpenObserve in your search results.
403 Forbidden: Check if the HEC token is correct and has access to the target index.
500 Internal Server Error: Ensure the payload is valid JSON. Use tools like jq to validate.
No data in Splunk: Verify the index exists, verify HEC is enabled, and verify the event format is correct.
Sending OpenObserve logs to Splunk via HEC is straightforward and powerful. It enables your team to leverage Splunk’s advanced analytics and alerting while still using OpenObserve for real-time observability. By bridging these two platforms, you ensure that all your logs—no matter the source—are available in one centralized place.
Additional Resources
I'm a Solution Architect and Observability Engineer with over 10 years of experience helping organizations build resilient, transparent systems. As a Certified Splunk Consultant, I've spent my career turning data into actionable insights that drive real business outcomes. I'm passionate about open source observability tools and believe that robust monitoring is the foundation of modern infrastructure. I share practical strategies, lessons learned, and hands-on guidance from the trenches of enterprise observability


