Monitor Linux systems with OpenObserve. Learn how to collect and analyze system logs, metrics, and security events for improved system visibility, troubleshooting, and compliance. Get insights into performance monitoring and security with OpenObserve.
Set up comprehensive Windows monitoring with OpenObserve. Collect, analyze, and visualize event logs, performance metrics, and security events for enhanced troubleshooting and system visibility.
Learn how to monitor Docker container metrics using OpenTelemetry and OpenObserve. Collect CPU, memory, network, and disk metrics without modifying your applications.
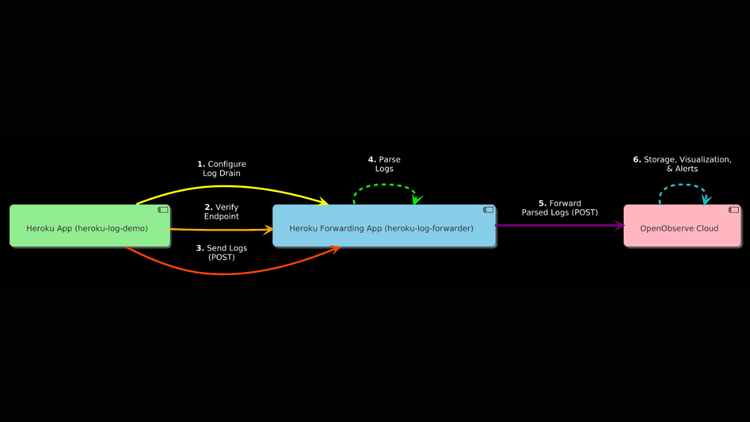
Learn how to set up Heroku Log Drains to seamlessly send logs to OpenObserve using a forwarding app.
Learn everything about Windows IIS logging, from setup and configuration to log collection and parsing. Enhance your understanding and improve your IIS log management with step-by-step instructions and practical examples.
Learn how to monitor Nginx logs in real-time with this step-by-step guide, covering essential techniques for tracking logs, metrics, and performance insights. Discover best practices to optimize Nginx performance, troubleshoot issues faster, and ensure high availability by gaining actionable visibility into your web server’s health.
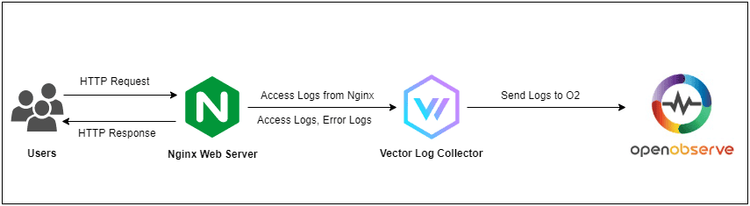
This blog guides you through effective Nginx log management and analysis using OpenObserve and Vector, providing insights on enhancing observability and streamlining your logging process.
Setup Fluent Bit on Ubuntu for Efficient Log Forwarding