In 2025, Kubernetes monitoring has become essential for managing cloud-native infrastructure at scale. Modern Kubernetes monitoring tools go far beyond basic cluster metrics, offering comprehensive visibility into nodes, pods, containers, deployments, and the entire application stack running within clusters.
Teams managing Kubernetes environments rely on advanced monitoring solutions to:
- Monitor cluster health, resource utilization, and performance across multi-cluster deployments
- Detect and troubleshoot issues in containerized workloads before they impact users
- Optimize resource allocation and prevent costly over-provisioning
- Ensure application reliability and meet SLOs in dynamic environments
- Maintain security posture and compliance across Kubernetes infrastructure
In this guide, we'll explore the Top 10 Kubernetes Monitoring Tools in 2025, comparing their capabilities, trade-offs, and ideal use cases for DevOps, SRE, and platform engineering teams.
For broader context, you may also find helpful our Top 10 Observability Platforms in 2025, Top 10 Open-Source Monitoring Tools in 2025, and the strategic overview Enterprise Observability Strategy Insights.
What Is a Kubernetes Monitoring Tool?
A Kubernetes monitoring tool is software designed to collect, visualize, and analyze metrics, logs, and events from Kubernetes clusters and the workloads running within them. These tools provide visibility into:
- Cluster-level metrics (CPU, memory, disk, network across nodes)
- Pod and container resource usage and health
- Kubernetes events and state changes
- Application performance within containers
- Service mesh traffic and latency
- Control plane health and API server performance
The primary goals of Kubernetes monitoring tools are to:
- Provide comprehensive visibility: Monitor all layers from infrastructure to applications
- Enable rapid troubleshooting: Quickly identify and diagnose issues in dynamic environments
- Optimize resource usage: Right-size deployments and prevent waste
- Ensure reliability: Maintain uptime and performance SLOs
- Support autoscaling decisions: Provide metrics for HPA and VPA configurations
Why Kubernetes Monitoring Matters
Effective Kubernetes monitoring delivers several critical benefits:
1. Managing Complexity: Kubernetes environments are inherently complex with ephemeral pods, dynamic scheduling, and distributed architectures. Monitoring provides the visibility needed to understand what's actually running.
2. Resource Optimization: Kubernetes makes it easy to deploy workloads, but without monitoring, teams often over-provision resources significantly, wasting cloud spend.
3. Faster Incident Response: When pods crash, nodes fail, or applications slow down, monitoring tools help teams quickly identify root causes and restore service.
4. Capacity Planning: Understanding resource trends helps teams plan cluster scaling and avoid capacity constraints during traffic spikes.
5. Cost Management: Monitoring resource utilization helps identify waste, optimize pod resource requests/limits, and reduce cloud bills.
6. Security and Compliance: Tracking cluster configuration, access patterns, and workload behavior helps detect security threats and maintain compliance.
What to Look for in a Kubernetes Monitoring Tool
When evaluating Kubernetes monitoring tools, consider these key factors:
| Feature
|
Why It Matters
|
| Native Kubernetes Support
|
Deep integration with Kubernetes APIs, CRDs, and core concepts
|
| Metric Collection
|
Comprehensive metrics from kubelet, cAdvisor, kube-state-metrics
|
| Multi-Cluster Support
|
Ability to monitor multiple clusters from a single interface
|
| Container-Level Visibility
|
Metrics and logs at pod and container granularity
|
| Resource Attribution
|
Link resource usage to specific services, teams, or namespaces
|
| Alerting Capabilities
|
Kubernetes-aware alerts for pod failures, resource exhaustion, etc.
|
| Visualization & Dashboards
|
Pre-built dashboards for cluster health and workload performance
|
| Log Integration
|
Unified view of metrics and logs for troubleshooting
|
| Service Mesh Support
|
Monitor Istio, Linkerd, or other service mesh deployments
|
| Cost Efficiency
|
Reasonable pricing that scales with your cluster size
|
| Deployment Model
|
Self-hosted, SaaS, or hybrid options to match your requirements
|
Top 10 Kubernetes Monitoring Tools: Detailed Comparison
Jump to comparison table for different K8s monitoring tools and use cases.
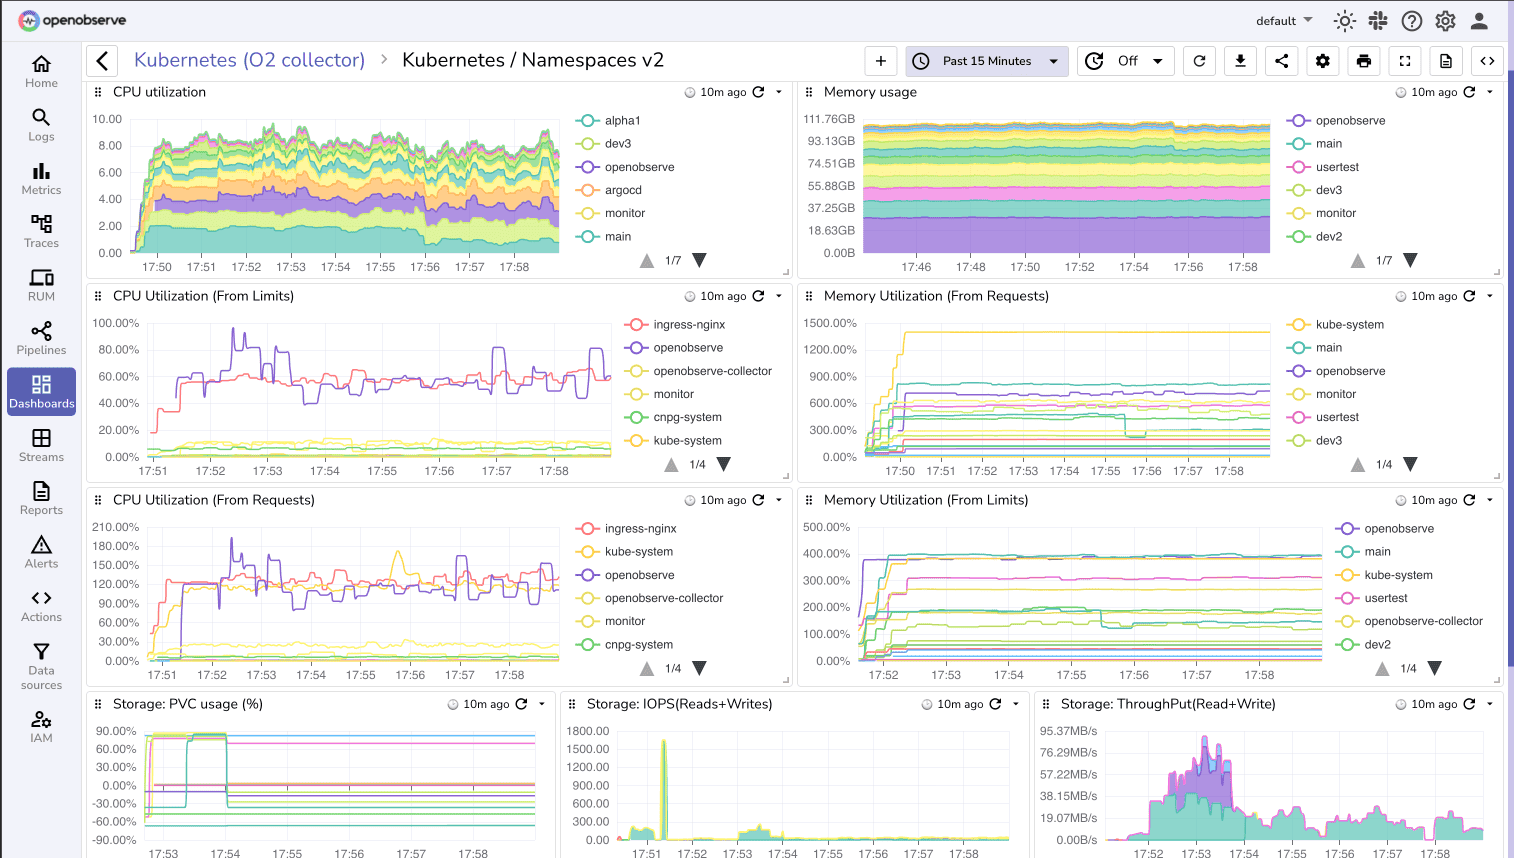
1. OpenObserve
OpenObserve is an open source unified observability platform that provides comprehensive Kubernetes monitoring through metrics, logs, and traces with SQL-based querying and powerful visualization.
OpenObserve Pros:
- Unified Observability: Monitor Kubernetes metrics, logs, and traces in a single platform
- SQL-Based Analytics: Query cluster metrics using familiar SQL syntax
- High Compression: compression reduces storage costs for metrics and logs
- Native Kubernetes Integration: Helm charts and Kubernetes-native deployment options
- Cost-Effective: Significantly lower costs compared to commercial alternatives
- Custom Dashboards: Build tailored views for cluster health, node status, and workload performance
- Multi-Cluster Support: Monitor multiple Kubernetes clusters from one interface
- OpenTelemetry Native: Full support for modern telemetry standards
- Flexible Alerting: SQL-based alert rules with integration to Slack, PagerDuty, and more
OpenObserve Cons:
- Newer platform with growing Kubernetes-specific dashboard library
- Requires SQL knowledge for advanced custom queries
Integration / Mitigation:
- Deploy using Helm chart for simple Kubernetes installation
- Use Prometheus exporters or OpenTelemetry Collector for metric collection
- Integrate with existing Kubernetes logging solutions (Fluent Bit, Vector)
- Leverage pre-built Kubernetes dashboards from the community
- Store data on S3-compatible storage for cost-efficient long-term retention
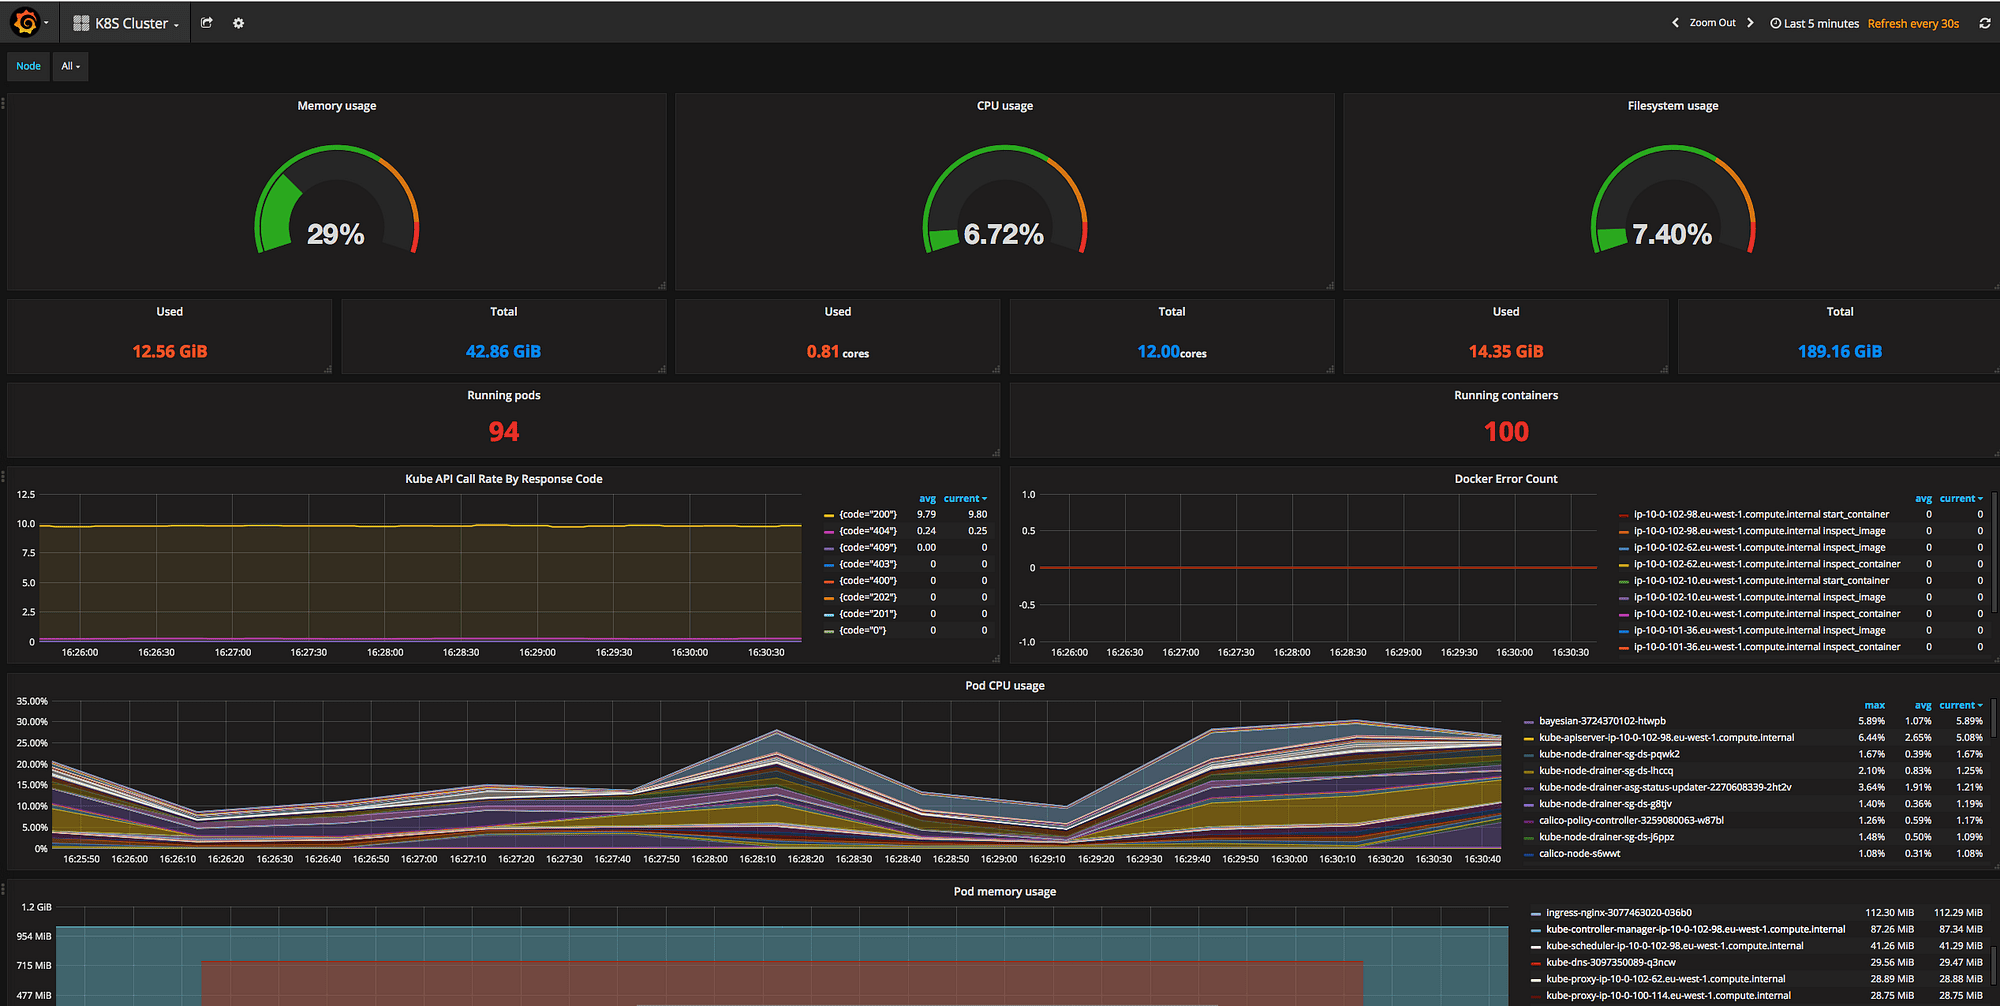
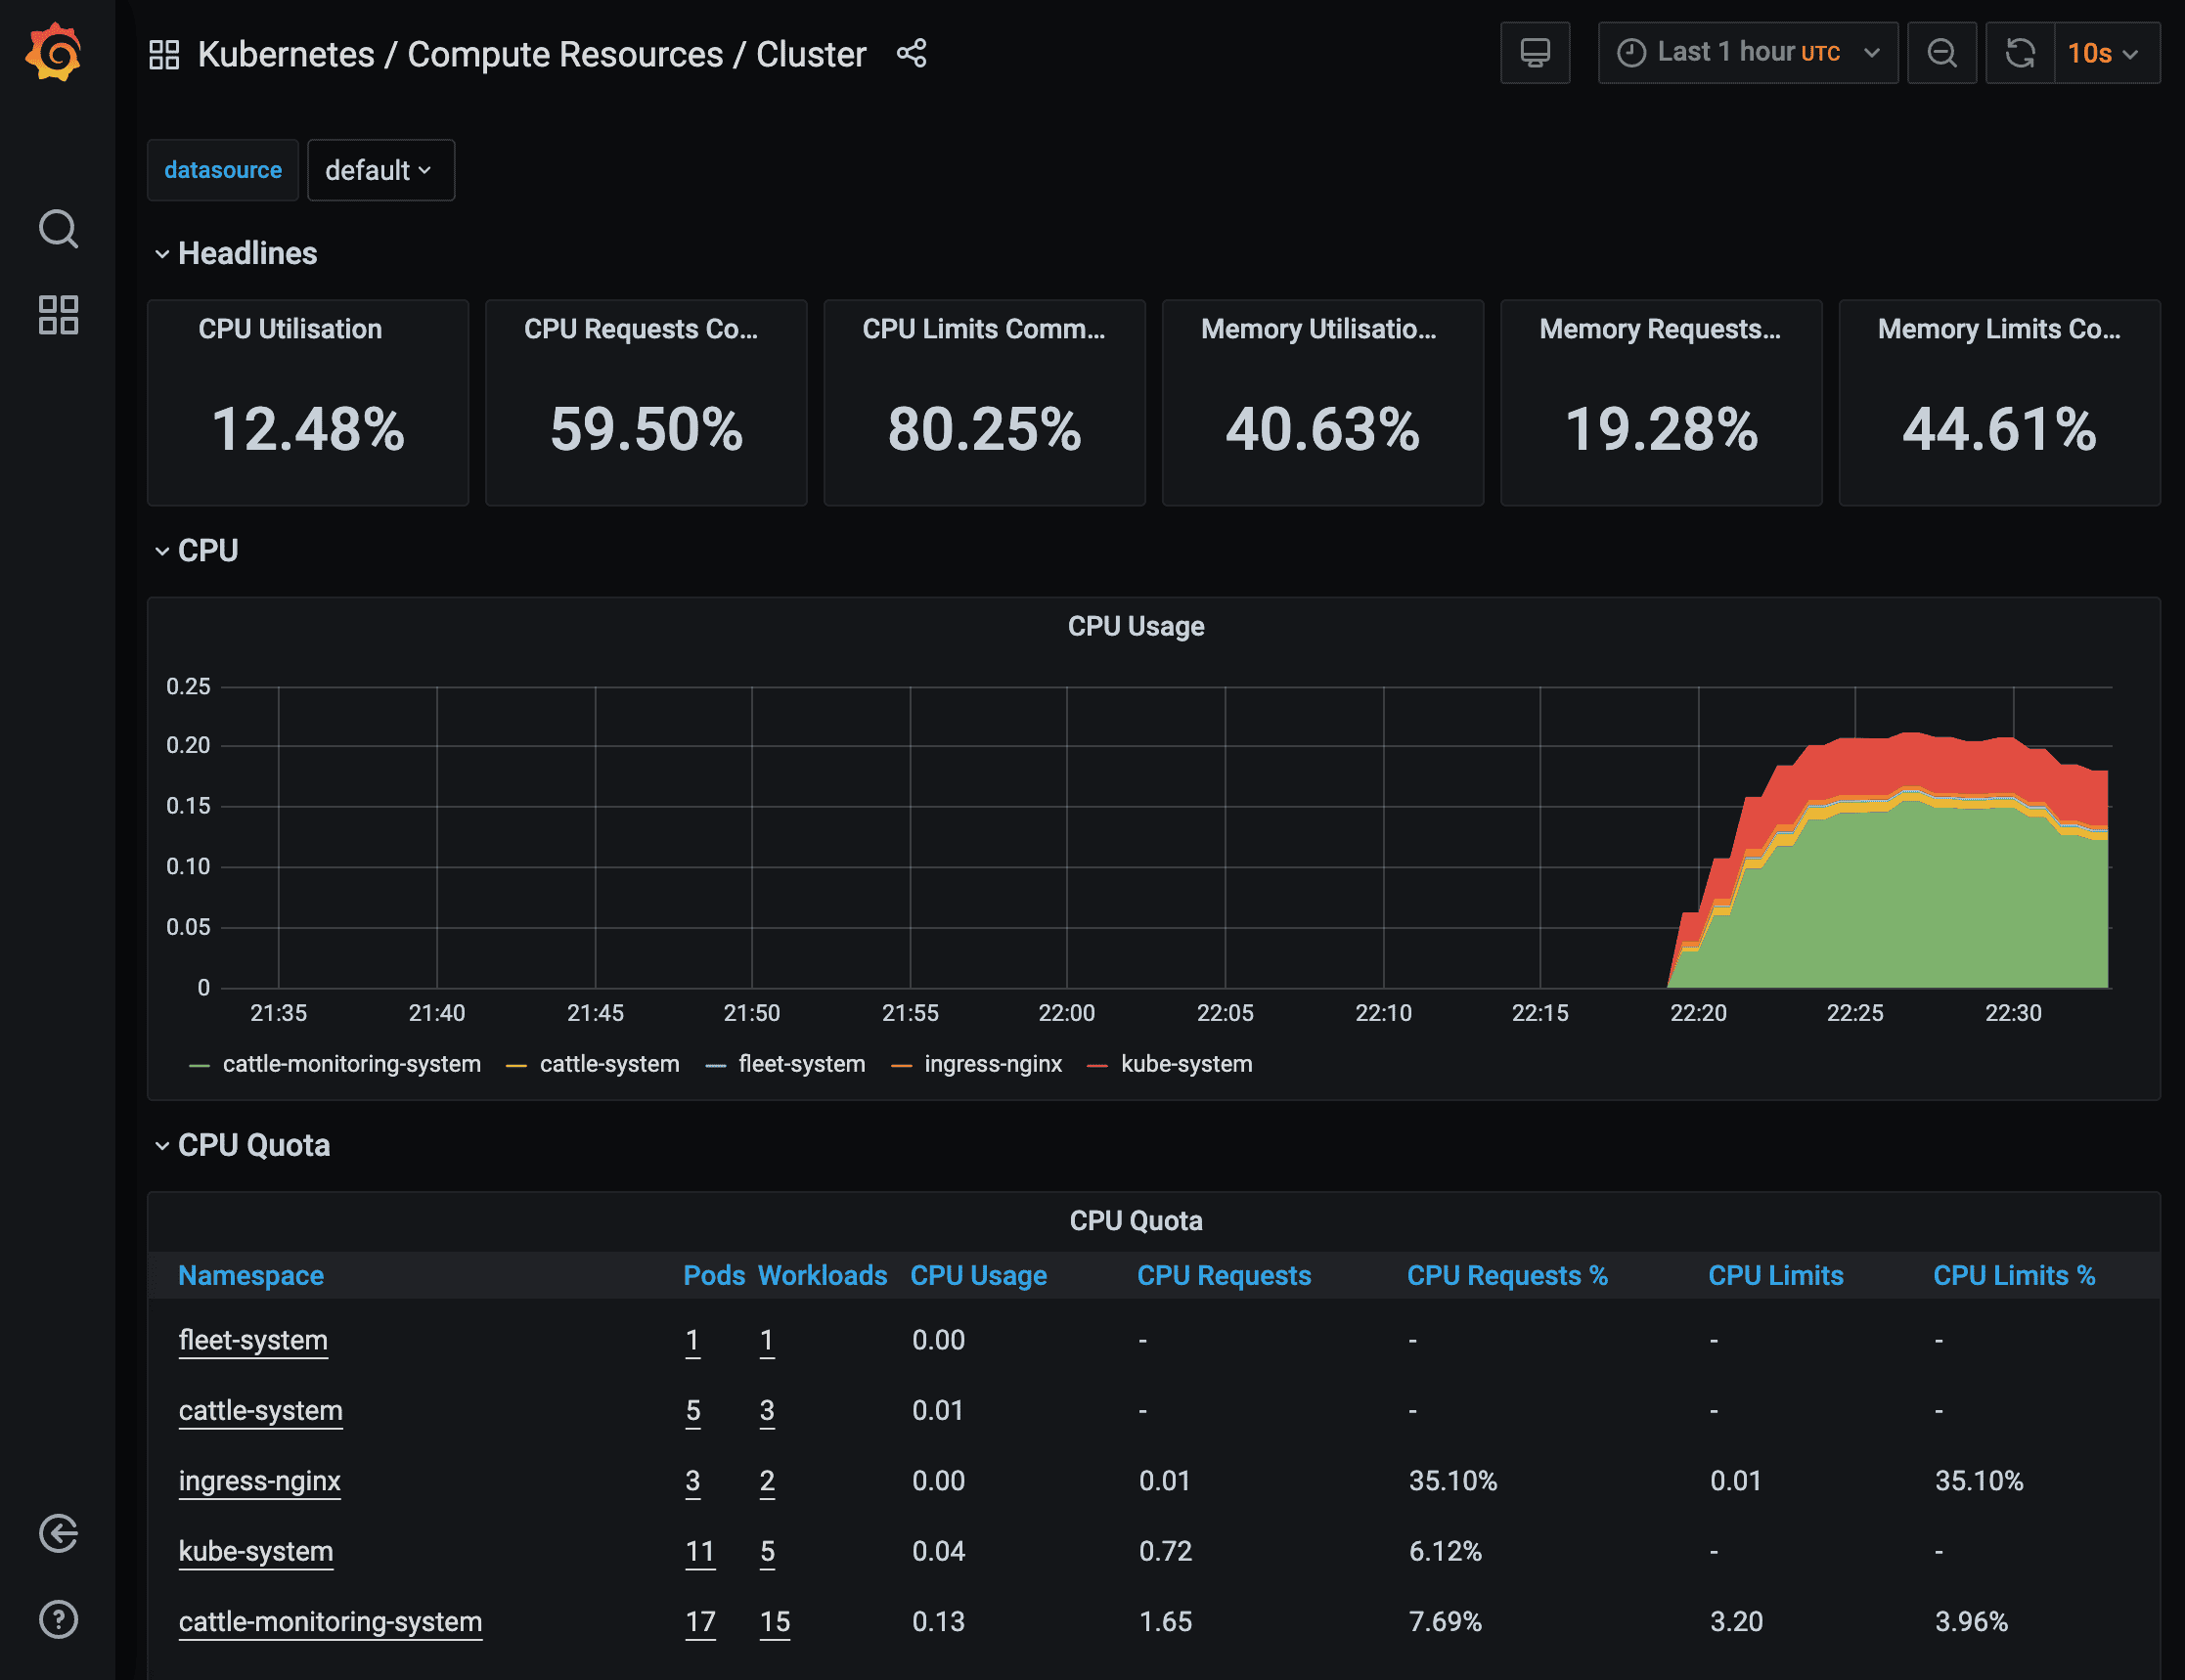
2. Prometheus + Grafana
Prometheus is the de facto standard for Kubernetes monitoring, originally built by SoundCloud and now a CNCF graduated project. Combined with Grafana for visualization, it forms the most popular open source Kubernetes monitoring stack.
Prometheus + Grafana Pros:
- Industry Standard: Native Kubernetes integration, widely adopted across the ecosystem
- Rich Ecosystem: Extensive exporters for every Kubernetes component and application
- Powerful Query Language: PromQL enables flexible metric analysis
- Service Discovery: Automatic discovery of Kubernetes services and pods
- Free and Open Source: No licensing costs, full control over deployment
- Active Community: Large community with extensive documentation and examples
- Grafana Dashboards: Thousands of pre-built dashboards for Kubernetes monitoring
Prometheus + Grafana Cons:
- Limited Long-Term Storage: Prometheus local storage not designed for long-term retention
- Scaling Challenges: Single Prometheus instance has limits; federation can be complex
- No Built-In Logs: Requires separate log aggregation solution
- Operational Overhead: Requires managing Prometheus servers, Grafana, and storage
- No Native Tracing: Need additional tools for distributed tracing
- Alert Management Complexity: Alertmanager configuration can be challenging
Integration / Mitigation:
- Use Thanos or Cortex for long-term storage and multi-cluster monitoring
- Deploy using Prometheus Operator for easier Kubernetes management
- Use OpenObserve for unified observability
- Use kube-prometheus-stack Helm chart for complete monitoring setup
- Consider managed Prometheus services to reduce operational burden
3. Datadog
Datadog provides comprehensive Kubernetes monitoring as part of its full-stack observability platform, with automatic discovery, tagging, and correlation across the entire stack.

Datadog Pros:
- Automatic Discovery: Automatically detects and monitors Kubernetes components
- Unified Platform: Metrics, logs, traces, and APM in one place
- Container Map: Visual topology of pods, services, and dependencies
- Live Container Monitoring: Real-time visibility into container resource usage
- Kubernetes Events: Integrated view of cluster events alongside metrics
- Network Performance Monitoring: Deep visibility into service-to-service communication
- Out-of-Box Dashboards: Pre-configured dashboards for clusters, nodes, and pods
- Powerful Alerting: Sophisticated alert conditions with anomaly detection
Datadog Cons:
- High Cost: Expensive per-container pricing adds up quickly in large clusters
- Vendor Lock-In: Proprietary platform with limited data portability
- Cost Unpredictability: Bills can spike with pod scaling or new deployments
- SaaS Only: No self-hosted option for regulated environments
- Complex Pricing: Multiple SKUs for different monitoring features
Integration / Mitigation:
- Deploy Datadog Agent as DaemonSet for cluster-wide monitoring
- Use container exclusion rules to reduce monitored container count
- Consider OpenObserve for cost-sensitive workloads with similar capabilities
- Leverage APM integration for full application visibility
4. New Relic
New Relic offers Kubernetes monitoring integrated with its full-stack observability platform, providing deep insights into cluster health and application performance.
 New Relic Pros:
- Kubernetes Navigator: Interactive cluster exploration with filtering and search
- Deep APM Integration: Correlate Kubernetes metrics with application performance
- NRQL Analytics: Powerful query language for custom analysis
- Automated Instrumentation: Quick setup with minimal configuration
- Pixie Integration: eBPF-based deep observability without code changes
- Multi-Cluster Management: Monitor multiple clusters from unified interface
New Relic Cons:
- Cost at Scale: Data ingest pricing can be expensive for large clusters
- Learning Curve: NRQL requires learning a new query syntax
- Retention Limits: Default 30-day retention, extended retention costs extra
- SaaS Only: No on-premises deployment option
Integration / Mitigation:
- Deploy using New Relic Kubernetes integration Helm chart
- Use drop filters to reduce data ingestion from verbose sources
- Leverage Pixie for eBPF-based monitoring without application instrumentation
- Consider OpenObserve for long-term metrics retention at lower cost
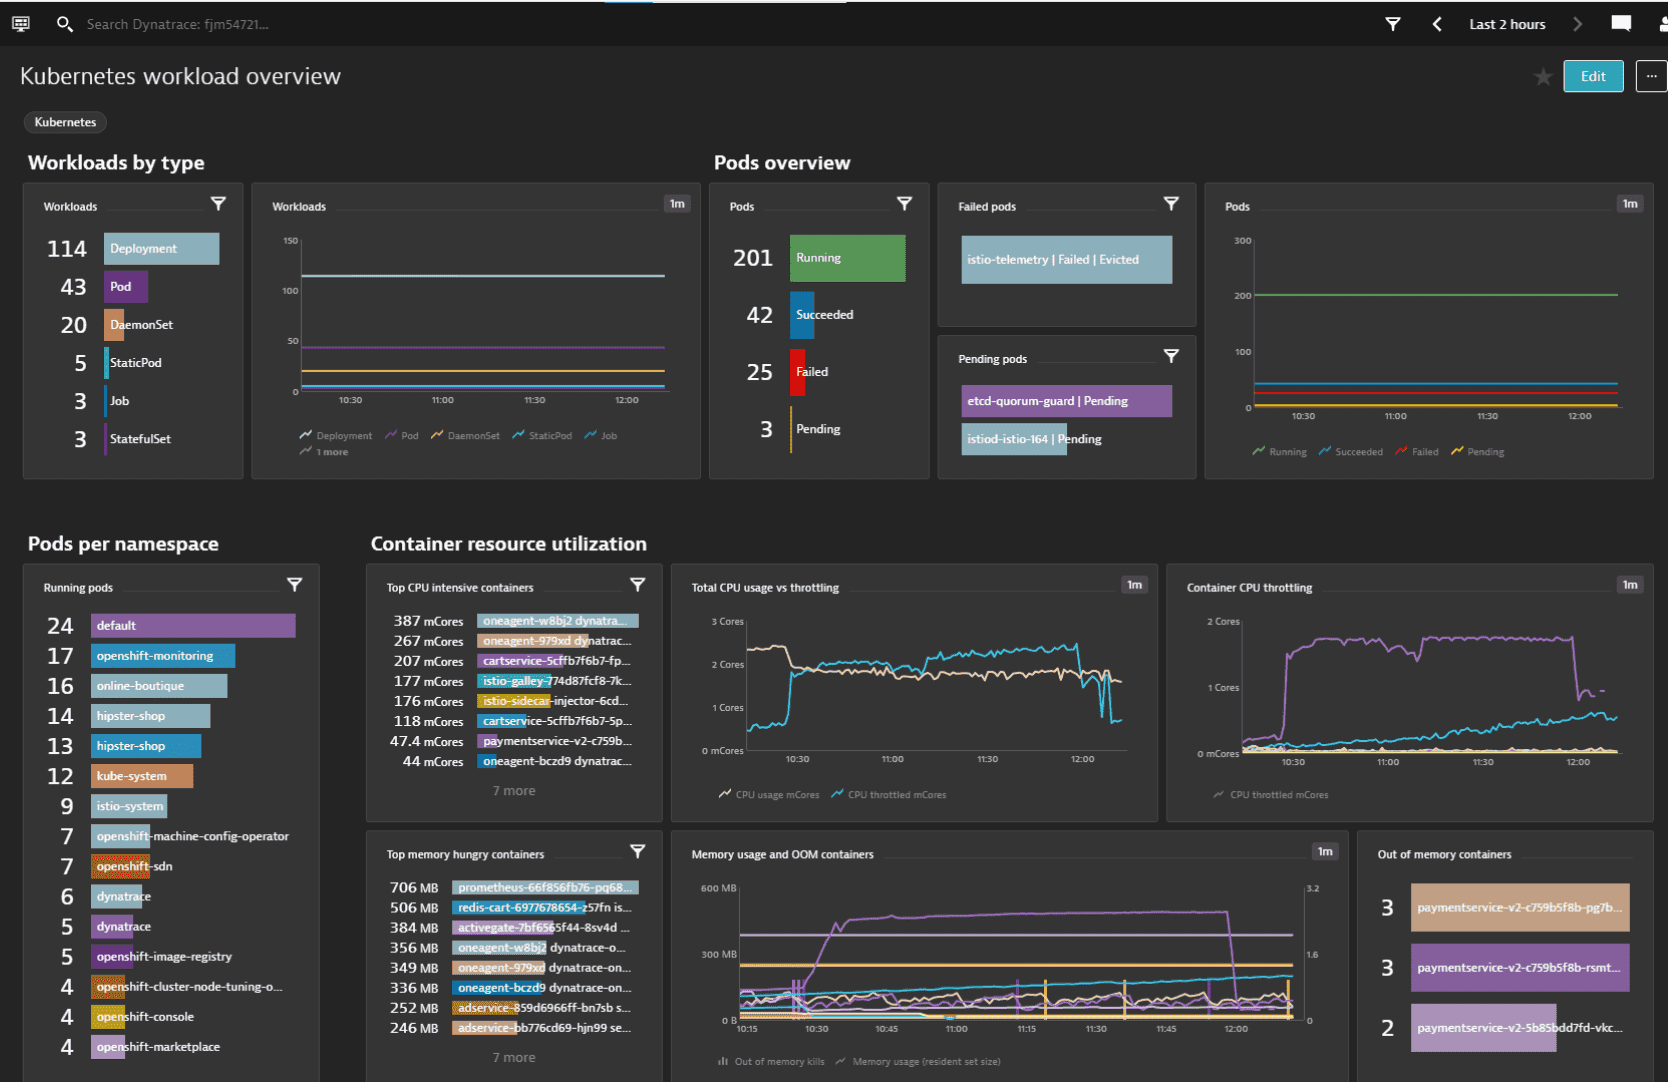
5. Dynatrace
Dynatrace provides AI-powered Kubernetes monitoring with automatic discovery, dependency mapping, and root cause analysis powered by its Davis AI engine.
Dynatrace Pros:
- Automatic Discovery: Zero-config monitoring of Kubernetes and workloads
- Davis AI: AI-powered anomaly detection and root cause analysis
- Full-Stack Visibility: From infrastructure to application code in one platform
- Smartscape Topology: Real-time dependency mapping across services
- Problem Detection: Automatic correlation of issues across the stack
- Enterprise Scale: Designed for very large, complex environments
- Security Monitoring: Runtime vulnerability detection and compliance
Dynatrace Cons:
- Premium Pricing: Very expensive, especially for large cluster deployments
- Complex Licensing: Difficult to predict costs with complex unit-based pricing
- Vendor Lock-In: Proprietary platform limits portability
- Less Customization: Limited flexibility compared to open source tools
Integration / Mitigation:
- Deploy OneAgent as DaemonSet for automatic instrumentation
- Best suited for large enterprises with significant monitoring budgets
- Consider OpenObserve for cost-sensitive workloads or development clusters
- Leverage AI features for production critical applications
6. Sysdig
Sysdig specializes in container and Kubernetes security and monitoring, built on open source Falco and providing deep runtime visibility.
Sysdig Pros:
- Container Security: Runtime threat detection and vulnerability scanning
- Deep Visibility: System call-level insights into container behavior
- Prometheus Compatible: Native Prometheus integration for metrics
- Compliance Features: CIS benchmarks and compliance reporting
- Kubernetes Audit: Complete audit trail of cluster activities
- Service Mesh Support: Monitor Istio, Linkerd traffic patterns
- Cost Allocation: Track resource costs by team, namespace, or label
Sysdig Cons:
- Pricing Complexity: Can be expensive for large-scale deployments
- Performance Overhead: Agent can impact performance on heavily loaded nodes
- Learning Curve: Security features require expertise to use effectively
- SaaS Focus: Self-hosted options are limited
Integration / Mitigation:
- Deploy Sysdig Agent as privileged DaemonSet
- Use for security-critical workloads where runtime protection is essential
- Combine with Prometheus for cost-effective metrics collection
- Leverage Falco rules for custom security policies
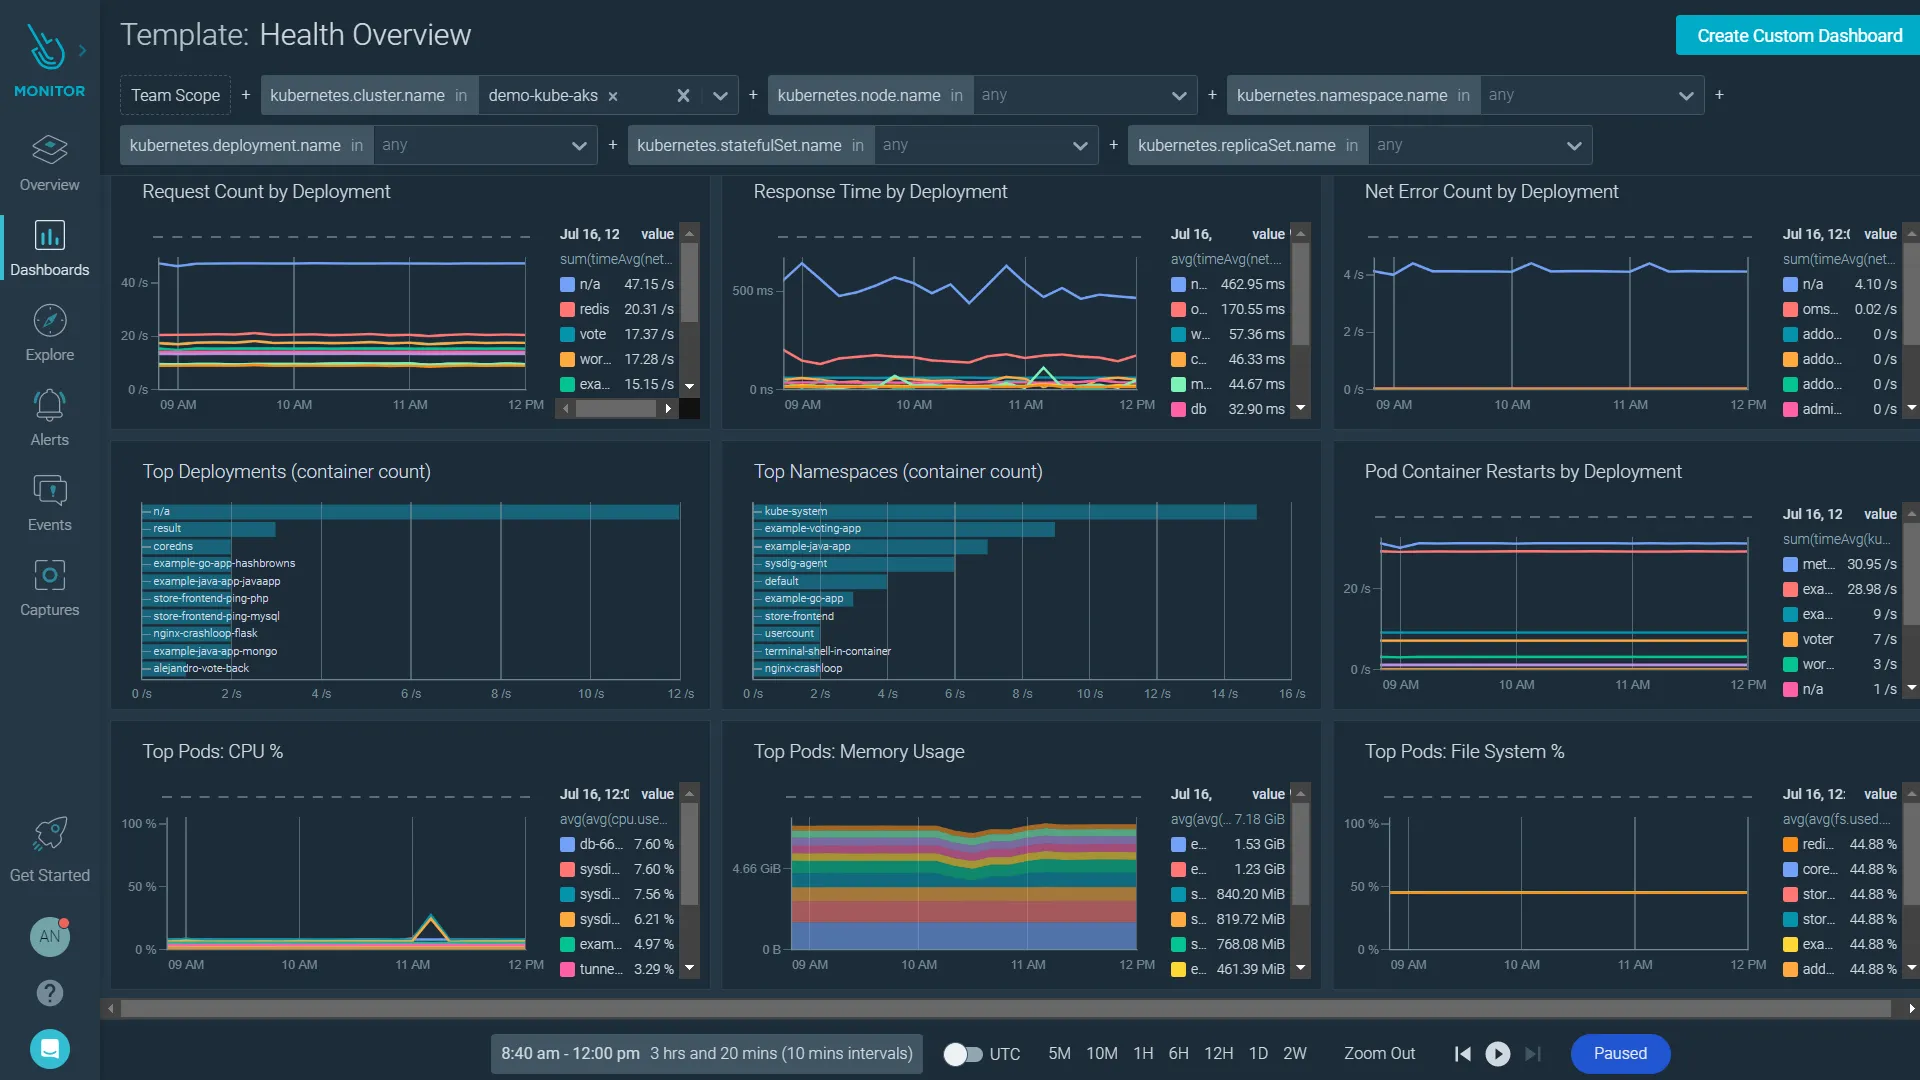
7. Rancher
Rancher is a complete Kubernetes management platform that includes built-in monitoring capabilities, providing multi-cluster management with integrated Prometheus and Grafana monitoring.
 Rancher Pros:
- Multi-Cluster Management: Manage and monitor multiple Kubernetes clusters from a single interface
- Built-In Monitoring: Integrated Prometheus and Grafana deployed automatically
- Cluster Provisioning: Create and manage clusters across cloud providers and on-premises
- RBAC and Security: Centralized access control and security policies
- Application Catalog: Deploy applications with pre-configured monitoring
- Backup and DR: Integrated cluster backup and disaster recovery
- Cost-Effective: Open source with enterprise support options available
- Fleet Management: GitOps-based continuous delivery across clusters
Rancher Cons:
- Additional Layer: Adds management overhead on top of Kubernetes
- Resource Requirements: Rancher control plane needs dedicated resources
- Monitoring Limitations: Built-in monitoring is basic Prometheus/Grafana without advanced features
- Learning Curve: Requires understanding both Kubernetes and Rancher concepts
- Customization Constraints: Less flexible than standalone monitoring solutions
Integration / Mitigation:
- Deploy Rancher for multi-cluster management scenarios
- Use built-in monitoring for baseline visibility, add specialized tools for advanced needs
- Combine with OpenObserve for unified observability across all managed clusters
- Leverage Rancher's catalog to deploy additional monitoring tools consistently
- Best suited for teams managing 3+ Kubernetes clusters
8. Elastic
Elastic Observability provides Kubernetes monitoring built on the Elastic Stack, integrating metrics, logs, APM, and uptime monitoring.
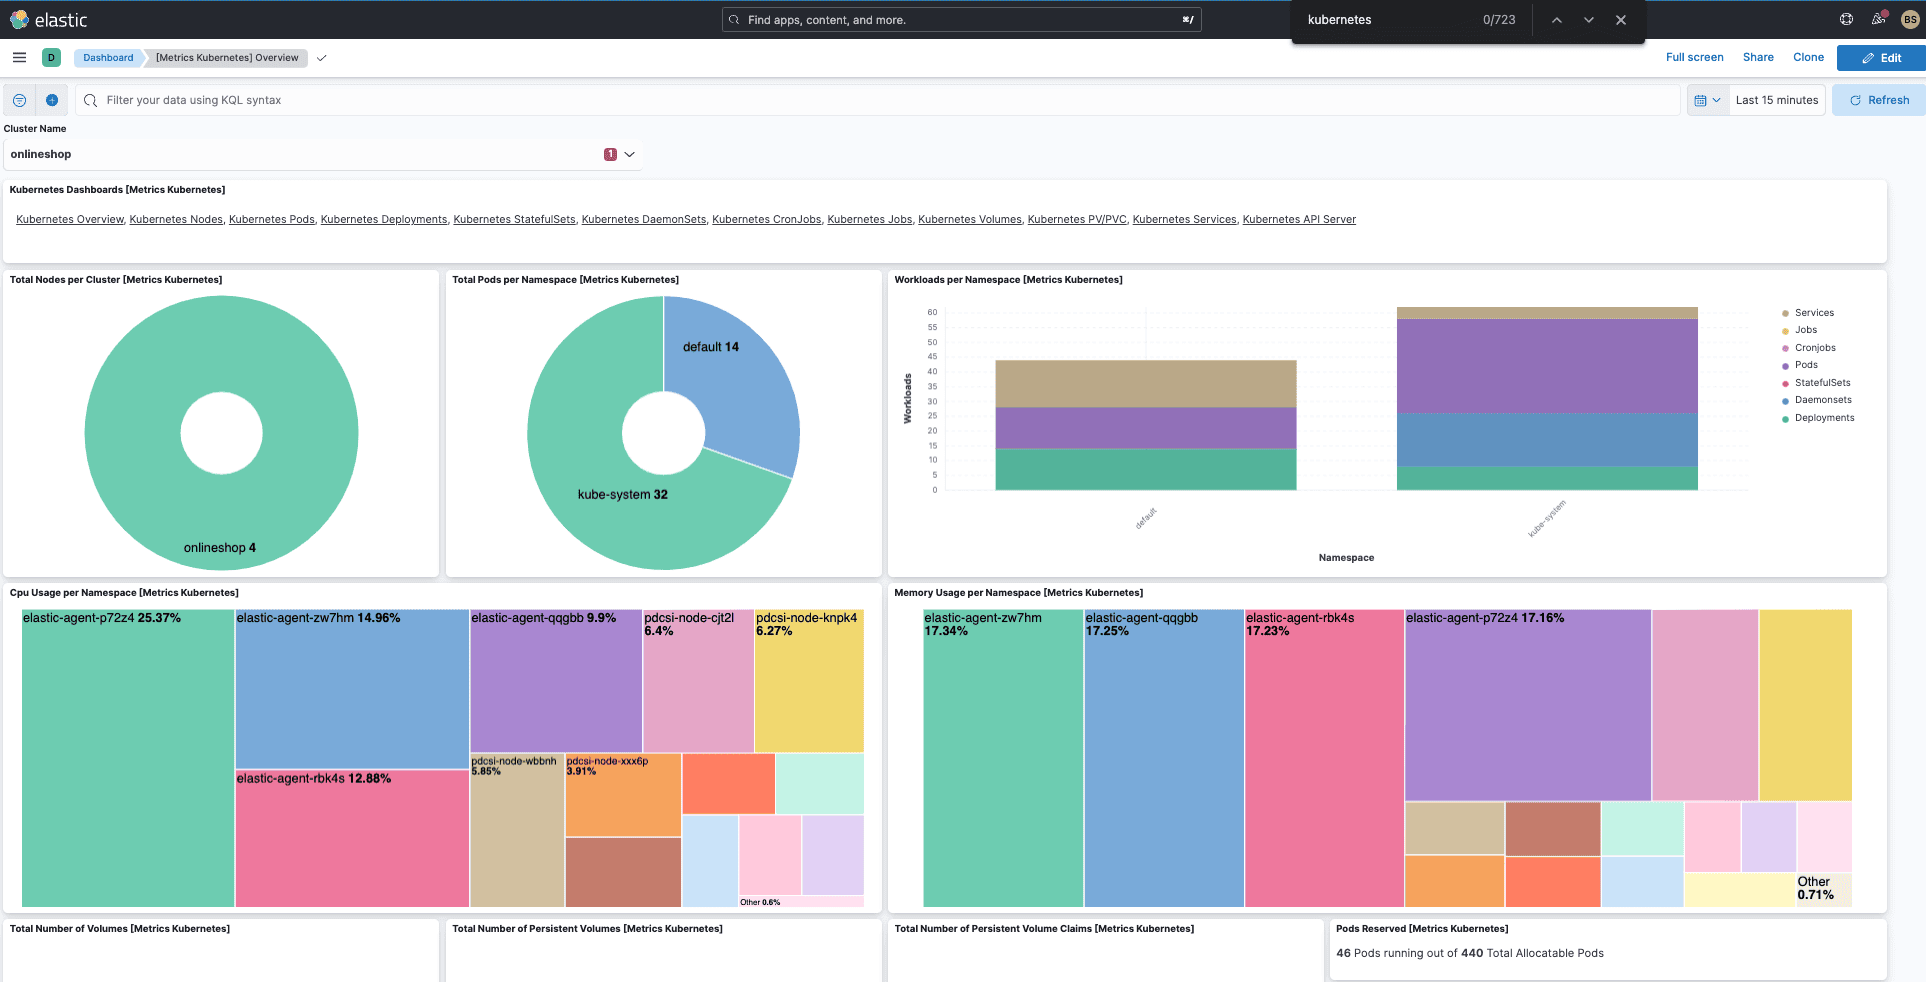
Elastic Observability Pros:
- Unified Stack: Metrics and logs in familiar Elasticsearch environment
- Powerful Search: Elasticsearch query capabilities for metrics and logs
- APM Integration: Application performance monitoring alongside infrastructure
- Elastic Agent: Single agent for metrics, logs, and APM data
- Kibana Dashboards: Rich visualization and dashboard capabilities
- Anomaly Detection: Machine learning-based anomaly detection
Elastic Observability Cons:
- Resource Intensive: Elasticsearch requires significant compute and memory
- Complex Management: Cluster operations can be challenging at scale
- Cost: Both infrastructure costs and licensing can be high
- Steep Learning Curve: Requires Elasticsearch expertise
Integration / Mitigation:
- Deploy Elastic Agent or Metricbeat as DaemonSet
- Use Elastic Cloud for managed deployment
- Implement index lifecycle management for cost control
- Consider OpenObserve for similar capabilities with lower resource requirements
9. Lens
Lens is a Kubernetes IDE that provides powerful cluster management and monitoring capabilities directly from your desktop, with optional Lens Metrics for historical data.
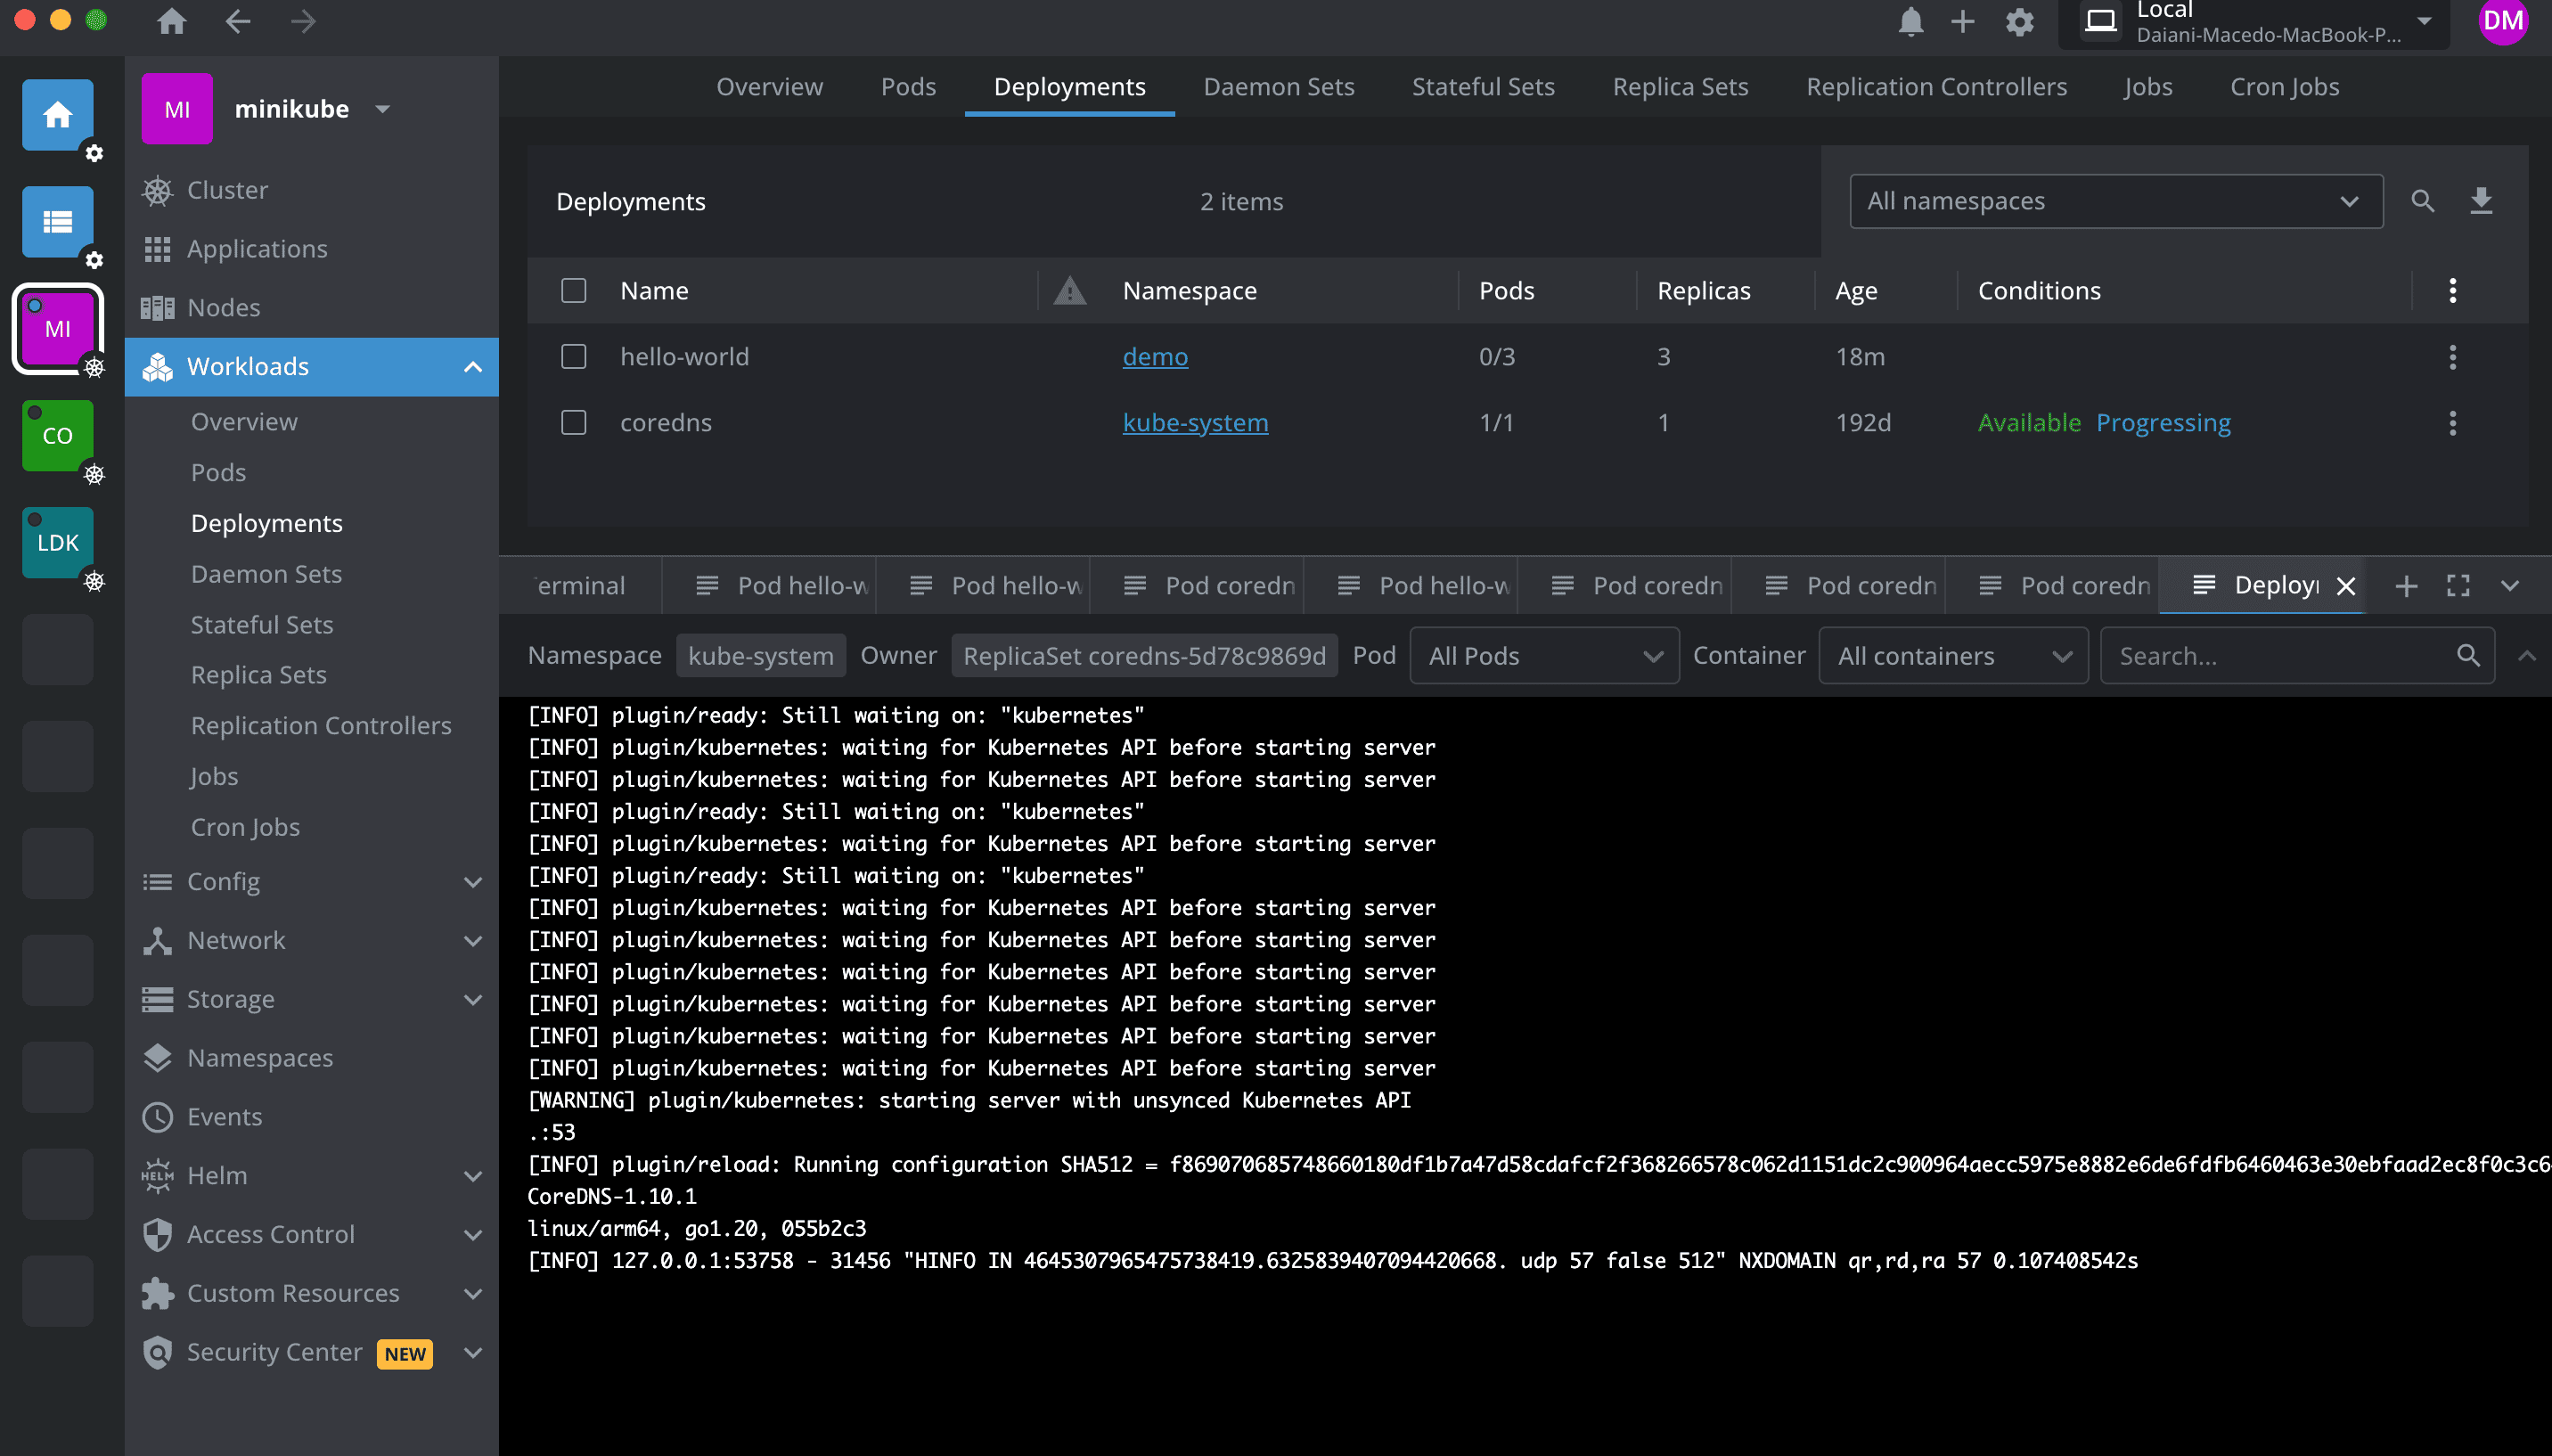
Lens Pros:
- Desktop Application: Native app for Mac, Windows, Linux
- Real-Time Monitoring: Live view of cluster resources and metrics
- Multi-Cluster Management: Manage multiple clusters from one interface
- Resource Visualization: Intuitive views of pods, deployments, services
- Integrated Terminal: Built-in kubectl access and terminal
- Extension System: Customize with community and commercial extensions
- Free Tier: Core features available for free
Lens Cons:
- Desktop-Only: Not suitable for team-wide or centralized monitoring
- Limited Historical Data: Basic metrics without Lens Metrics subscription
- Individual Tool: Not designed for 24/7 monitoring or alerting
- No Log Aggregation: Limited log viewing capabilities
- Commercial Features: Advanced monitoring requires paid Lens Metrics
Integration / Mitigation:
- Best for individual developers and small teams
- Use alongside centralized monitoring for production environments
- Combine with OpenObserve or Prometheus for historical metrics
- Leverage extensions for additional functionality
10. Kubecost
Kubecost specializes in Kubernetes cost monitoring and optimization, providing detailed visibility into cluster spending and resource efficiency.
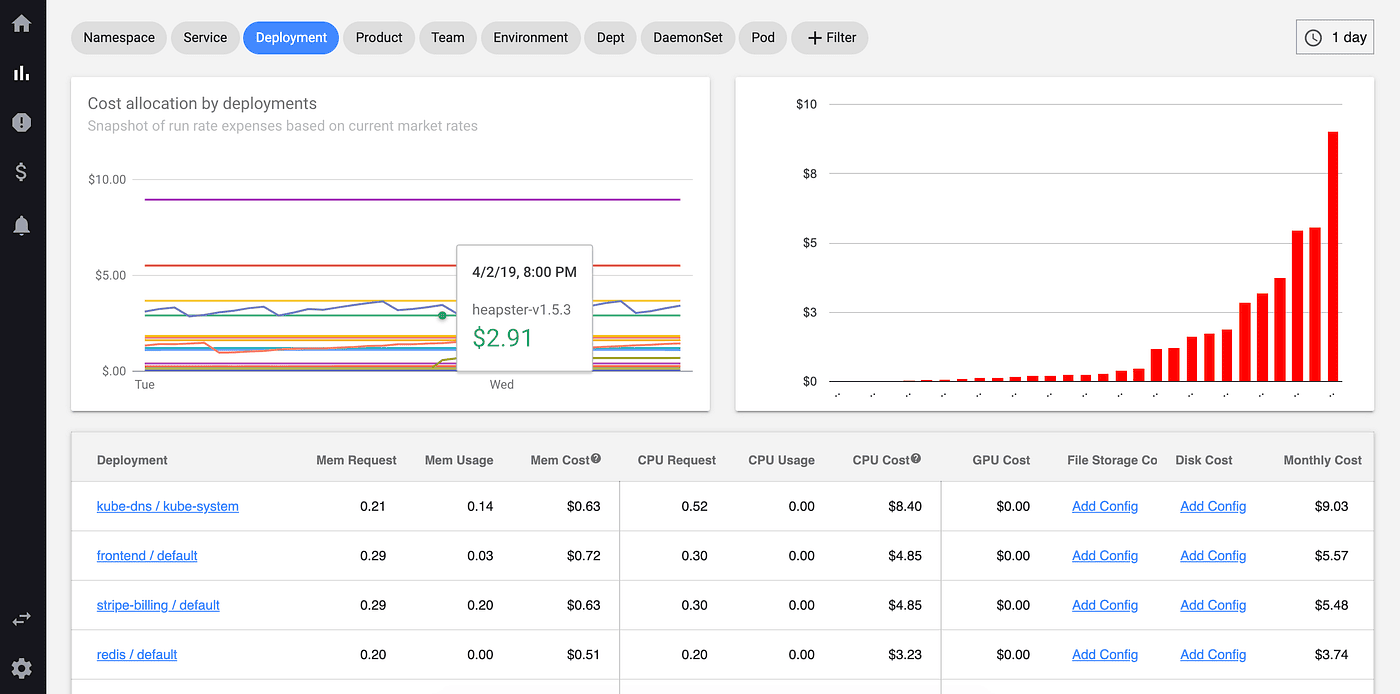
Kubecost Pros:
- Cost Visibility: Real-time and historical cost breakdown by namespace, deployment, service
- Resource Efficiency: Identify over-provisioned pods and optimization opportunities
- Multi-Cloud Support: Works across AWS, GCP, Azure, on-premises
- Cost Allocation: Chargeback and showback capabilities for internal teams
- Savings Recommendations: Automated suggestions for reducing cloud spend
- Prometheus Integration: Built on Prometheus for metrics collection. Kubecost 3.0 introduced Direct Metrics and a ClickHouse backend.
- Open Source Core: Free version available for basic cost monitoring
Kubecost Cons:
- Focused on Costs: Not a comprehensive monitoring solution
- Requires Additional Tools: Need separate tools for performance monitoring
- Pricing Model: Enterprise features can be expensive at scale
- Learning Curve: Understanding cost allocation requires training
Integration / Mitigation:
- Deploy alongside comprehensive monitoring tools like OpenObserve
- Use for FinOps and cost optimization initiatives
- Combine with Prometheus for complete metrics coverage
- Leverage free tier for basic cost visibility
Kubernetes Monitoring Tools Comparison Table (2025)
| Tool
|
Deployment
|
Best For
|
Query Language
|
Multi-Cluster
|
Native K8s Support
|
Cost Profile
|
| OpenObserve
|
Self-hosted / Managed
|
Cost-effective unified observability
|
SQL
|
✅ Yes
|
✅ Excellent
|
Low
|
| Prometheus + Grafana
|
Self-hosted
|
Open source standard monitoring
|
PromQL
|
✅ Yes (with federation)
|
✅ Excellent
|
Low-Medium
|
| Datadog
|
SaaS only
|
Enterprise full-stack monitoring
|
Proprietary
|
✅ Yes
|
✅ Excellent
|
High
|
| New Relic
|
SaaS only
|
APM-integrated monitoring
|
NRQL
|
✅ Yes
|
✅ Excellent
|
Medium-High
|
| Dynatrace
|
SaaS / Managed
|
AI-powered enterprise monitoring
|
Proprietary
|
✅ Yes
|
✅ Excellent
|
Very High
|
| Sysdig
|
SaaS / Self-hosted
|
Security-focused container monitoring
|
Prometheus + proprietary
|
✅ Yes
|
✅ Excellent
|
High
|
| Rancher
|
Self-hosted / Managed
|
Multi-cluster management & monitoring
|
PromQL
|
✅ Yes
|
✅ Excellent
|
Low-Medium
|
| Elastic Observability
|
Self-hosted / Cloud
|
ELK-based monitoring
|
Elasticsearch DSL
|
✅ Yes
|
✅ Good
|
High
|
| Lens
|
Desktop App
|
Individual developer IDE
|
N/A
|
✅ Yes
|
✅ Excellent
|
Low-Medium
|
| Kubecost
|
Self-hosted / SaaS
|
Cost monitoring & optimization
|
Prometheus
|
✅ Yes
|
✅ Excellent
|
Low-Medium
|
Best Practices for Kubernetes Monitoring
To get the most value from your Kubernetes monitoring setup:
- Use proper resource requests and limits: Set appropriate CPU and memory values to enable accurate monitoring and prevent resource contention.
- Implement labeling standards: Consistent labels enable better filtering, grouping, and cost attribution across your monitoring tools.
- Monitor at multiple levels: Track cluster health, node performance, pod resource usage, and application metrics for complete visibility.
- Set up meaningful alerts: Create alerts for pod restarts, node pressure, failed deployments, and resource exhaustion that require action.
- Track Golden Signals: Monitor latency, traffic, errors, and saturation for services running in Kubernetes.
- Use namespace isolation: Organize workloads into namespaces for better monitoring, security, and resource management.
- Monitor control plane: Track etcd, API server, scheduler, and controller manager health in production clusters.
- Implement distributed tracing: Use OpenTelemetry or similar to trace requests across microservices in your cluster.
- Review regularly: Regularly audit monitoring coverage and alert effectiveness to prevent gaps.
- Plan for growth: Choose tools that scale with your cluster size and don't require frequent re-architecture.
Conclusion
Kubernetes monitoring is essential for maintaining reliable, efficient, and cost-effective container orchestration at scale. The right tool depends on your cluster size, team expertise, budget, observability requirements, and whether you prefer open source or commercial solutions.
For most modern teams, OpenObserve stands out as a unified observability platform that combines Kubernetes metrics, logs, and traces with SQL-based querying, exceptional storage efficiency, and powerful visualization all at a fraction of the cost of commercial alternatives.
Key Recommendations:
- Start with OpenObserve if you want complete, cost-effective observability with native Kubernetes support
- Add Kubecost for detailed cost monitoring and optimization alongside your primary monitoring tool
- Deploy monitoring early in your Kubernetes journey, before complexity makes it harder to implement
Take the Next Step