Top 10 Lightstep Alternatives in 2026: Complete Comparison Guide

Manas Sharma
February 03, 2026
20 min read
Don’t forget to share!
Try OpenObserve Cloud today for more efficient and performant observability.
Get Started For Free
ServiceNow announced the sunset of Lightstep (Cloud Observability) effective March 1, 2026. If you're a Lightstep user, you're facing a forced migration with no direct replacement offered by ServiceNow.
Several factors are driving teams to evaluate Lightstep alternatives:
In this guide, we'll explore ten OpenTelemetry-native alternatives to Lightstep that address these concerns, from open source platforms to specialized SaaS solutions. We'll include real cost comparisons, migration code snippets, and technical analysis to help you choose the right replacement and migrate before the March 2026 deadline.
The clock is ticking. ServiceNow has officially announced the sunset of Lightstep (rebranded as ServiceNow Cloud Observability), with the service reaching End-of-Life (EOL) by March 1, 2026.
For engineering teams that relied on Lightstep for its pioneering work in distributed tracing and OpenTelemetry (OTel), this is a critical turning point. You need a replacement that respects your existing OTel instrumentation, handles high-cardinality data without breaking the bank, and doesn't trap you in a proprietary agent ecosystem.
This guide analyzes the Top 10 Lightstep alternatives for 2026, focusing on:
Bottom line: OpenObserve emerges as the best drop-in replacement, offering significant cost savings while maintaining OpenTelemetry-native architecture and distributed tracing capabilities.
As observability requirements evolve in 2026, Lightstep users face a forced migration due to ServiceNow's March 1, 2026 end-of-life announcement. With no direct replacement or migration path provided by ServiceNow, teams must evaluate alternatives quickly.
Evidence from Real Migrations:
Cost reduction: - Production data shows dramatic savings when moving from Lightstep to modern OpenTelemetry-native alternatives.
Migration timeline: Fast with OTel - Teams using OpenTelemetry can migrate quickly by changing collector configuration. This is significantly faster than platforms that need new instrumentation.
OpenTelemetry-native prevents lock-in - Vendor-neutral instrumentation using OpenTelemetry standards enables future flexibility. You're not rewriting code or learning proprietary agents if you need to switch platforms again.
Unified observability simplifies operations - Logs, metrics, and traces in one platform reduces tool sprawl, context switching, and correlation complexity that teams experienced with fragmented monitoring stacks.
Lightstep was known for several key capabilities that any replacement must match:
Your replacement platform needs to match these capabilities while avoiding the vendor lock-in risk that led to this forced migration.
When evaluating observability platforms to replace Lightstep, assess these critical dimensions:
| Criterion | Why It Matters | What to Evaluate |
|---|---|---|
| OpenTelemetry Native | Ensures easy migration without code changes | Native OTLP support vs translation layers that add complexity |
| Migration Timeline | March 2026 deadline approaching fast | Can you complete migration quickly with your team size? |
| Cost Structure | Opportunity to reduce observability spend | Transparent pricing vs usage-based surprises and hidden fees |
| Distributed Tracing | Core Lightstep capability you can't lose | High-cardinality support, trace quality, sampling strategies |
| Data Ownership | Avoid future vendor lock-in scenarios | Self-hosted deployment option available or SaaS-only? |
| Unified Observability | Reduce tool sprawl and context switching | Logs, metrics, traces in one platform with correlation |
| Query Capabilities | Investigation efficiency during incidents | SQL/PromQL vs proprietary query languages requiring training |
| Service Maps | Dependency visualization and troubleshooting | Automatic topology mapping from trace data |
| Integration Ecosystem | Works with your existing infrastructure | Cloud providers, databases, Kubernetes, CI/CD tools |
| Vendor Stability | Avoid another sudden platform sunset | Long-term viability, funding, community support, roadmap |
| Scalability | Handle growing data volumes | Performance at 2x, 5x, 10x current data volumes |
| High-Cardinality Support | Modern app requirements (user IDs, request IDs) | Cost and performance impact of high-cardinality dimensions |
Jump to comparison table for Lightstep alternatives comparison.
OpenObserve is the best Lightstep alternative for teams wanting unified observability with OpenTelemetry-native architecture, no vendor lock-in, and 90% cost savings. It delivers the same distributed tracing capabilities Lightstep users rely on, but with transparent pricing and self-hosting options.
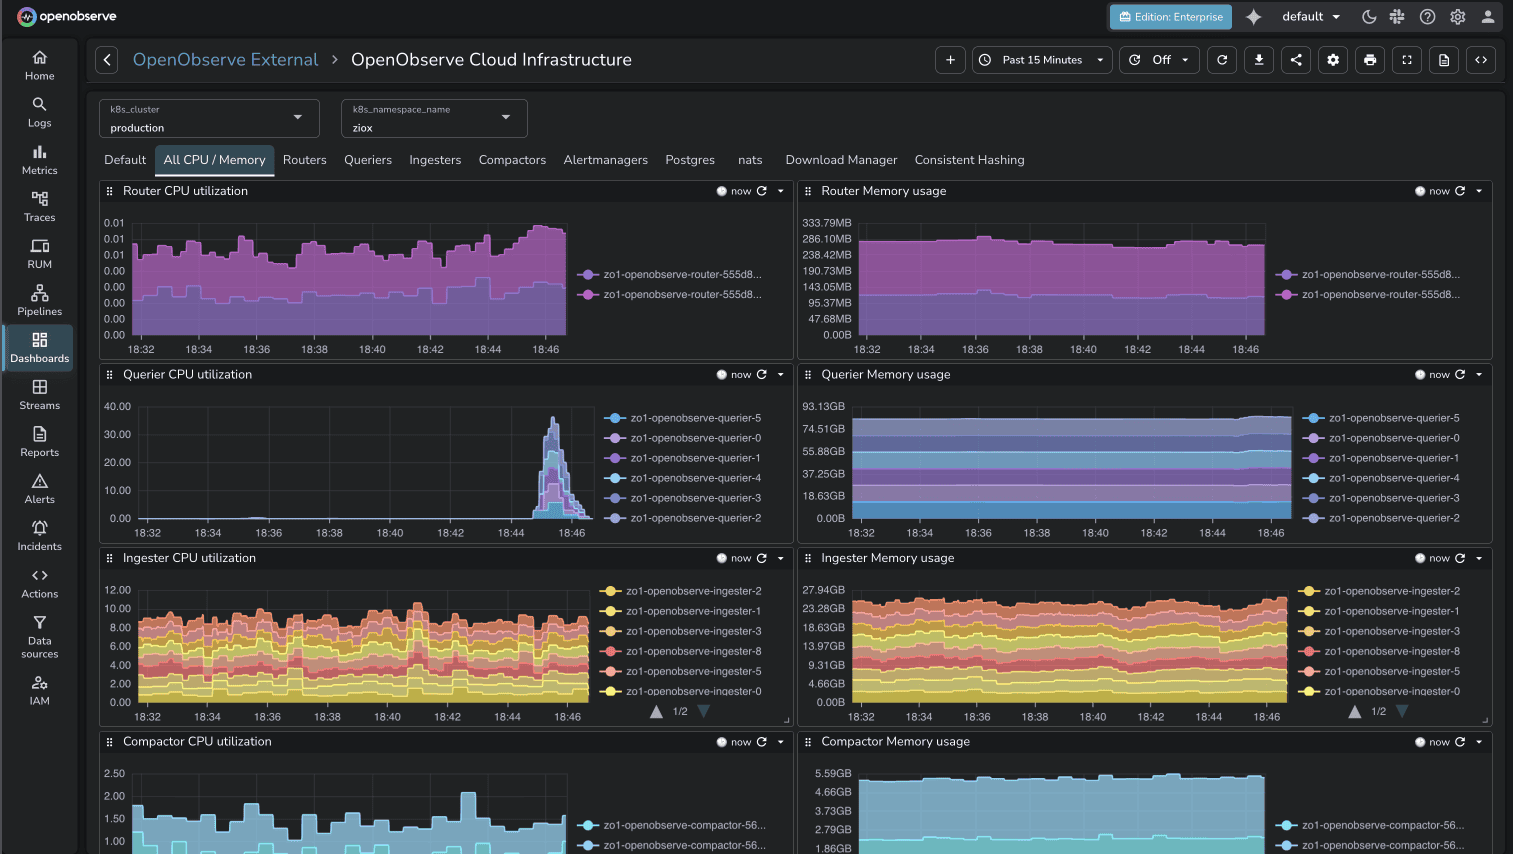
Why OpenObserve is the best Lightstep alternative:
OpenObserve isn't just similar to Lightstep - it's architecturally compatible. Both platforms are:
The difference? OpenObserve gives you complete data ownership through self-hosting options.
Easiest migration path of any alternative. If you're using OpenTelemetry (which Lightstep users are):
Teams seeking a Lightstep replacement that maintains OpenTelemetry-native architecture, matches distributed tracing capabilities, and dramatically reduces costs without sacrificing functionality. Ideal for organizations wanting data ownership through self-hosting while avoiding vendor lock-in.
Grafana Stack (Loki for logs, Grafana for visualization, Tempo for traces, Mimir/Prometheus for metrics) is a popular open-source Lightstep alternative composed of best-in-class tools.
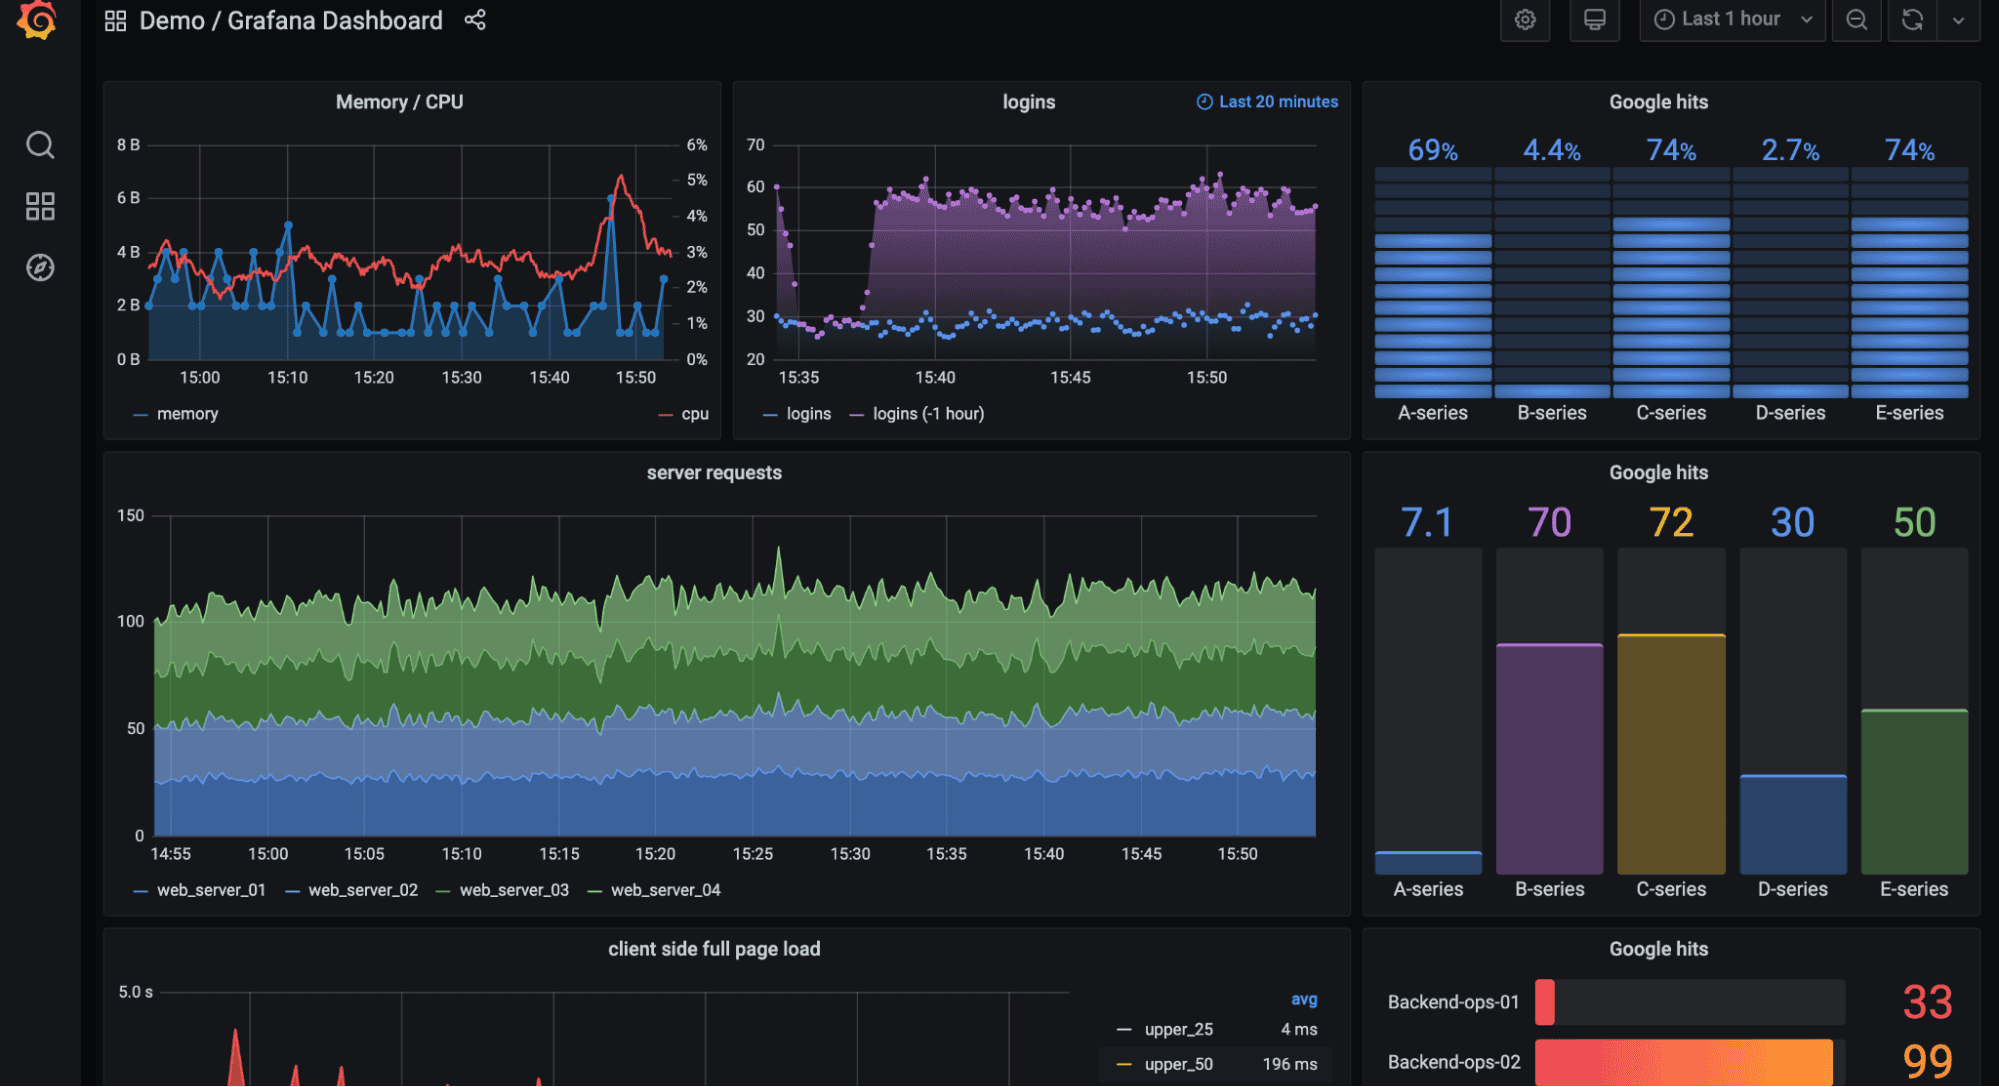
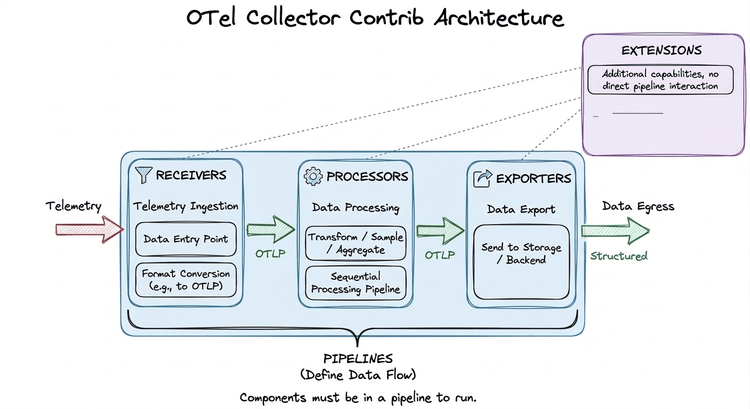
Configure OpenTelemetry Collector to export traces to Tempo, metrics to Prometheus/Mimir, and logs to Loki. More complex than single-platform alternatives due to multiple destinations.
Teams wanting maximum flexibility and best-in-class visualization who are comfortable managing multiple components. Good for organizations with strong infrastructure teams or using Grafana Cloud to reduce operational burden.
Honeycomb is a modern Lightstep alternative focused on high-cardinality observability and debugging distributed systems.
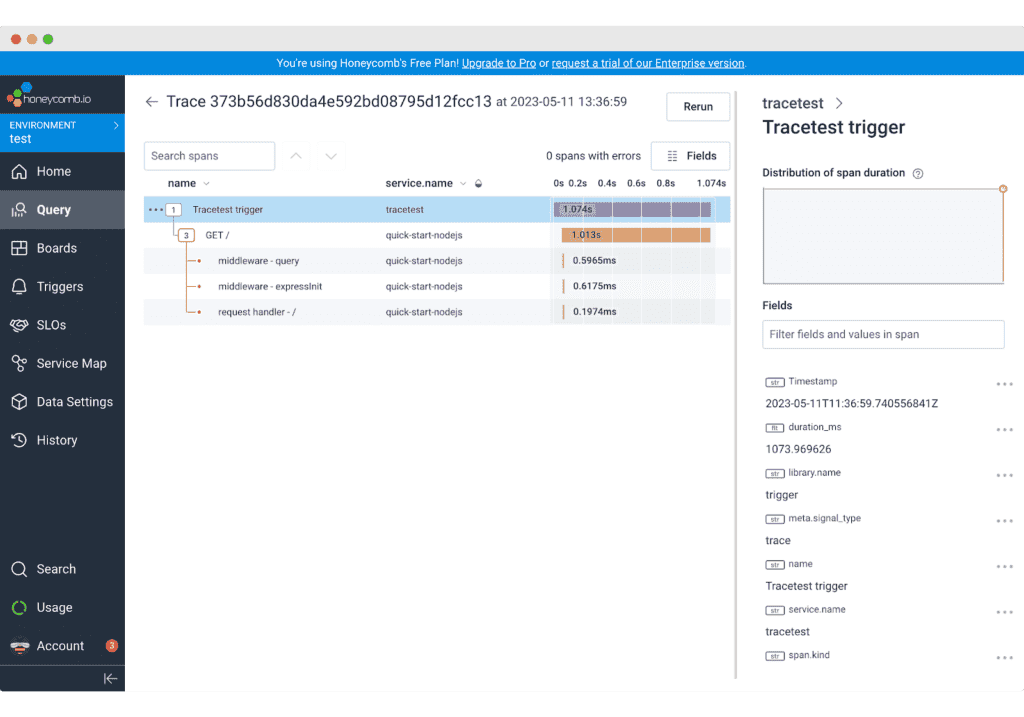
Straightforward for OpenTelemetry users. Update collector configuration to send traces to Honeycomb. Strong documentation for Lightstep migration scenarios.
Teams prioritizing distributed tracing excellence and high-cardinality debugging capabilities over traditional dashboard-heavy monitoring. Ideal for microservices architectures where understanding request flows is critical.
Datadog is a comprehensive Lightstep alternative offering all-in-one observability with extensive integrations and enterprise features.
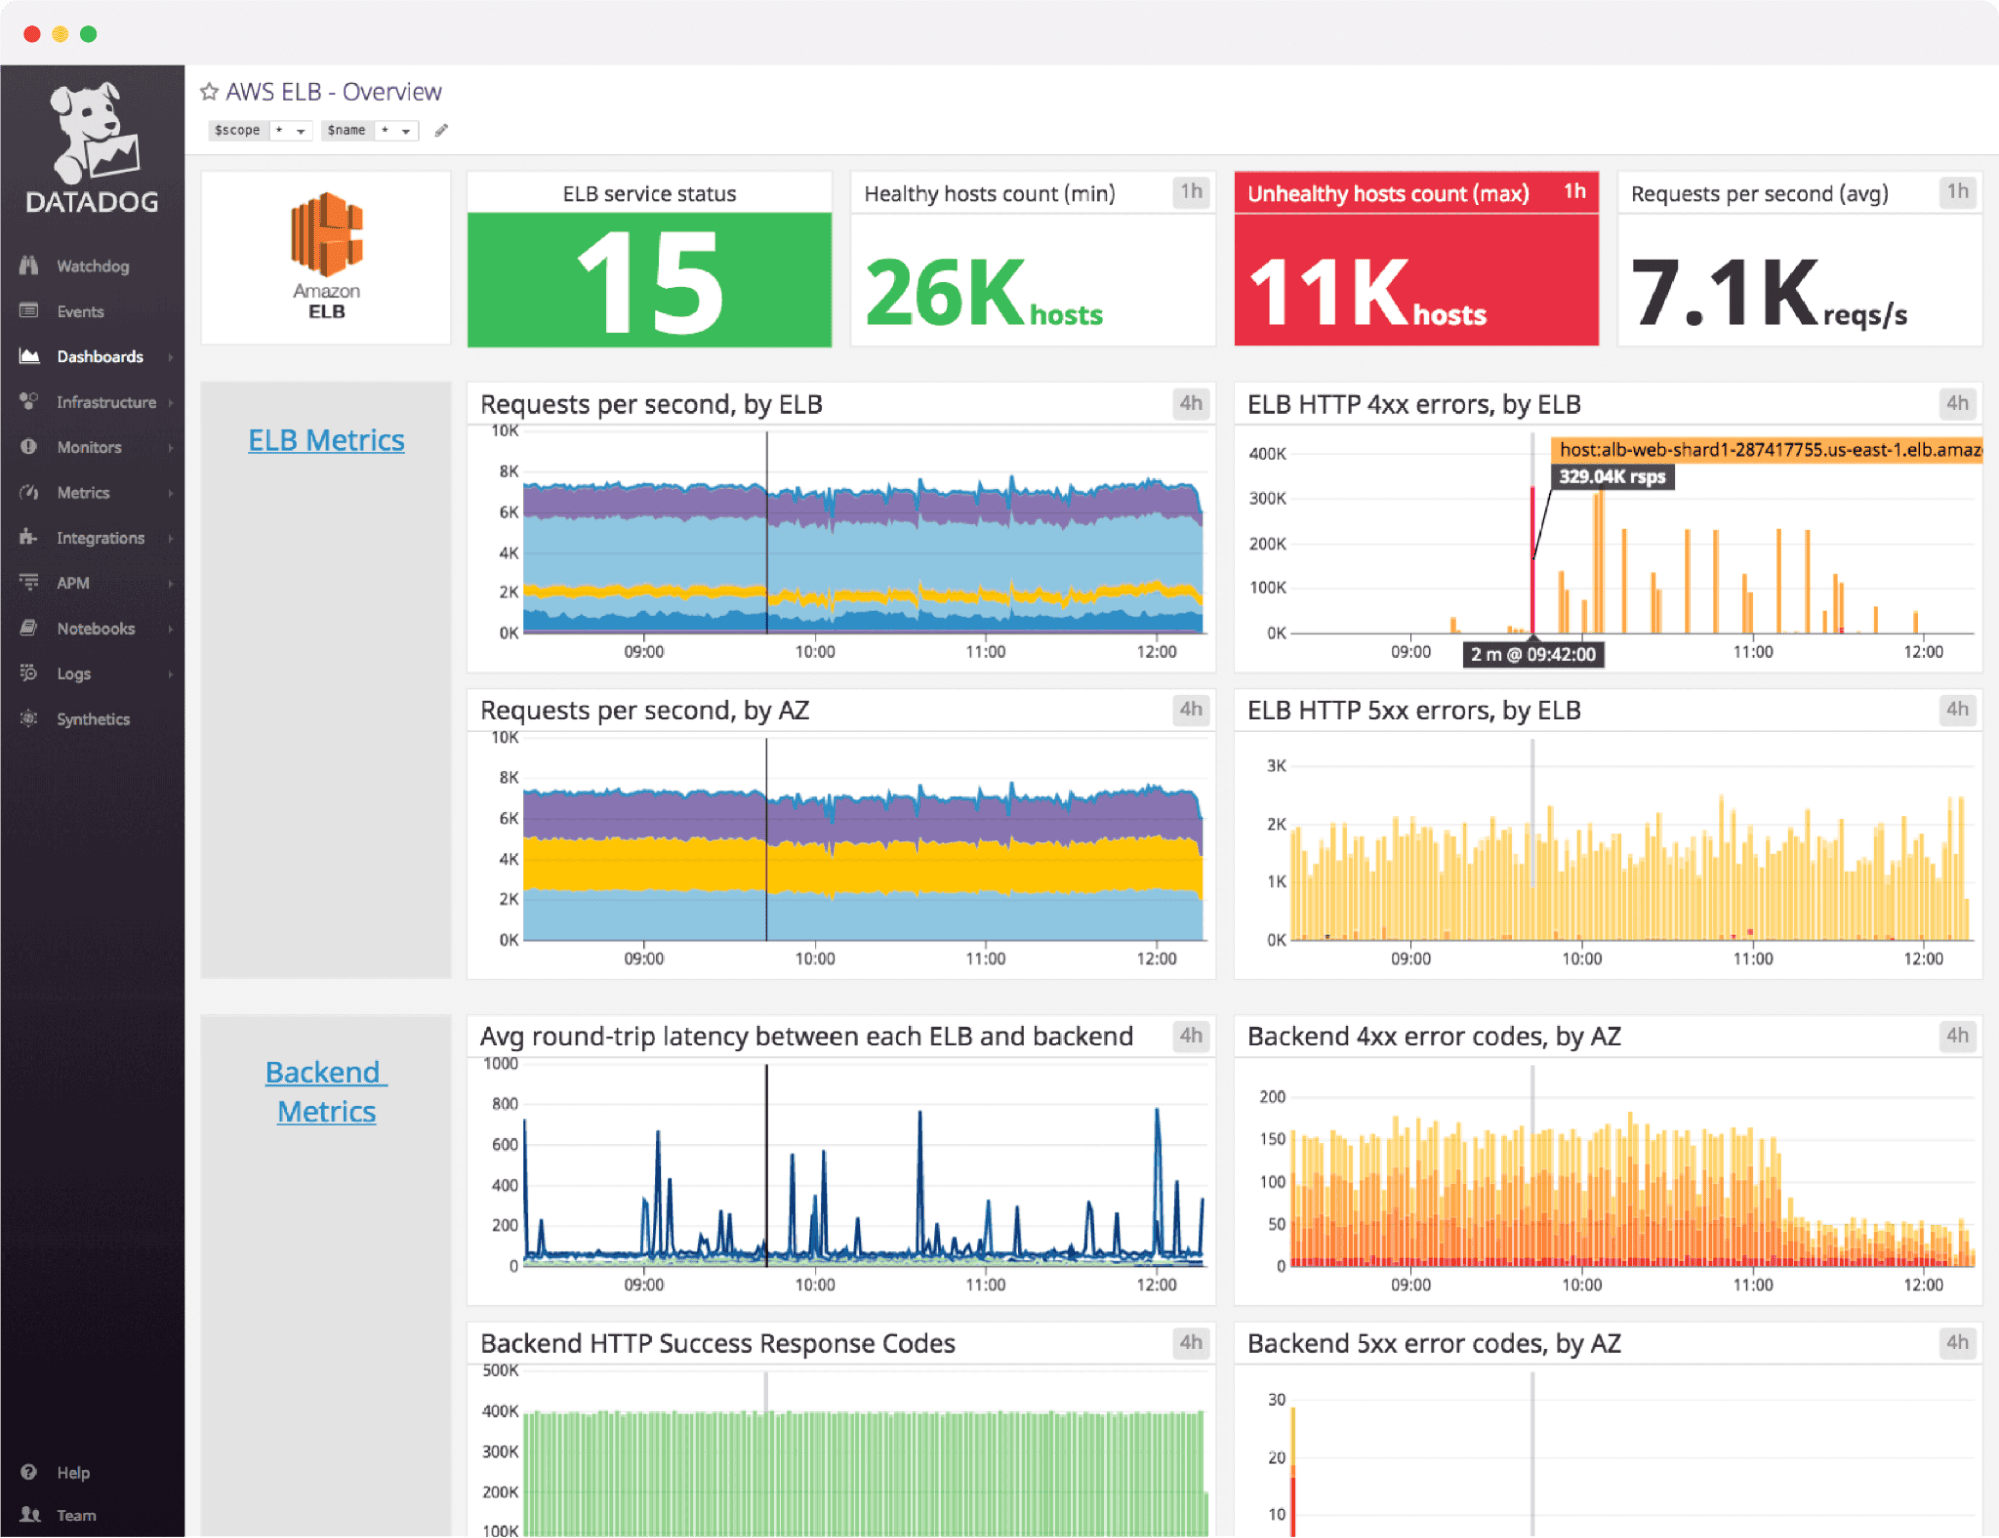
Requires Datadog agents or OpenTelemetry Collector configured for Datadog. More complex than OTel-native alternatives due to Datadog's proprietary ingestion formats.
Enterprise teams with large budgets prioritizing ecosystem breadth and polished UX over cost optimization. Good if observability budget isn't constrained and you value comprehensive built-in features.
New Relic is a SaaS observability platform offering unified logs, metrics, traces, and APM with OpenTelemetry support.
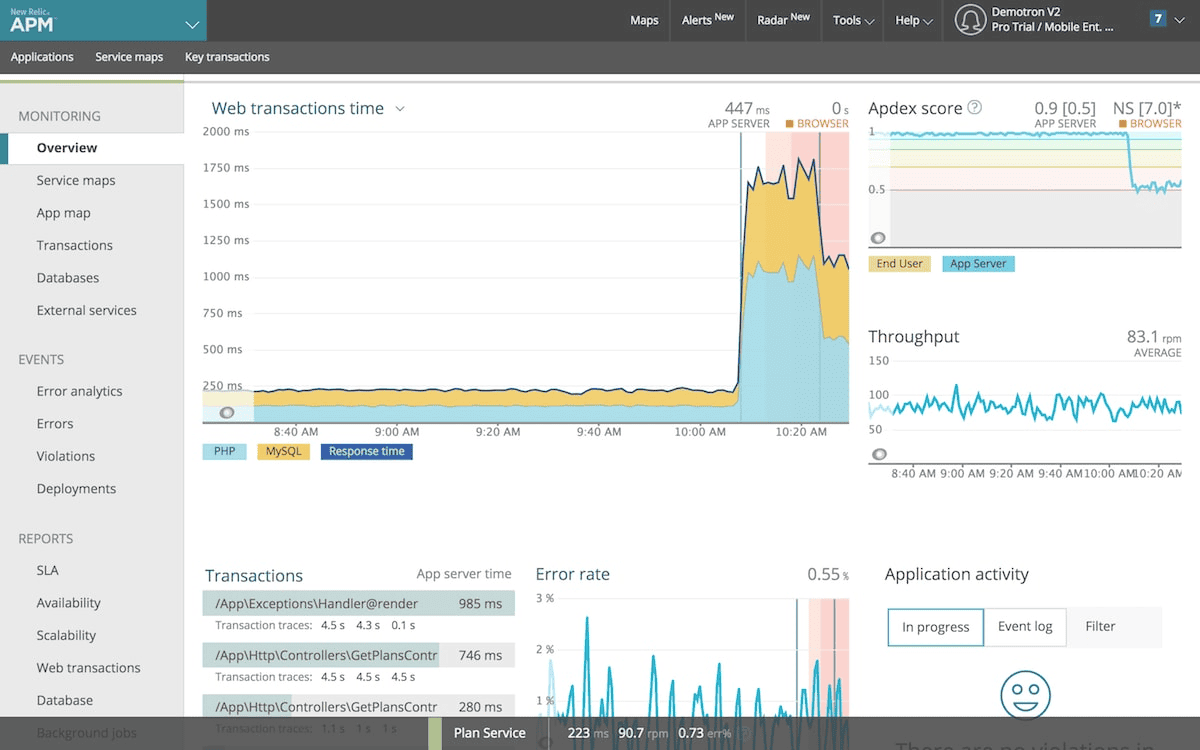
OpenTelemetry Collector can send data directly to New Relic via OTLP. Simpler than Datadog but creates some vendor lock-in through data format translation.
Teams wanting a familiar SaaS experience similar to Lightstep with strong APM capabilities and willing to accept usage-based pricing for operational simplicity.
Chronosphere is a cloud-native observability platform built by ex-Uber engineers, focused on controlling costs at scale while supporting OpenTelemetry.
OpenTelemetry Collector can export metrics to Chronosphere. Straightforward for metrics migration, but you'll need additional solutions for comprehensive tracing that Lightstep provided.
Large-scale environments generating massive metric volumes where cost control and governance are critical. Good for teams migrating from Lightstep who want enterprise support but need better cost predictability.
Jaeger is an open-source distributed tracing platform and graduated CNCF project, offering core tracing capabilities without logs or metrics.
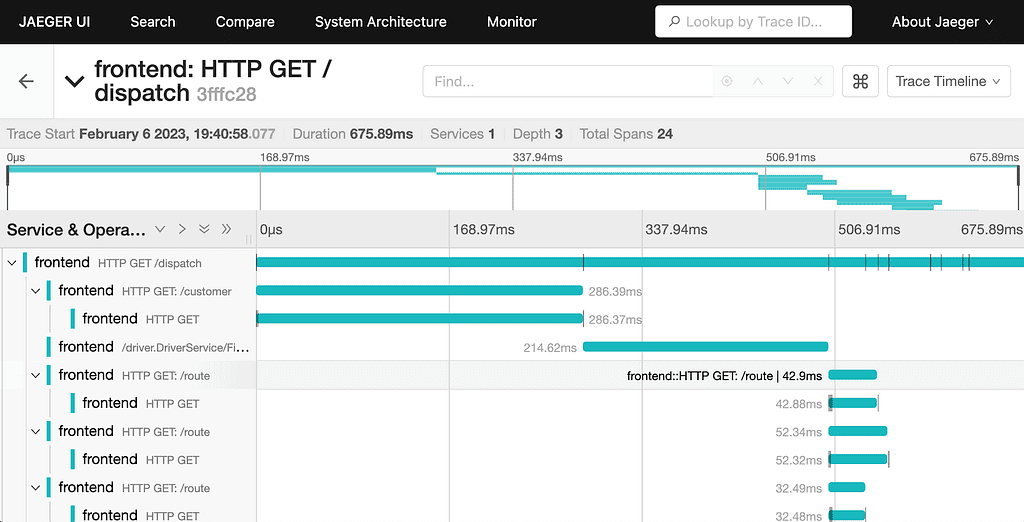
Simple for OpenTelemetry users. Point collector traces to Jaeger endpoint. However, you'll need additional tools for logs and metrics that Lightstep provided.
Teams needing just distributed tracing at zero cost and comfortable with self-hosting. Often paired with Prometheus (metrics) and Grafana Loki (logs) for complete observability.
Elastic Observability (part of Elastic Stack/ELK) provides unified logs, metrics, APM, and traces with powerful search capabilities.
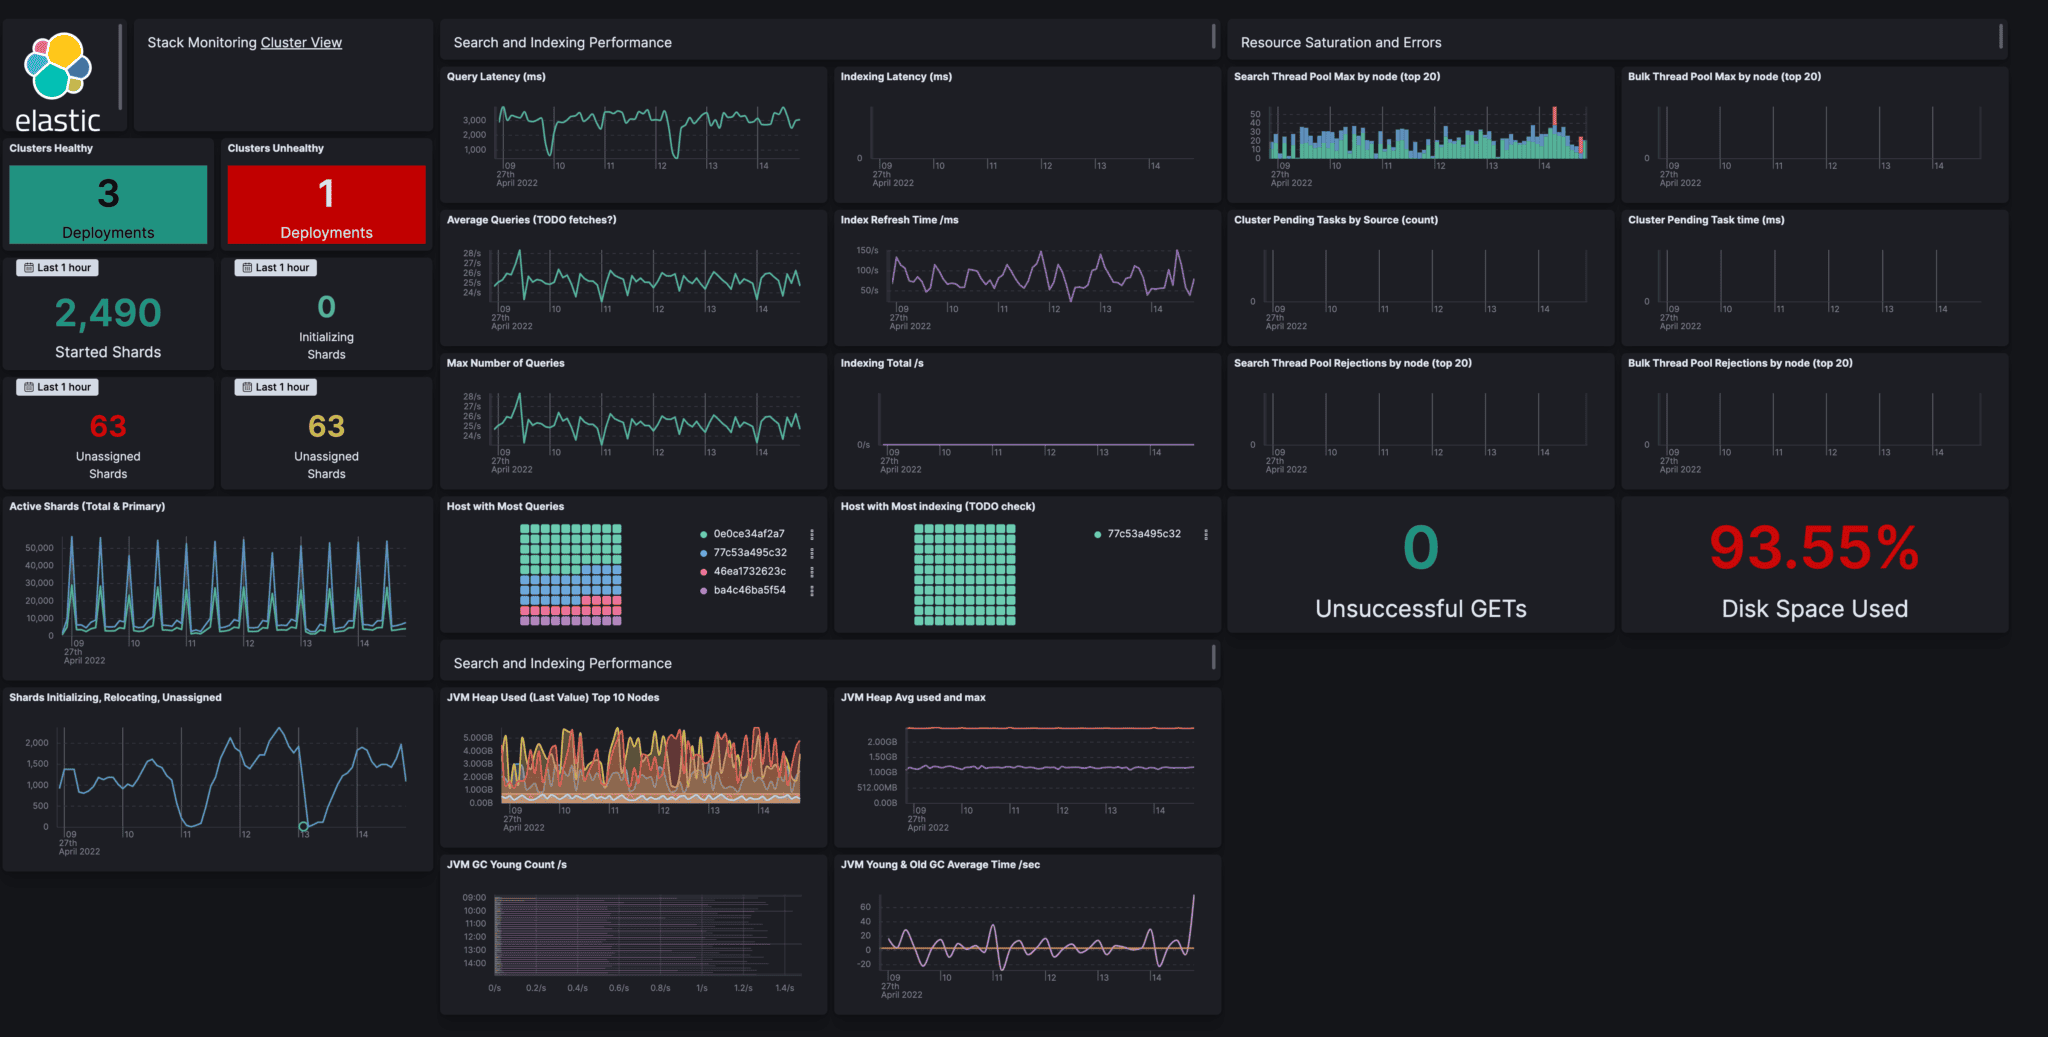
OpenTelemetry Collector can export to Elastic APM. Requires more operational setup than simpler alternatives due to Elasticsearch cluster management.
Teams with heavy log analytics requirements or existing Elasticsearch investments who want to consolidate observability into their ELK stack.
Dynatrace is an enterprise APM and observability platform with AI-powered automation and root cause analysis.
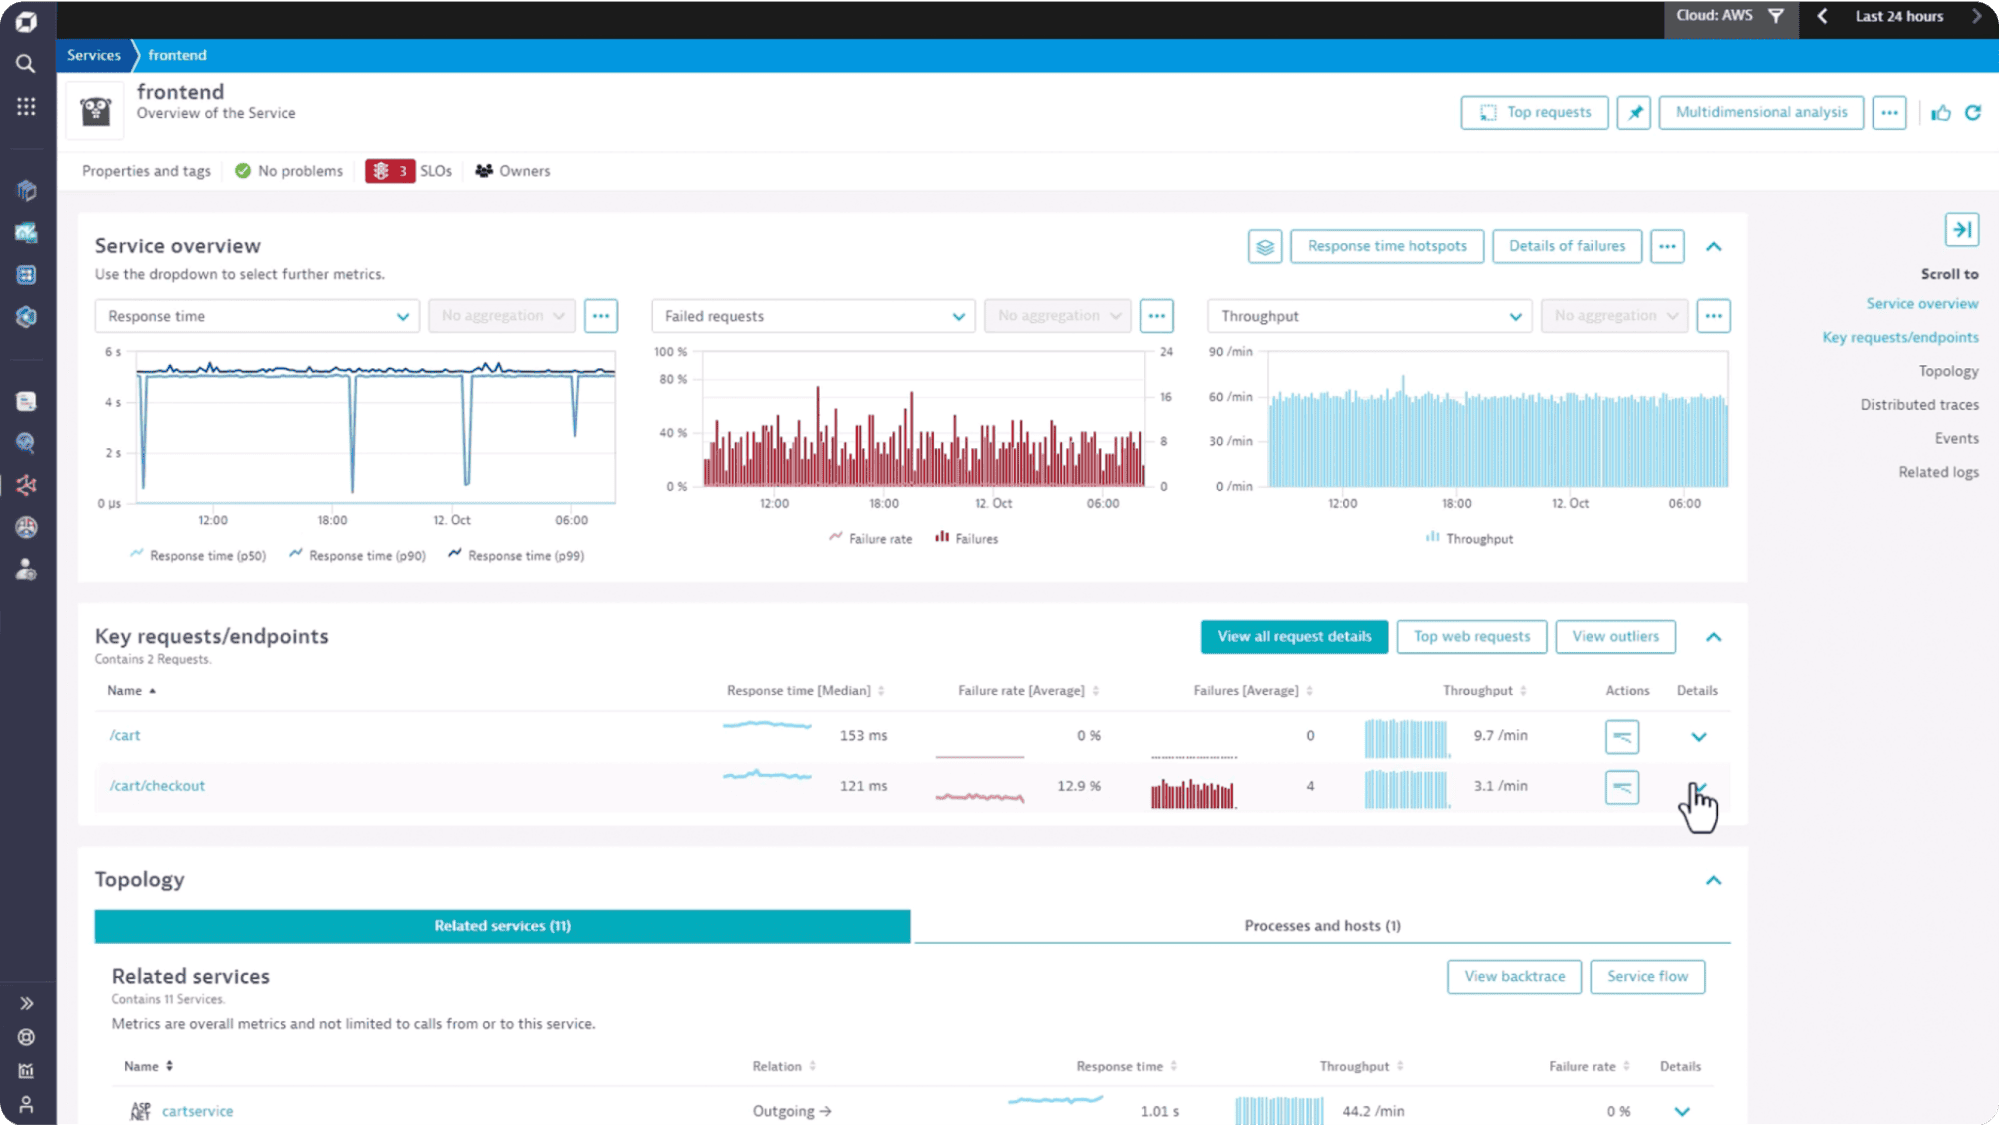
Requires deploying OneAgent (Dynatrace's proprietary agent) rather than continuing with OpenTelemetry Collector. More disruptive migration than OTel-native alternatives.
Large enterprises with complex environments prioritizing automation and willing to pay premium prices for reduced operational overhead.
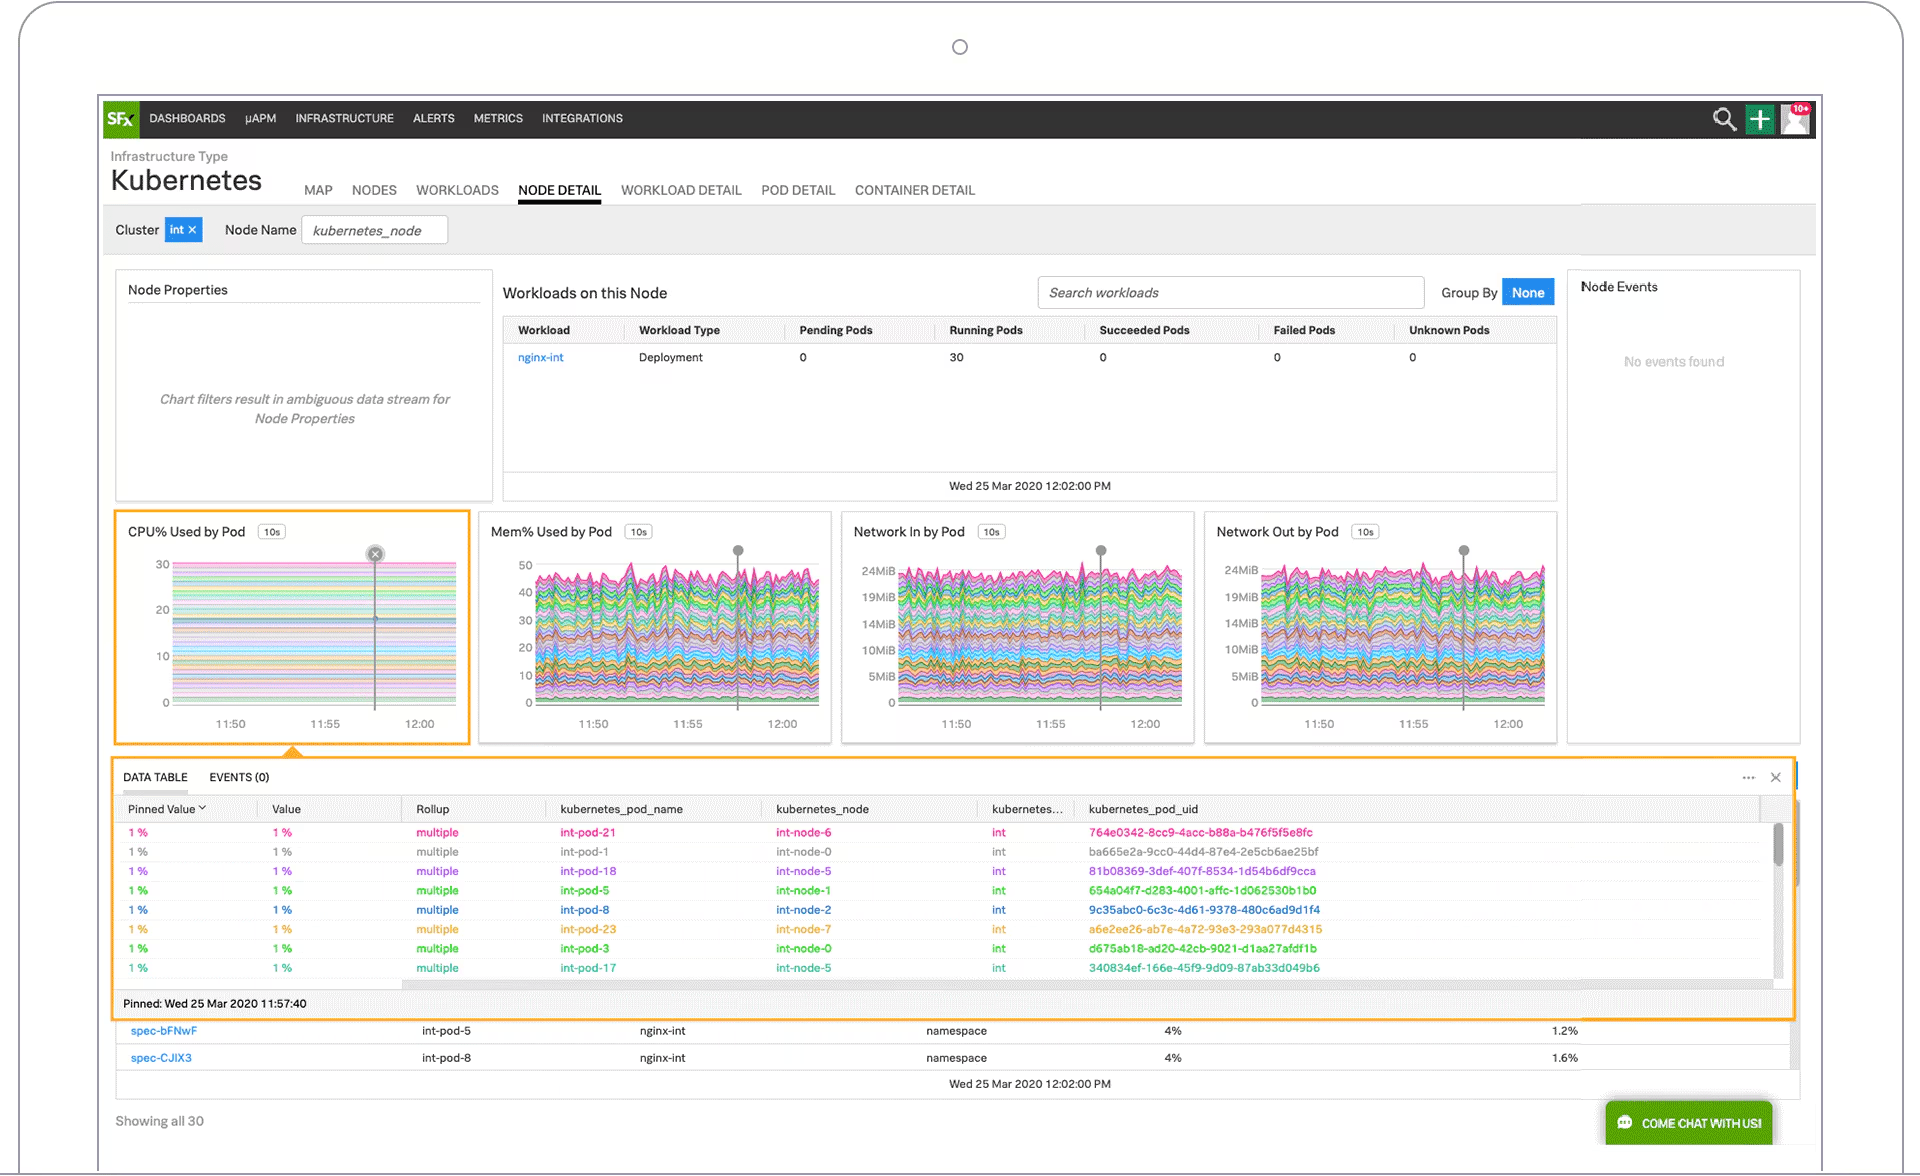
Splunk Observability Cloud (formerly SignalFx) offers real-time metrics, APM, and infrastructure monitoring focused on cloud-native environments.
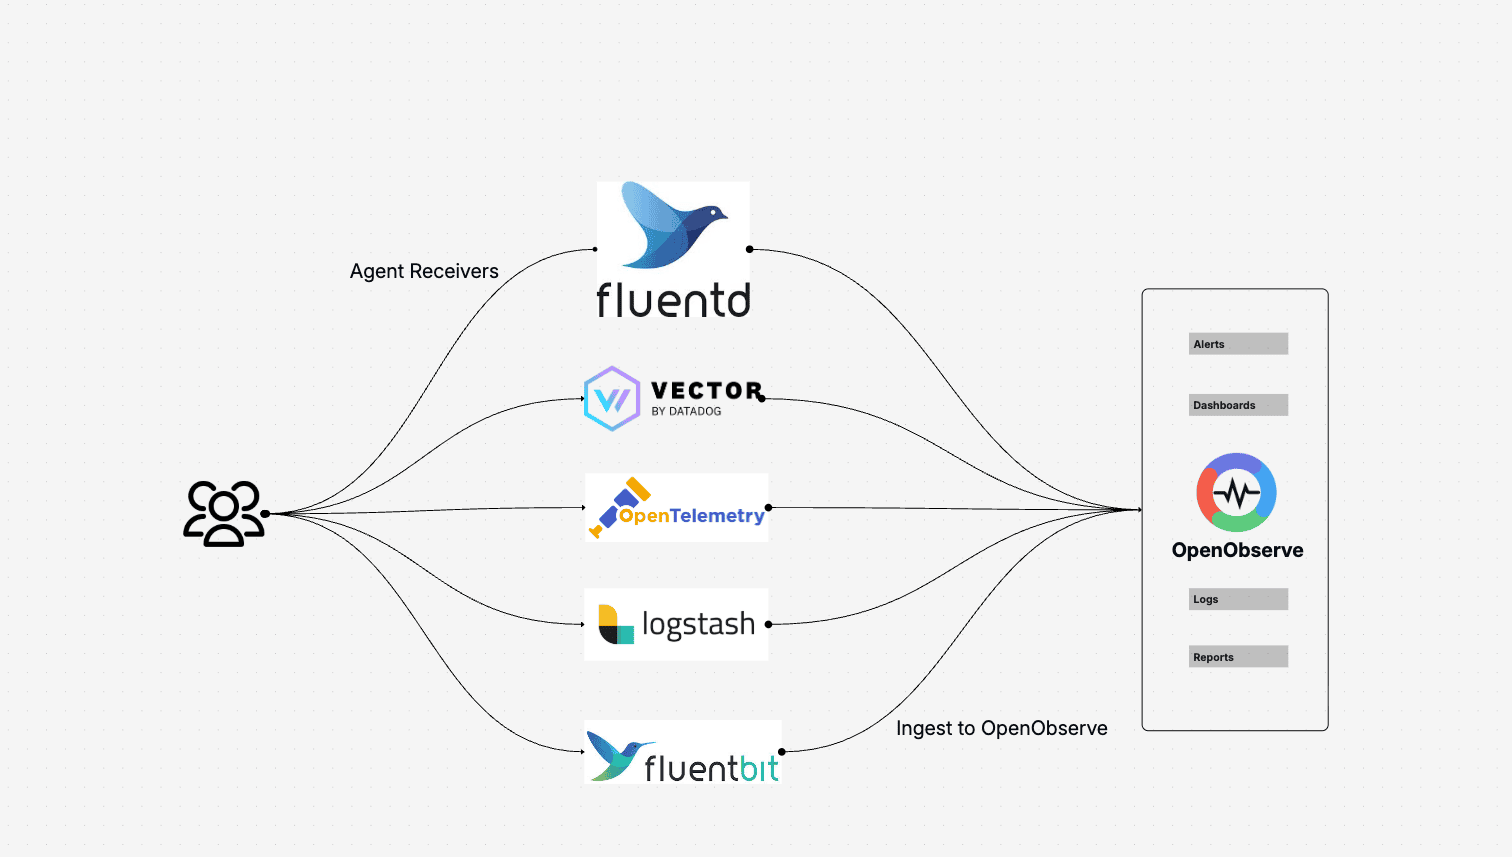
OpenObserve has first-class support for OpenTelemetry, which means no vendor lock-in and seamless integration with your existing instrumentation. Your applications don't change. Your OpenTelemetry instrumentation doesn't change. Only the collector destination changes.
O2 supports standardized telemetry collection (i.e., FluentBit, OpenTelemetry, Logstash) ensuring seamless integration. It exposes APIs for ingestion, search, and more, allowing programmatic access to everything. OpenObserve works with any object storage such as S3 or GCS and stores data in open formats, avoiding vendor lock-in on collection and storage.
1. Point your OTel collectors to OpenObserve
Already using OpenTelemetry? Just update your exporter endpoint. No re-instrumentation required.
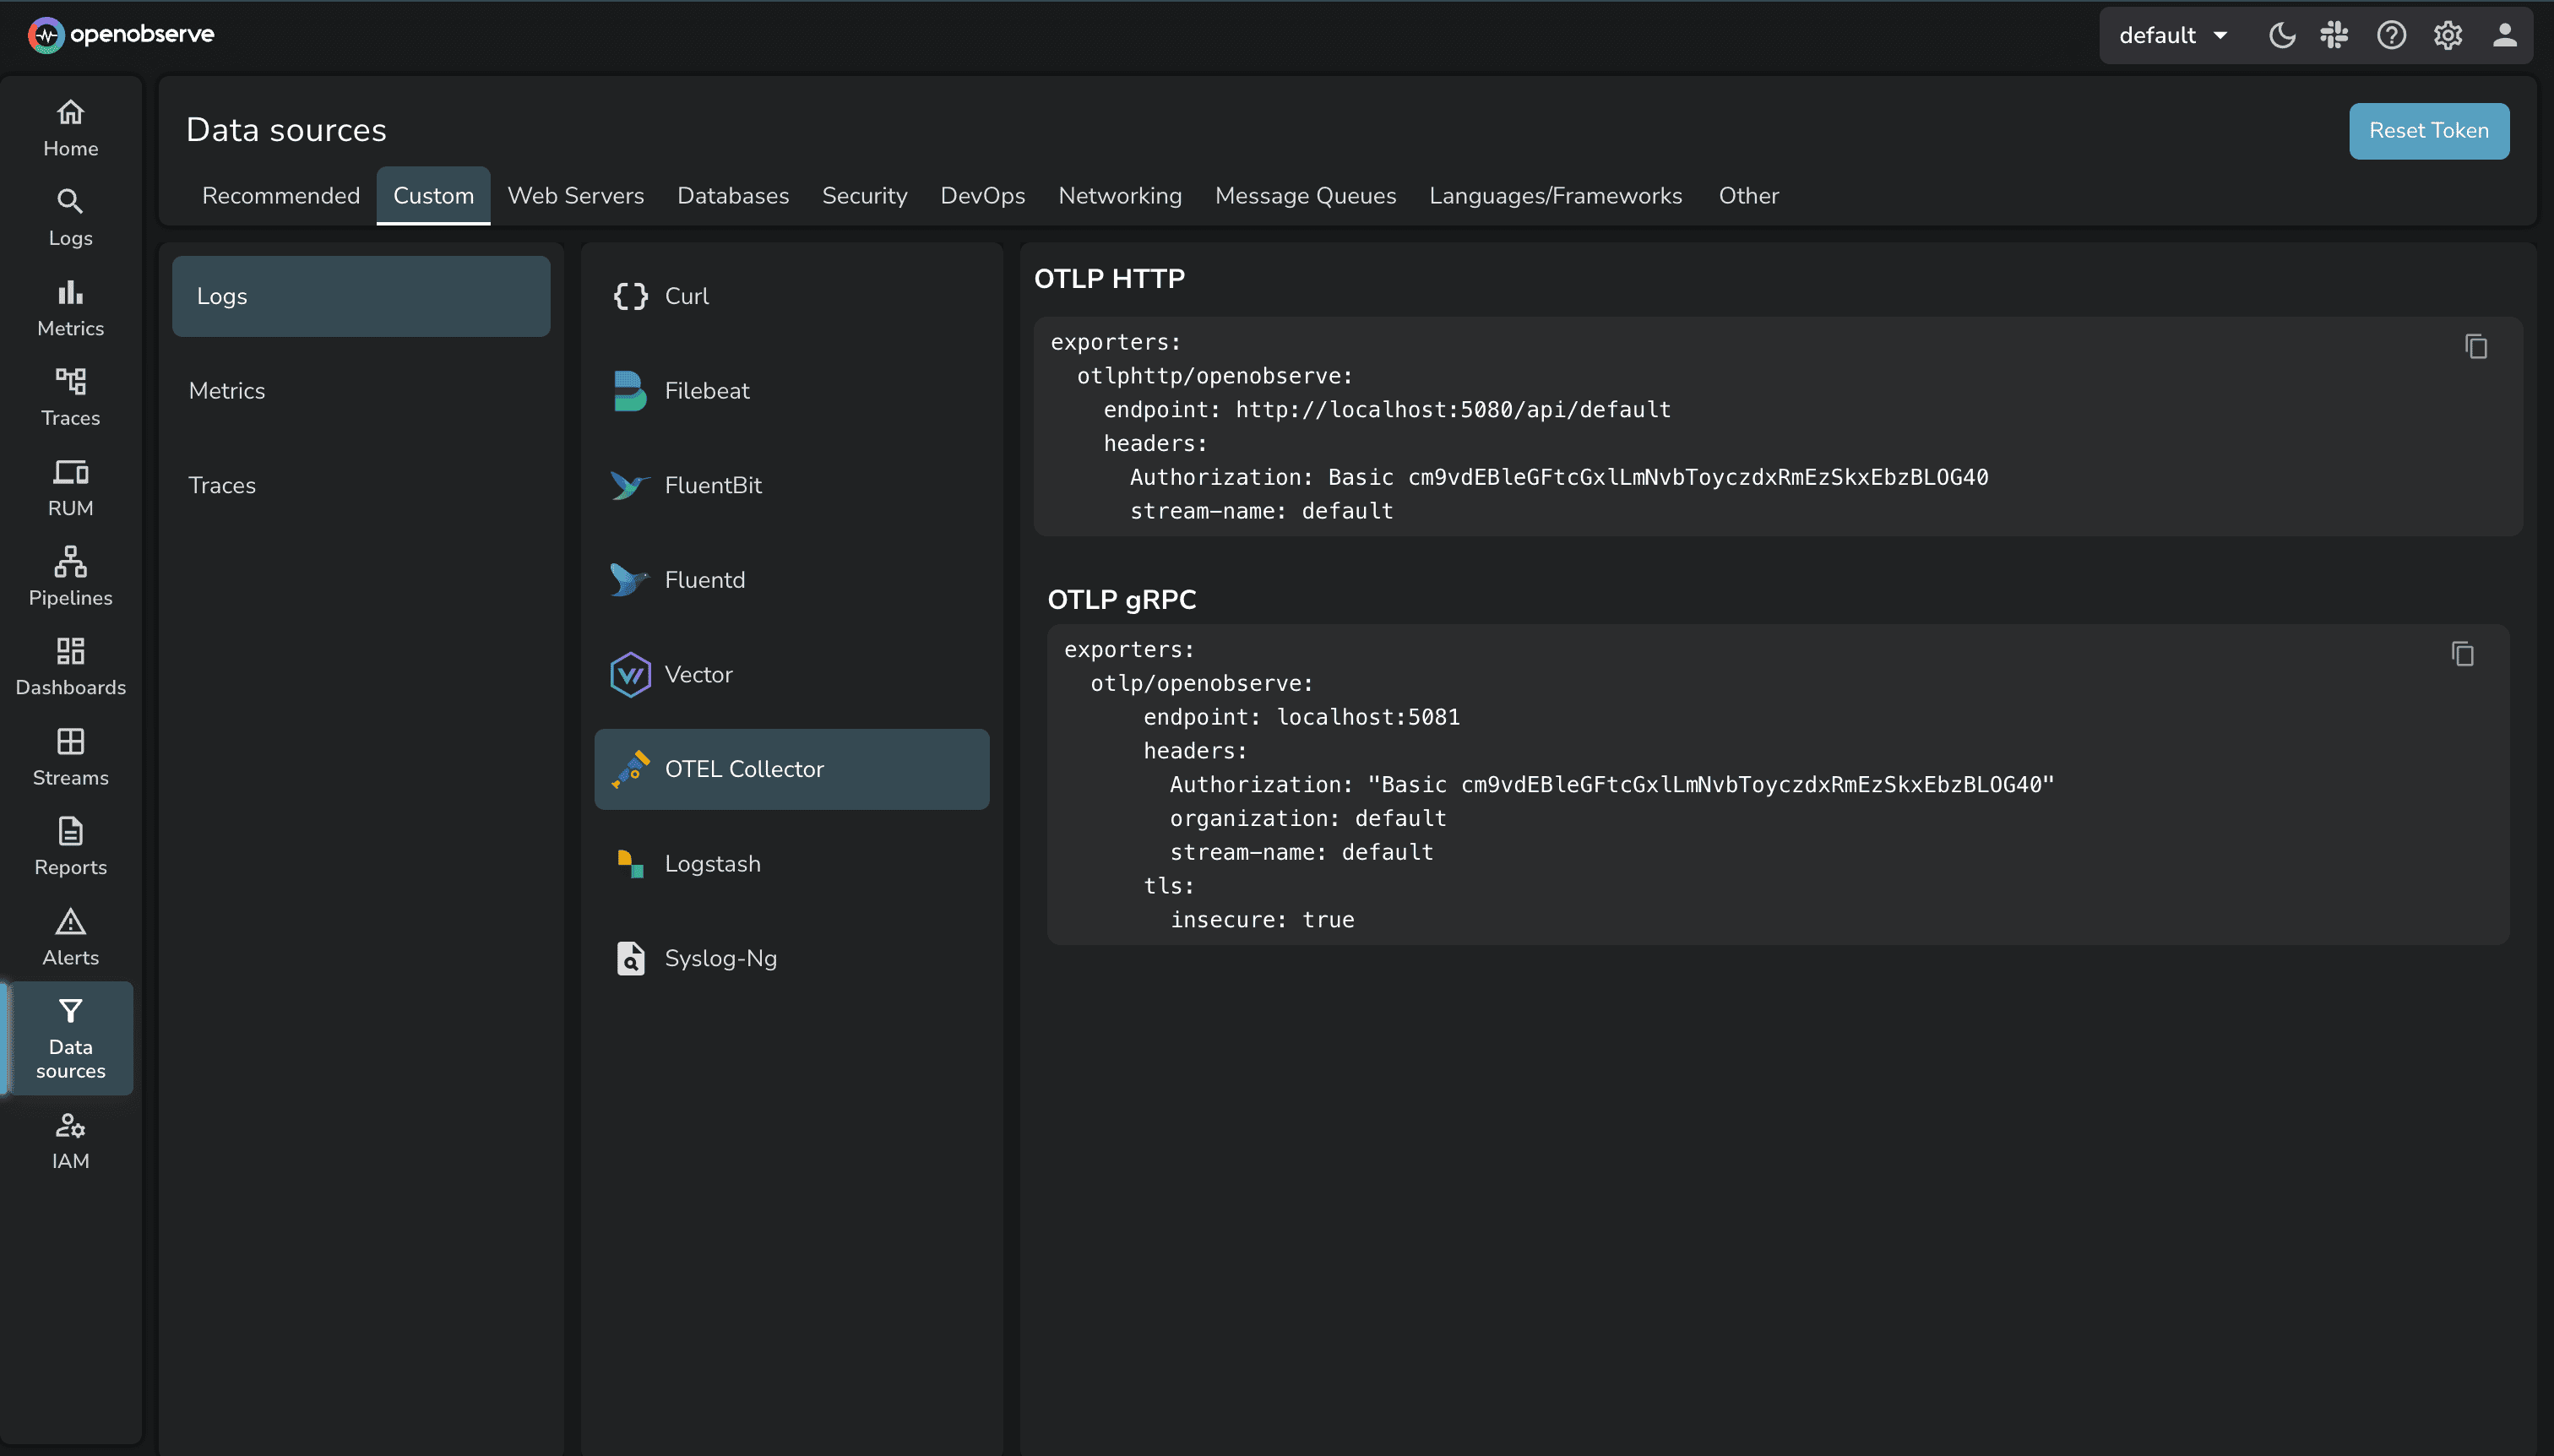
After (OpenObserve Configuration):
exporters:
  otlphttp/openobserve:
    endpoint: https://your-org.openobserve.ai/api/default/
    headers:
      Authorization: "Basic ${OPENOBSERVE_TOKEN}"
      stream-name: "default"
2. Run both platforms in parallel
Test OpenObserve with your production traffic while Lightstep still runs. Validate data quality and dashboard parity before fully committing.
3. Complete migration
Once validated, migrate all workloads to OpenObserve.
SQL/PromQL querying - Universal languages your team already knows. No proprietary DSL to learn.
OpenTelemetry-native - Your existing instrumentation works as-is. No agent rewrites or application changes.
Self-hosted or cloud - Deploy however your team prefers. Cloud for simplicity, self-hosted for complete control.
Similar visualization - Familiar observability workflows. Dashboards, service maps, trace views work the same way.
Talk to our team for a personalized migration plan. We'll help you:
Contact us for migration support
| Tool | Deployment | OTel Native | Pricing Model | Migration Ease | Best For |
|---|---|---|---|---|---|
| OpenObserve | Cloud / Self-hosted | Yes | Ingestion-based | Very Easy (1 config change) | Drop-in Lightstep replacement with 90% cost savings |
| Grafana Stack | Cloud / Self-hosted | Yes | Modular (LGTM) | Moderate (Multiple components) | Maximum flexibility and best visualization |
| Honeycomb | SaaS only | Yes | Event-based | Very Easy (OTel-native) | High-cardinality tracing excellence |
| Datadog | SaaS only | Supported | Host/Usage-based | Moderate (More complex) | Enterprise teams with unlimited budget |
| New Relic | SaaS only | Yes | Per-GB | Easy (OTel-native) | Familiar SaaS with strong APM |
| Chronosphere | SaaS / Cloud | Compatible | Enterprise | Moderate (Metrics-focused) | Large-scale metrics with cost controls |
| Jaeger | Self-hosted | Yes | Free (Open source) | Easy (Traces only) | Distributed tracing only (no logs/metrics) |
| Elastic | Cloud / Self-hosted | Supported | Data-volume | Moderate (Operational complexity) | Log-heavy workloads with search focus |
| Dynatrace | SaaS / Hybrid | Supported | Unit-based | Moderate (OneAgent required) | Large enterprises needing automation |
| Splunk | SaaS / On-prem | Supported | Data-volume | Moderate (Complex pricing) | Security + Observability convergence |
With ServiceNow's March 1, 2026 Lightstep end-of-life deadline approaching, teams have an opportunity to modernize their observability stack while dramatically reducing costs and avoiding future vendor lock-in.
1. OpenObserve is the best drop-in replacement for Lightstep
For most teams, OpenObserve offers the optimal combination of:
2. OpenTelemetry-native platforms prevent future lock-in
Choose alternatives that support OpenTelemetry natively (OpenObserve, Honeycomb, Jaeger, Grafana) rather than platforms that translate OTel data into proprietary formats (Datadog, Dynatrace). This ensures you can switch platforms again in the future without rewriting application code.
3. Migration is straightforward with OpenTelemetry
If you're already using OpenTelemetry (which Lightstep users are), migration to OTel-native platforms like OpenObserve requires just updating your collector configuration. No application code changes, no re-instrumentation.
4. Start migration now
With the EOL deadline approaching, begin your evaluation and pilot testing immediately. Most teams can validate OpenObserve in a test environment within days.
Whether you choose OpenObserve or another alternative, prioritize OpenTelemetry-native platforms to avoid rewriting instrumentation and ensure long-term flexibility.
Ready to explore the best Lightstep alternative?
Get started fast: Watch From Zero to Observability in 30 Minutes with OpenObserve to see how OpenObserve helps teams move from zero to usable observability in under 30 minutes.
Try OpenObserve: Download or sign up for OpenObserve Cloud with a 14-day free trial.
Talk to our team: Schedule a migration consultation to get a personalized plan for your Lightstep replacement.
ServiceNow acquired Lightstep but decided to discontinue it without providing a replacement. The official reason wasn't detailed publicly, but it's part of their portfolio rationalization. For you, this means finding an alternative before March 1, 2026.
Start testing alternatives immediately. Most migrations take 2-4 weeks, so:
Yes, unless you export it now. ServiceNow stops accepting data after March 1, 2026. Use Lightstep's export APIs to save critical traces you need for compliance or debugging. Most teams only export essential data since full historical migration is rarely necessary.
No. If you're using OpenTelemetry (most Lightstep users are), just update your OTel Collector config to point to the new platform. Zero application code changes. Only if you're using Lightstep-specific SDKs (rare) would you need to re-instrument.
2-4 weeks realistically:
Some vendors claim "migrations in an hour" - that's just the config change. Budget a month to do it properly with dashboard recreation and validation.
ServiceNow stops accepting telemetry. Your observability goes dark - zero visibility into production. Set up at least a basic OTel-native platform (even free Jaeger) as a fallback to avoid complete blindness.
Yes - that's the whole point. Your OTel instrumentation continues working unchanged. This is why we recommend OTel-native platforms (OpenObserve, Honeycomb, Jaeger) over proprietary ones (Datadog, Dynatrace) that translate OTel into their formats. Keeps you flexible for future switches.
Manas is a passionate Dev and Cloud Advocate with a strong focus on cloud-native technologies, including observability, cloud, kubernetes, and opensource. building bridges between tech and community.