Observability vs. Monitoring: What's the Difference?




Ready to get started?
Try OpenObserve Cloud today for more efficient and performant observability.
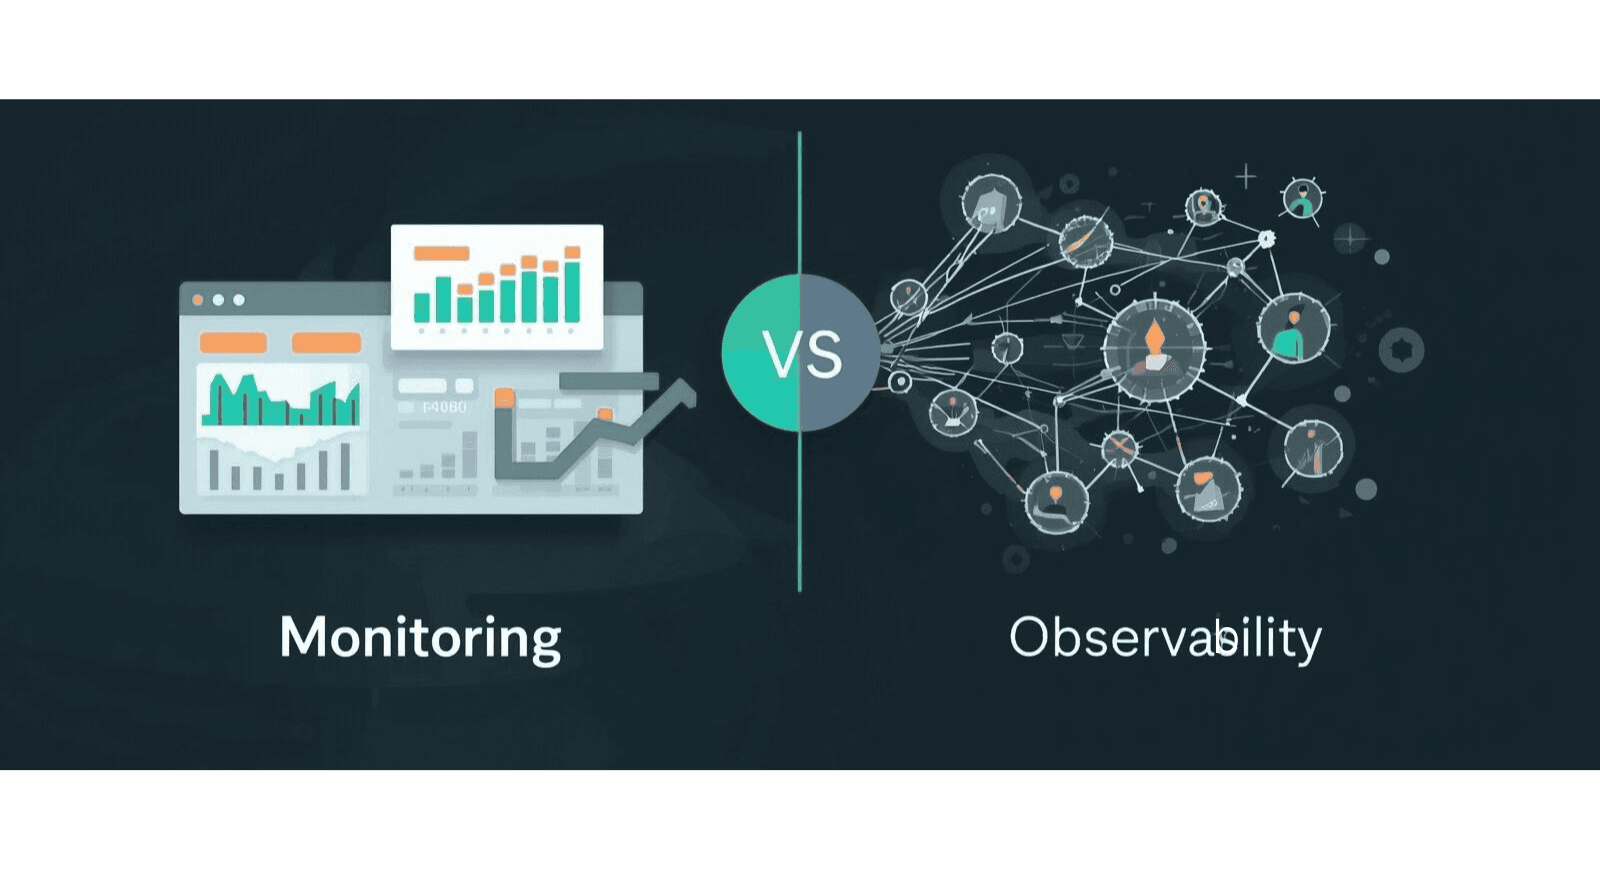
The observability vs monitoring question comes down to which questions each practice can answer. Monitoring collects predefined metrics and alerts you when a threshold is crossed: it tells you that a system is broken. Observability lets you interrogate rich telemetry to work out why, including failures you never predicted. Most production teams need both, layered together.
TL;DR
- Monitoring tracks known failure modes with predefined metrics, thresholds, and alerts. It answers "is the system healthy?"
- Observability uses logs, metrics, and traces to explain behavior you did not anticipate. It answers "why is this happening?"
- The technical dividing line is cardinality: monitoring aggregates data, observability preserves per-request detail you can slice by any attribute.
- Neither replaces the other. Monitoring detects, observability explains.
What Is Monitoring?
Monitoring is the practice of collecting, analyzing, and alerting on predefined metrics to track the health of your systems. It answers the question: "Is my system working?"
Traditional monitoring focuses on known failure modes. You define thresholds, set up alerts, and get notified when something crosses a boundary you've established. Think CPU usage exceeding 90%, response times climbing above 500ms, or error rates spiking past 1%.
Core Components of Monitoring
- Metrics collection forms the foundation. Tools gather numerical data points over time: request counts, memory consumption, disk I/O, and network throughput. These time-series metrics paint a picture of system behavior.
- Alerting rules define when something needs attention. When disk space drops below 10% or database connections max out, on-call engineers receive notifications.
- Dashboards visualize trends. Teams build views showing performance indicators, making it easy to spot patterns during incidents or capacity planning sessions. If you're building these out, our guide to observability dashboards covers layout and query patterns that hold up during incidents.
Common Monitoring Use Cases
- Infrastructure health tracking (servers, containers, databases)
- Uptime and availability measurement
- Resource utilization and capacity planning
- SLA compliance verification
- Basic performance benchmarking
What Is Observability?
Observability goes beyond monitoring by enabling teams to understand why systems behave the way they do, even when facing problems they've never encountered before. It answers: "Why is my system broken?"
The term comes from control theory, where a system is considered observable if you can determine its internal state by examining its outputs. In software, observability means instrumenting applications so that any question about system behavior can be answered through the data it produces. For the full definition, the properties that make a system observable, and a maturity model for getting there, see What Is Observability? The Complete Guide.
The Three Pillars of Observability
- Logs capture discrete events with rich context. Unlike simple text files, structured logs include metadata like request IDs, user identifiers, and timestamps that enable correlation across services.
- Metrics quantify system behavior over time. While monitoring uses metrics too, observability platforms often support high-cardinality metrics that allow slicing data by any dimension: specific customers, feature flags, deployment versions, or geographic regions.
- Traces follow requests as they flow through distributed systems. A single user action might touch dozens of microservices; distributed tracing connects those dots, showing latency contributions and failure points across the entire request path.
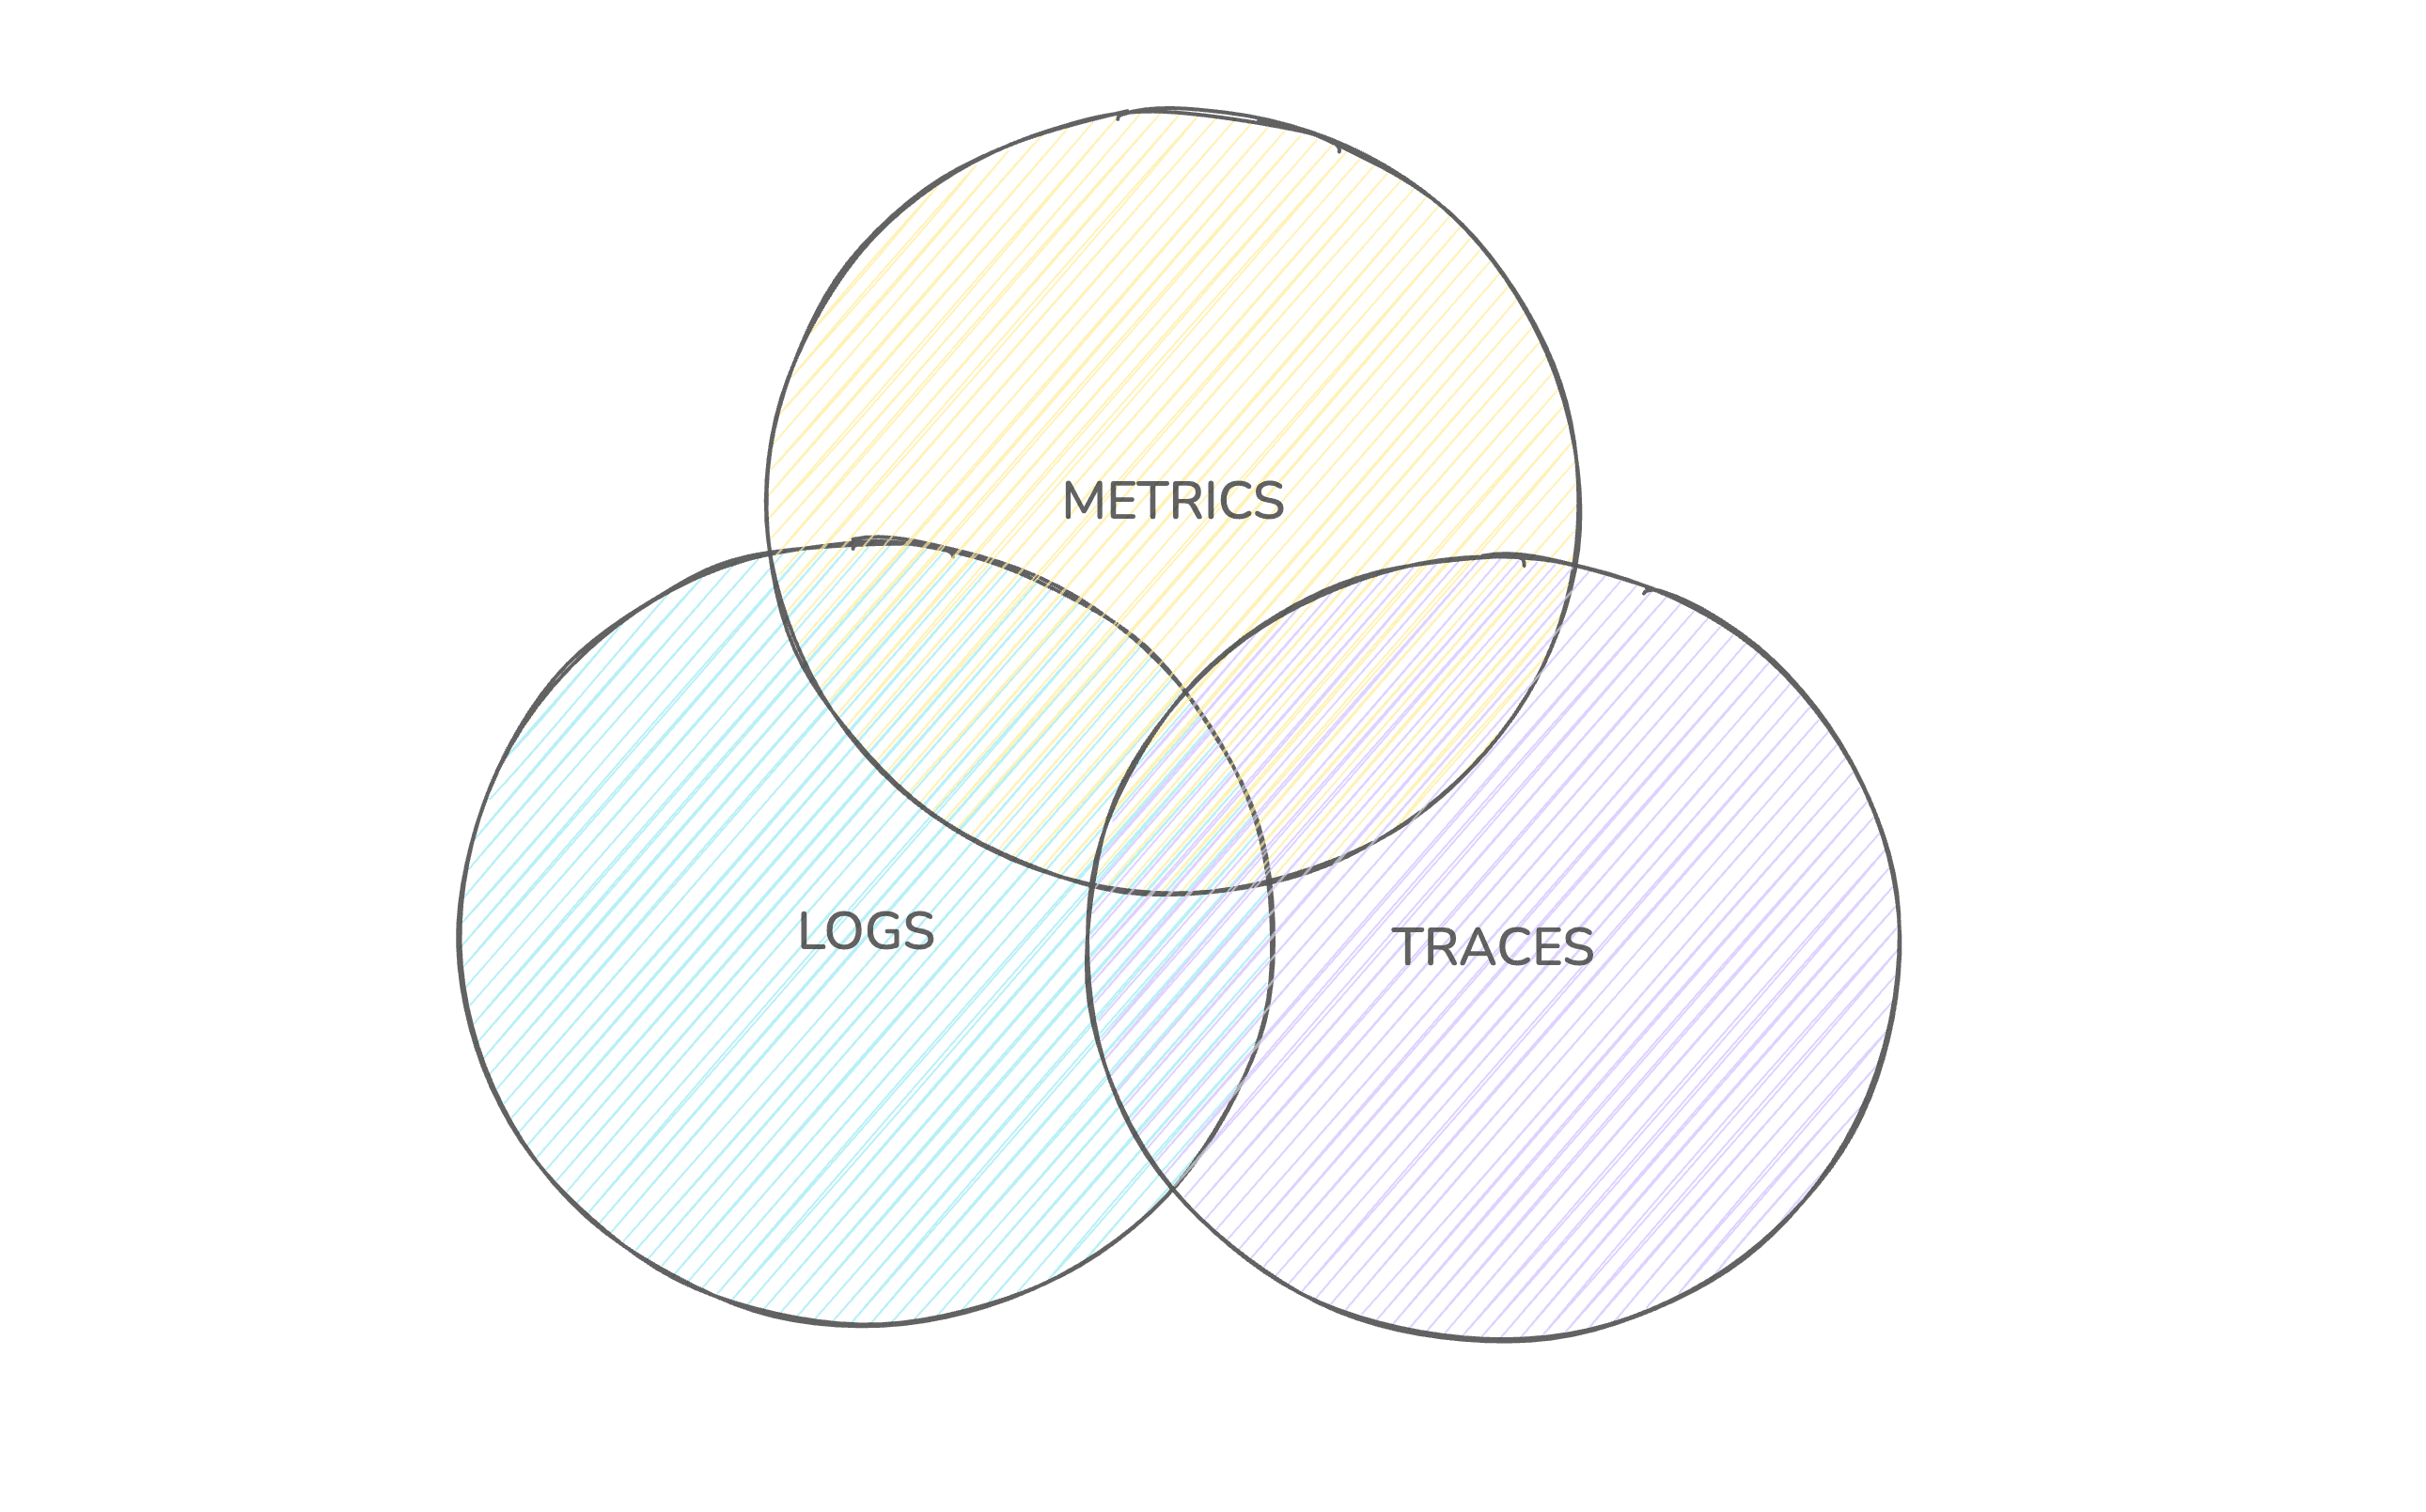
For a deeper treatment of how the three signals work together, see logs, metrics, and traces explained.
Why Observability Matters for Modern Systems
Microservices architectures, containerized deployments, and serverless functions create complexity that traditional monitoring struggles to handle. When a request passes through fifteen services before returning an error, you need more than a red alert on a dashboard.
Observability enables:
- Debugging novel problems without prior knowledge of failure modes
- Understanding system behavior during unexpected conditions
- Correlating symptoms across distributed components
- Reducing mean time to resolution through faster root cause analysis
- Proactive identification of performance bottlenecks
Observability vs Monitoring: The Differences That Matter
| Aspect | Monitoring | Observability |
|---|---|---|
| Primary question | Is it broken? | Why is it broken? |
| Approach | Predefined checks and thresholds | Exploratory investigation |
| Data model | Aggregated metrics | High-cardinality, correlated telemetry |
| Failure handling | Known failure modes | Unknown unknowns |
| Best suited for | Stable, well-understood systems | Complex, distributed architectures |
| Skill requirement | Configuration-focused | Analysis and investigation skills |
Reactive vs Exploratory
Monitoring is inherently reactive. You configure it based on past experience: the failures you've seen before become the alerts you set up. This works well for predictable systems but falls short when novel problems emerge.
Observability supports exploration. Engineers can ask arbitrary questions of their data, drilling down from symptoms to causes without needing predetermined queries. When a new deployment introduces subtle latency in edge cases, observability tools let you investigate without having anticipated that specific failure.
Cardinality Is the Technical Dividing Line
Traditional monitoring aggregates aggressively. Average response time across all endpoints, total error count per minute, median CPU usage. These summaries keep storage cheap, and they sacrifice detail to do it.
Cardinality is the number of unique values a data dimension can take. A metric labeled by HTTP status code has a handful of values. A trace attribute holding customer ID, deployment version, or session ID has millions. Aggregated monitoring systems cap cardinality because every unique label combination creates a new time series to store. Observability platforms are built to retain those wide, per-request attributes.
That retention is what makes exploratory debugging possible. You can examine the exact sequence of events for a single problematic request, compare behavior between two customer cohorts, or discover that latency only affects users on one specific mobile carrier. None of those questions can be answered from an average.
What Does the Difference Look Like During an Incident?
Here is a scenario most on-call engineers will recognize. A Friday afternoon deploy goes out. Dashboards stay green: p50 latency is normal, the error rate sits under its 1% threshold, CPU is fine. Twenty minutes later, support tickets start arriving from customers who can't check out.
With monitoring alone, you're stuck. No alert fired, because averages absorbed the damage. A small slice of traffic is timing out, and that slice is invisible in every aggregate on the dashboard. The team starts guessing: roll back the deploy? Restart the payment service? Blame the CDN?
With observability, the investigation follows the data instead:
- Filter traces to the checkout endpoint and sort by duration. A cluster of requests taking over 8 seconds stands out immediately.
- Group those slow traces by their attributes. They share two:
region: eu-westandapp_version: 2.14.0. - Open one slow trace. Nearly all the time sits in a retry loop inside the payment-provider span.
- Pivot to logs sharing that trace ID. The payment client is logging TLS handshake failures against the provider's EU endpoint, which rotated its certificate that morning.
Ten minutes from symptom to root cause, for a failure nobody could have written an alert for in advance. That is the gap between knowing something is wrong and knowing why.
When to Use Monitoring vs Observability
The choice isn't binary. Most organizations need both approaches, applied appropriately.
Monitoring Excels When:
- Systems are relatively simple and well-understood
- Failure modes are predictable and documented
- You need cost-effective coverage for stable infrastructure
- Compliance requires specific metric tracking
- Teams are smaller and can't invest in deep instrumentation
Observability Is Essential When:
- Running microservices or distributed systems
- Deploying frequently with continuous delivery
- Supporting many different customer configurations
- Investigating performance issues in production
- Building new systems where failure modes aren't yet known
The Cost Question
Observability data is heavier than monitoring data. Retaining per-request traces and high-cardinality attributes means storing orders of magnitude more telemetry than a set of aggregated time series, and several commercial platforms price by ingested volume, host count, and custom metrics, so bills climb with the very cardinality that makes the data useful.
Teams manage this with head-based or tail-based trace sampling, tiered retention (hot data for days, cheap object storage for months), and backends built on columnar storage that compress telemetry aggressively. Our guide to observability cost optimization walks through these tactics in detail. The spend also buys something concrete: shorter incidents, fewer engineers pulled into war rooms, and outages caught before customers notice.
OpenTelemetry Changed the Adoption Math
For years, the practical barrier to observability was instrumentation lock-in. Each vendor shipped its own agent, so switching backends meant re-instrumenting every service.
OpenTelemetry, a graduated CNCF project, removed that barrier. You instrument once with vendor-neutral SDKs, and telemetry flows over the OTLP protocol to any compatible backend. Swapping platforms becomes an exporter config change instead of a rewrite. If you're starting fresh, read what OpenTelemetry is and how it works before picking any tool.
The same standard now extends to newer workloads. AI applications emit tokens, prompts, and model latency as telemetry, and the ecosystem of LLM observability tools builds on the same OpenTelemetry foundations.
Popular Tools in Each Category
Monitoring Tools
- Prometheus for metrics collection and alerting
- Nagios and Zabbix for infrastructure monitoring
- PagerDuty and Opsgenie for alerting and incident management
- CloudWatch, Azure Monitor, and Google Cloud Monitoring for cloud-native environments
Observability Platforms
- OpenObserve for open source, cost-effective log, metric, and trace management
- Datadog for unified logs, metrics, and traces
- Splunk for log analysis and investigation
- Jaeger and Zipkin for distributed tracing
- Honeycomb for high-cardinality event analysis
- New Relic and Dynatrace for full-stack observability
Many modern platforms blur the lines, offering both monitoring and observability capabilities in unified solutions. For a ranked breakdown, see our top 10 observability tools comparison.
Where OpenObserve Fits
OpenObserve is an open source (AGPL-3.0) observability platform that handles both sides of this article: alerts and dashboards for the monitoring layer, plus logs, metrics, and traces in one place for investigation. It ingests everything over a single OTLP endpoint, stores telemetry in columnar format to keep high-cardinality data affordable, and runs as a single binary if you'd rather self-host.
Conclusion
Monitoring tells you something is wrong; observability helps you understand why. Simple systems may get by on monitoring alone. Distributed architectures need both: monitoring for baseline health and known issues, observability for the failures nobody predicted.
Start where you are. If you're monitoring-only today, add tracing to your most critical user-facing flow. If you have observability data but struggle to use it, invest in training and better dashboards.
Frequently Asked Questions
About the Author
Simran Kumari

Passionate about observability, AI systems, and cloud-native tools. All in on DevOps and improving the developer experience.
Follow OpenObserve on Google
Add OpenObserve as a preferred source to see more of our articles in Google Search and Top Stories.












