Tracing Made Easy: A Beginner's Guide to Jaeger and Distributed Systems

Sampath Siva Kumar Boddeti
November 06, 2024
12 min read
Don’t forget to share!
Try OpenObserve Cloud today for more efficient and performant observability.
As software systems evolve, they become increasingly complex, especially with the rise of microservices and distributed architectures. Keeping track of what's happening across different services can quickly become a daunting task. Tracing tools like Jaeger have emerged as essential solutions for debugging and monitoring distributed applications, helping developers understand and optimise their systems.
In this blog, we will cover:
To truly understand Jaeger, it’s vital to grasp the concept of observability. Observability allows us to infer the internal states of systems through their outputs, and it primarily revolves around three pillars:
Before we dive into Jaeger, it’s essential to understand the concept of distributed tracing and why it’s crucial in microservices environments.
Distributed tracing is a methodology used to track and analyze requests as they traverse through various services in a distributed system. It helps in visualizing the journey of a request, from the initial entry point all the way to the final response.
E.g. Service A → Service B → Service C → Service D
In monolithic applications, tracing and debugging are straightforward. However, modern applications often depend on multiple microservices communicating over networks, complicating the identification of delays or failures.
Logging alone can’t capture complex dependencies or detect bottlenecks. Distributed tracing tools like Jaeger provide end-to-end visibility of requests, capturing metadata at each step, which helps developers:
Jaeger is an open-source, end-to-end distributed tracing tool originally developed by Uber Technologies. Now part of the CNCF (Cloud Native Computing Foundation), Jaeger allows developers to trace requests as they propagate through distributed systems, providing insights into service behavior and performance bottlenecks.
With Jaeger, you can:
Jaeger is widely adopted due to its powerful tracing capabilities, ease of use, and integration with other monitoring tools in the observability stack.
 Jaeger traces requests as they travel through various services in a distributed system. It captures information about each service’s interaction, which helps in pinpointing issues. Let’s break down the primary components of Jaeger to understand its functioning:
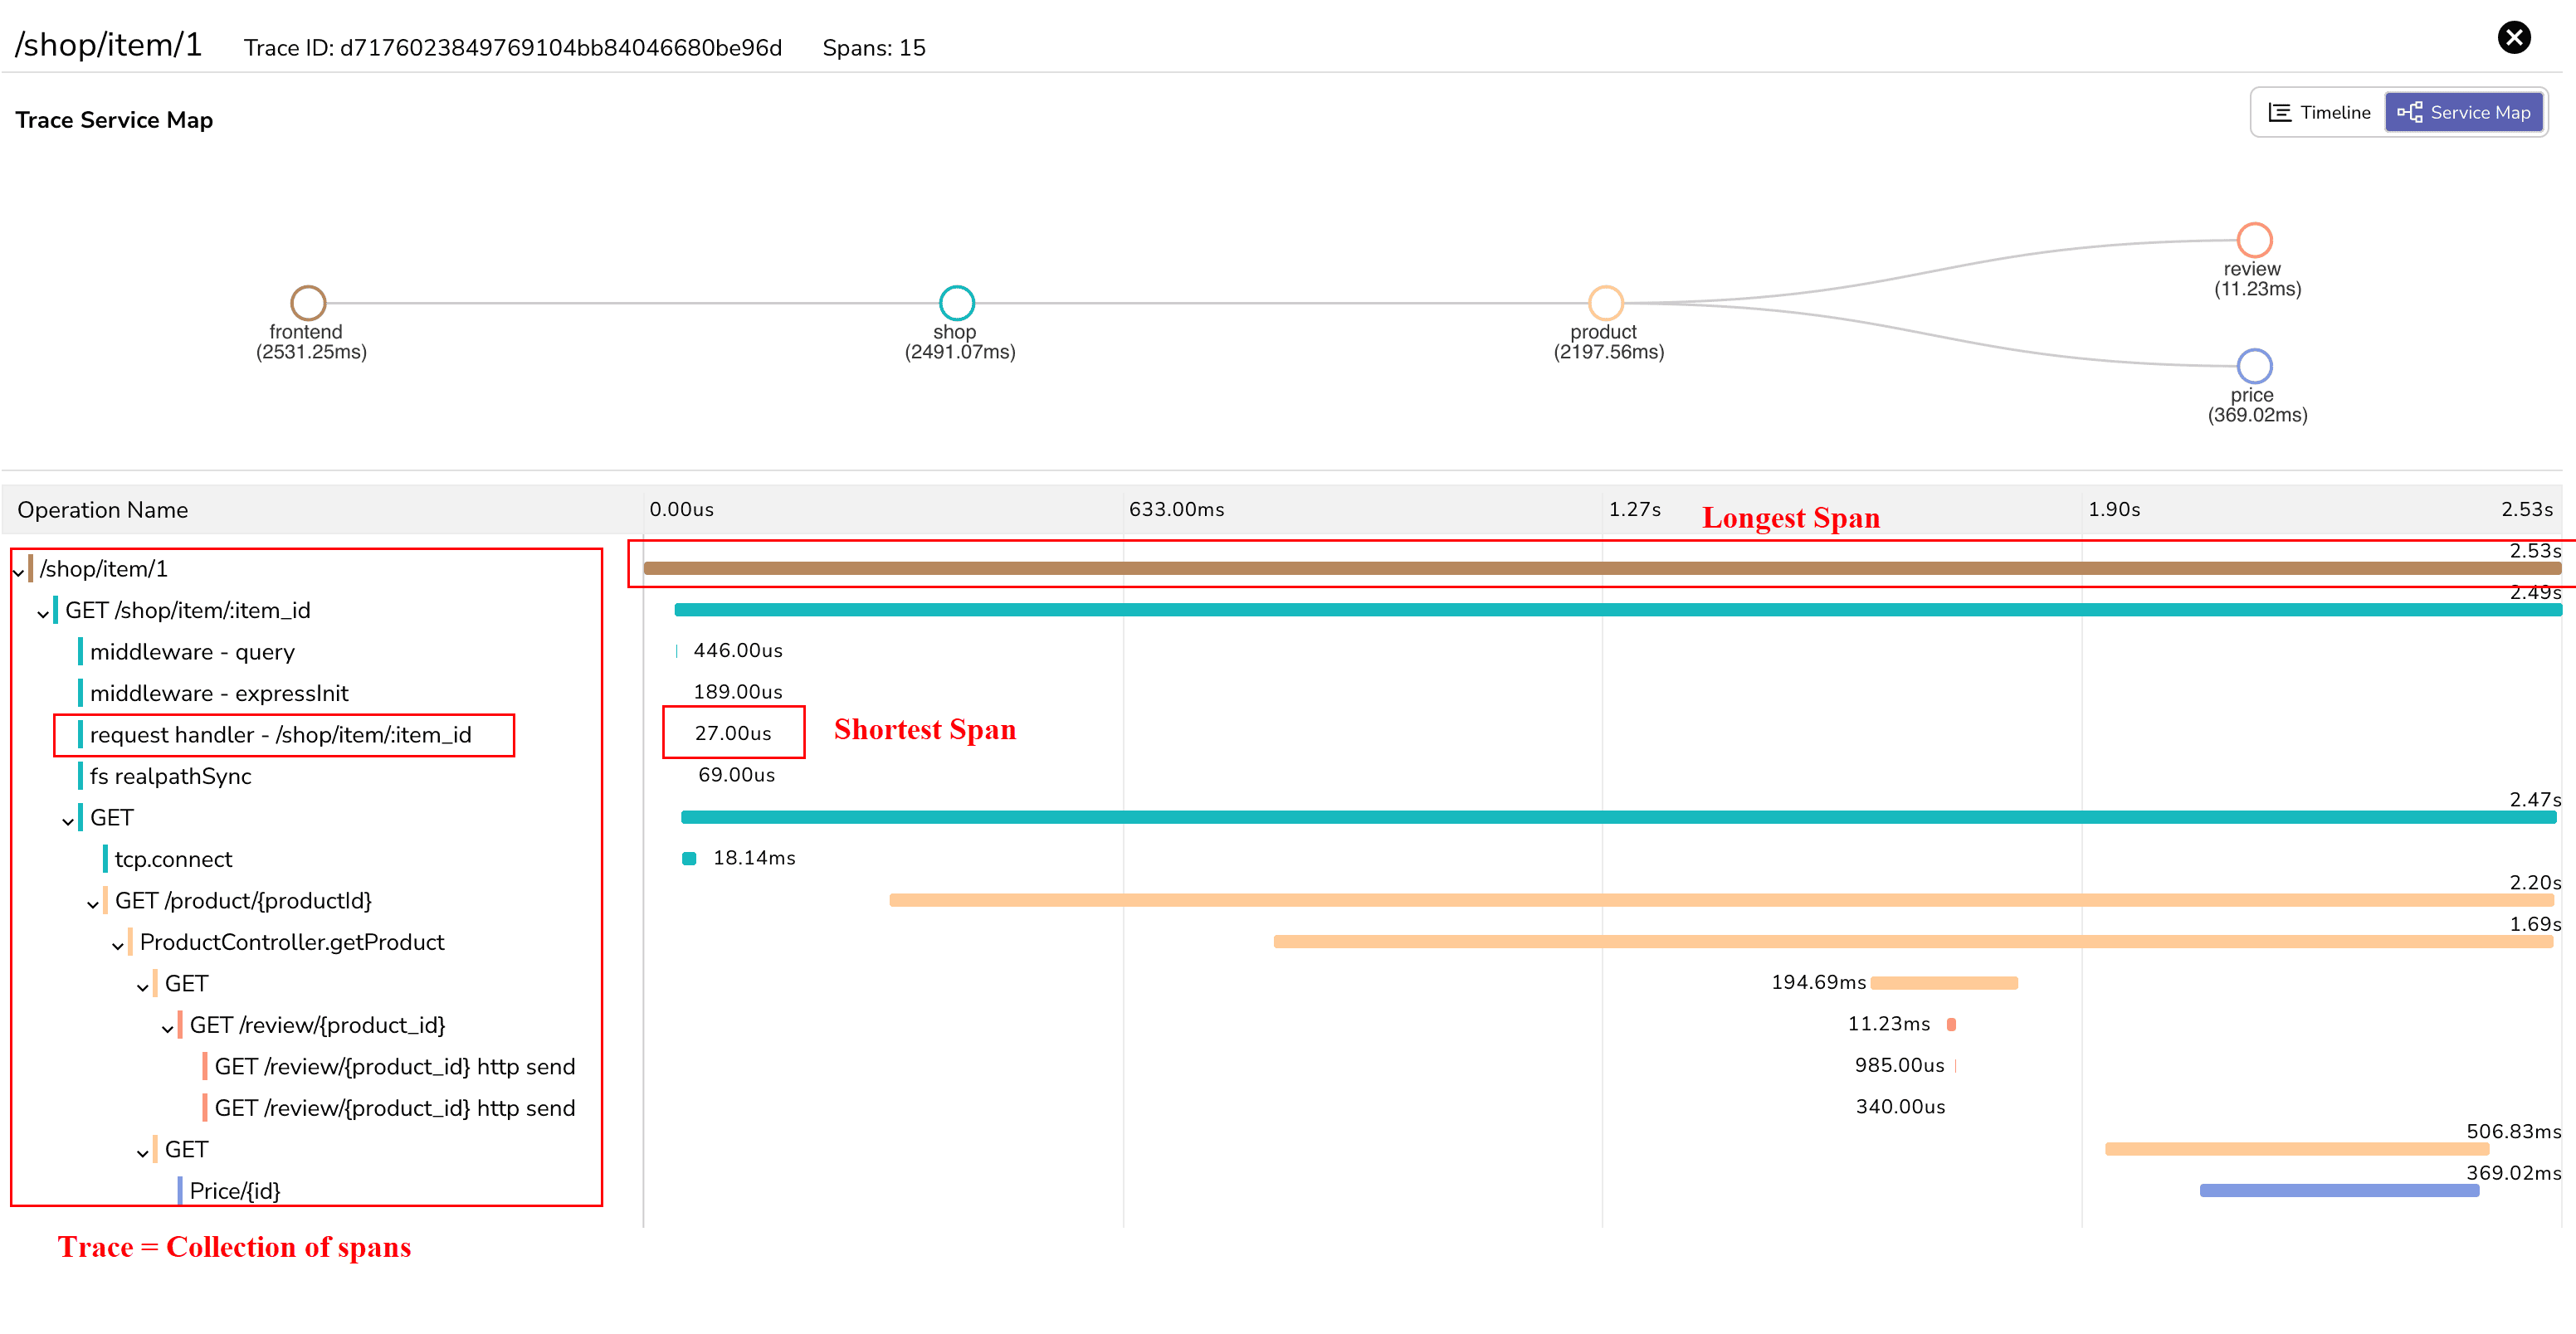
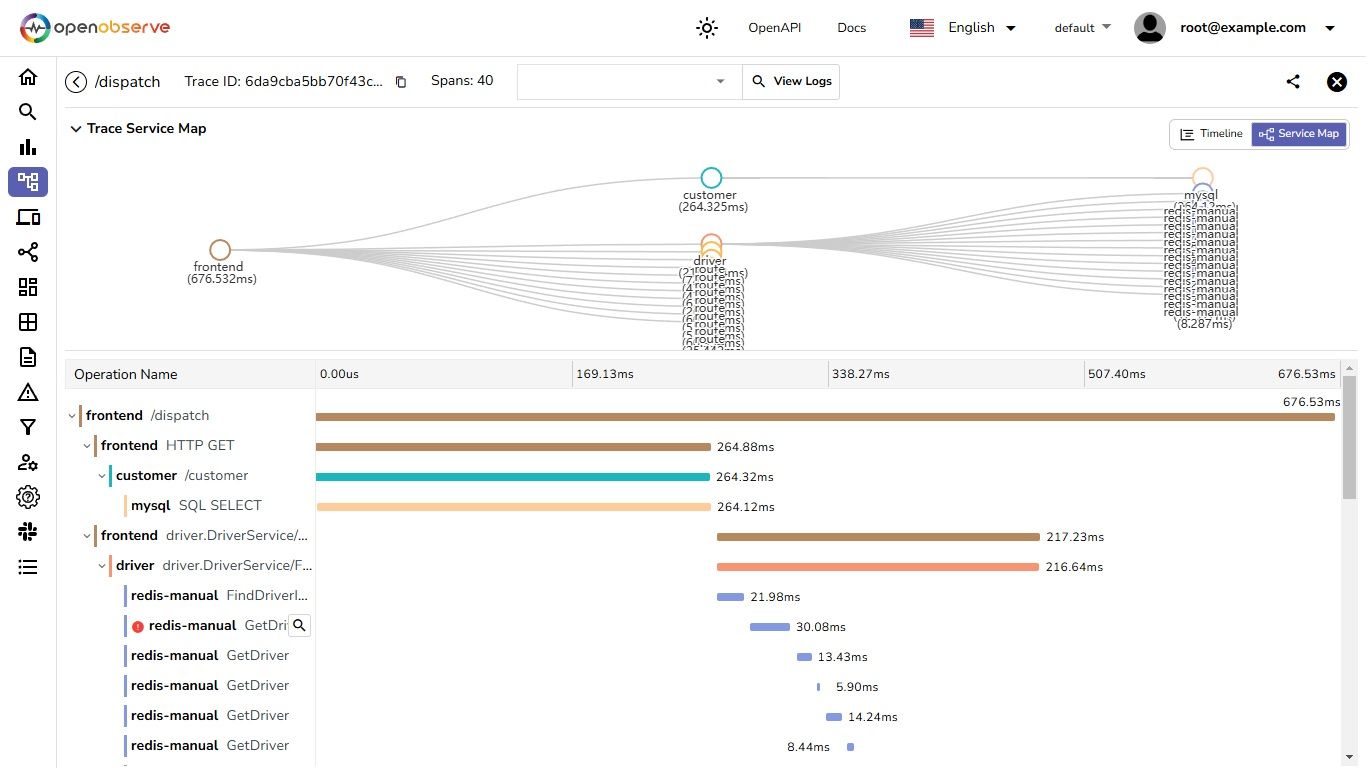
This screenshot is from the HOT Commerce project by OpenObserve, which demonstrates tracing across microservices. For more details, visit the project on GitHub here.
In the image above, each line represents a span—a single operation within the overall trace, showing the journey of a request across services:
This breakdown shows how the request interacts with multiple services and highlights areas for potential optimization.
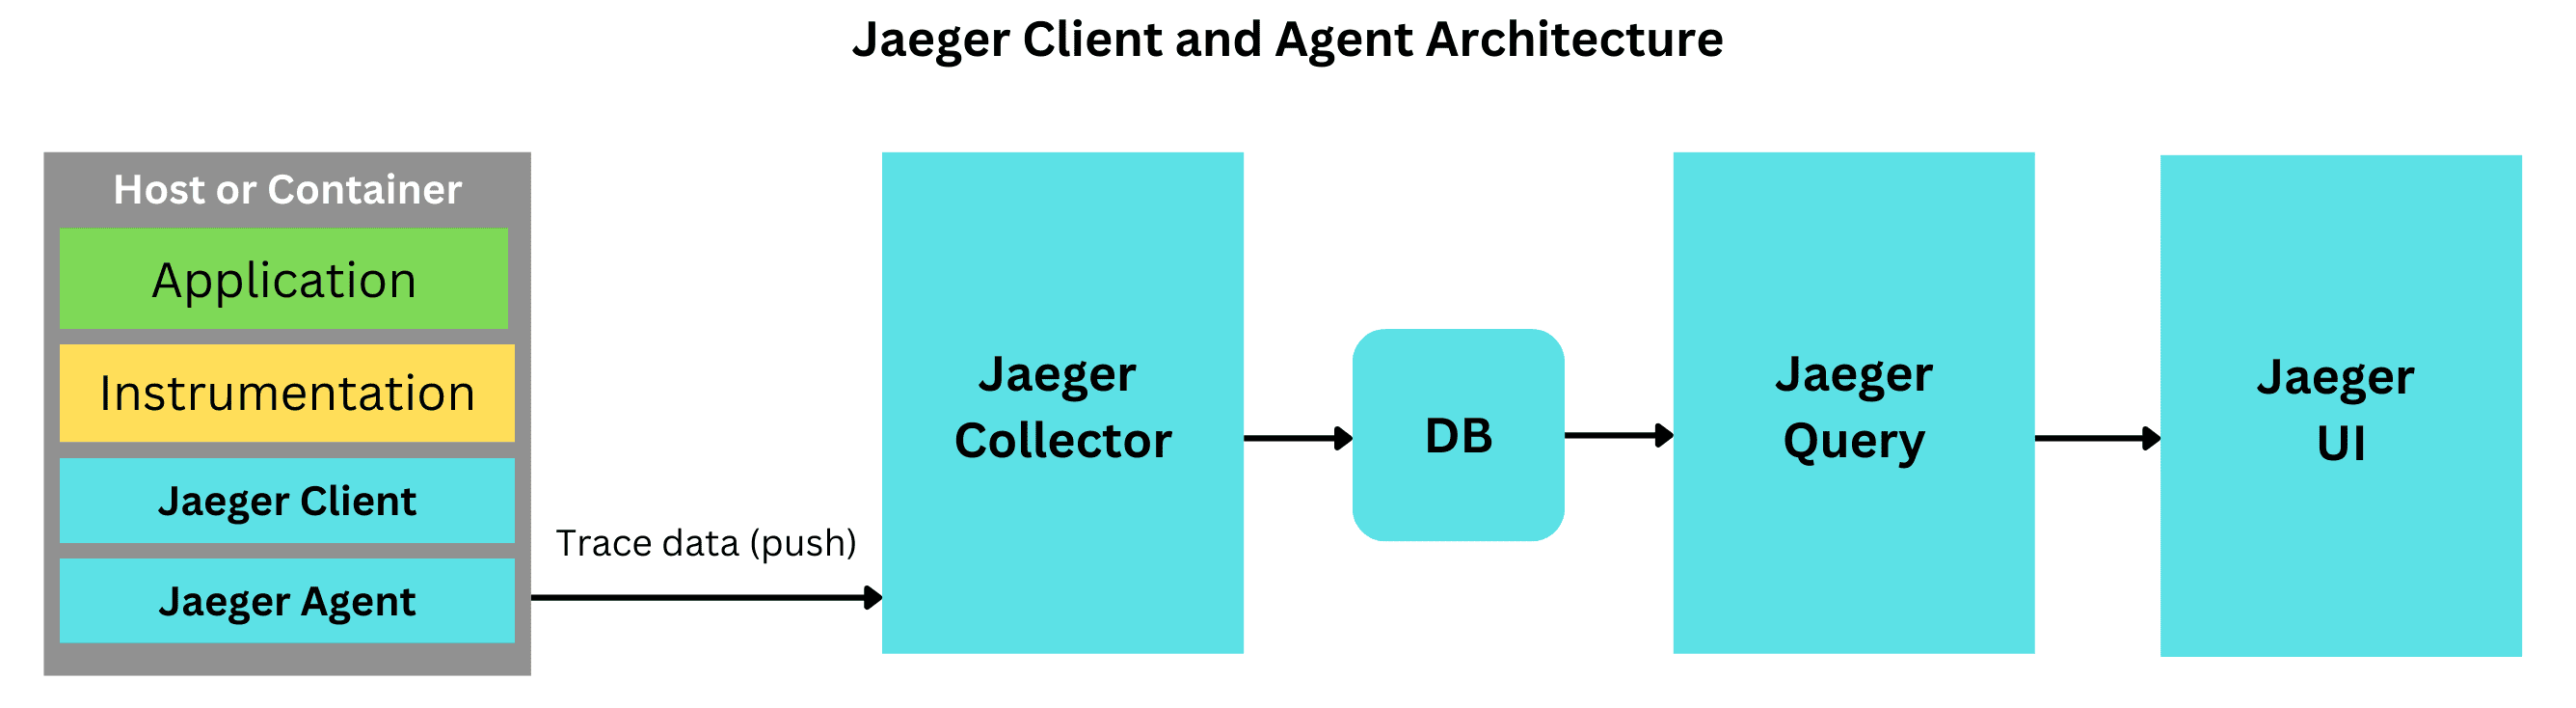
Jaeger clients are libraries that you embed in your application code to instrument services and collect tracing data. These clients generate spans and traces, sending them to a collector for storage and analysis.
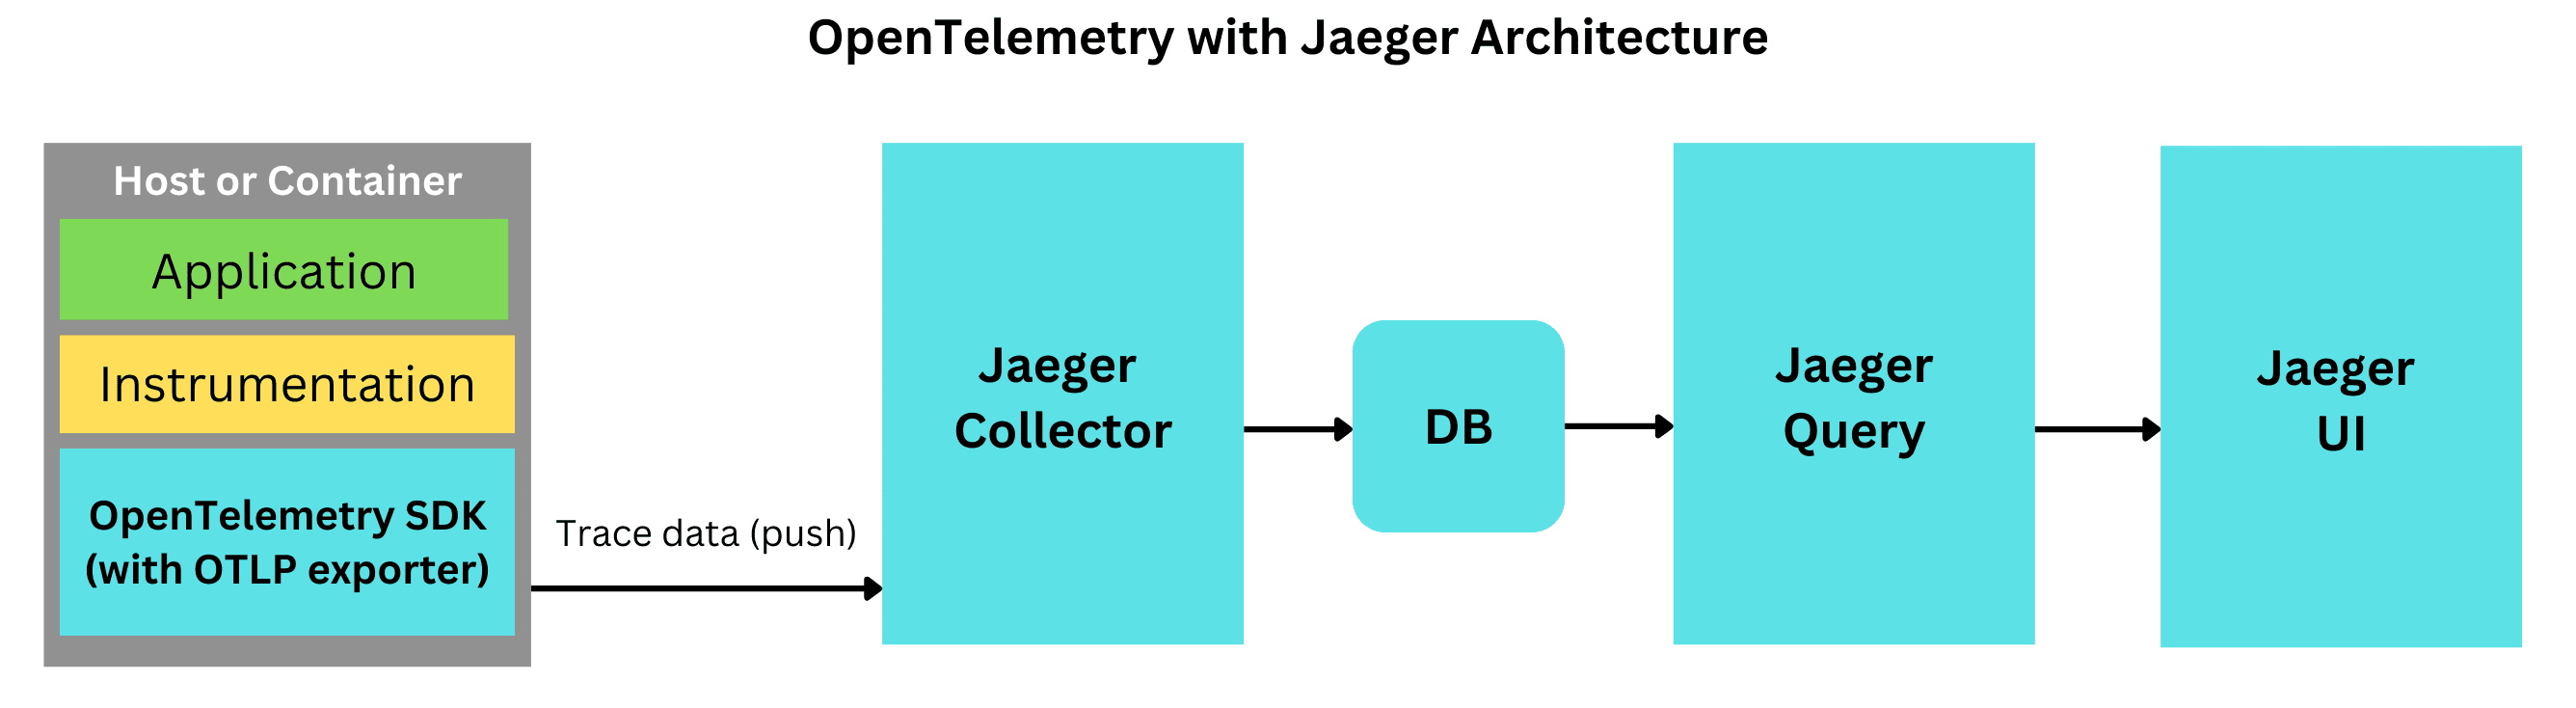
Alternatively, instead of using the Jaeger-specific client, you can also use OpenTelemetry (OTel) SDKs for instrumentation. OpenTelemetry is a vendor-neutral observability framework that can work with multiple tracing backends, including Jaeger. Using OTel SDKs allows flexibility to switch or integrate with other observability tools.
The Jaeger agent is a lightweight daemon running alongside the application. It receives traces emitted by the client and batches them for efficient transmission to the collector.
Alternatively, the OpenTelemetry Collector can be used as an alternative to the Jaeger Agent. The OTel Collector is a versatile tool that not only receives, processes, and exports tracing data but can also handle metrics and logs. It can send data to multiple observability backends, making it a flexible choice for distributed tracing setups.
The Jaeger collector receives traces from agents and stores them in a backend. It also performs any preprocessing or filtering needed for the traces before they are stored.
In OpenTelemetry-based setups, the OTel Collector can handle this role as well, offering additional features like data transformation and routing, which make it ideal for complex or multi-backend environments.
When a user request enters a service, the Jaeger client library starts a trace, generating a unique trace ID for that request. As the request flows through different services, the trace ID propagates along, with each service generating a span representing its part of the work. These spans are sent to the Jaeger agent and ultimately stored in the backend.
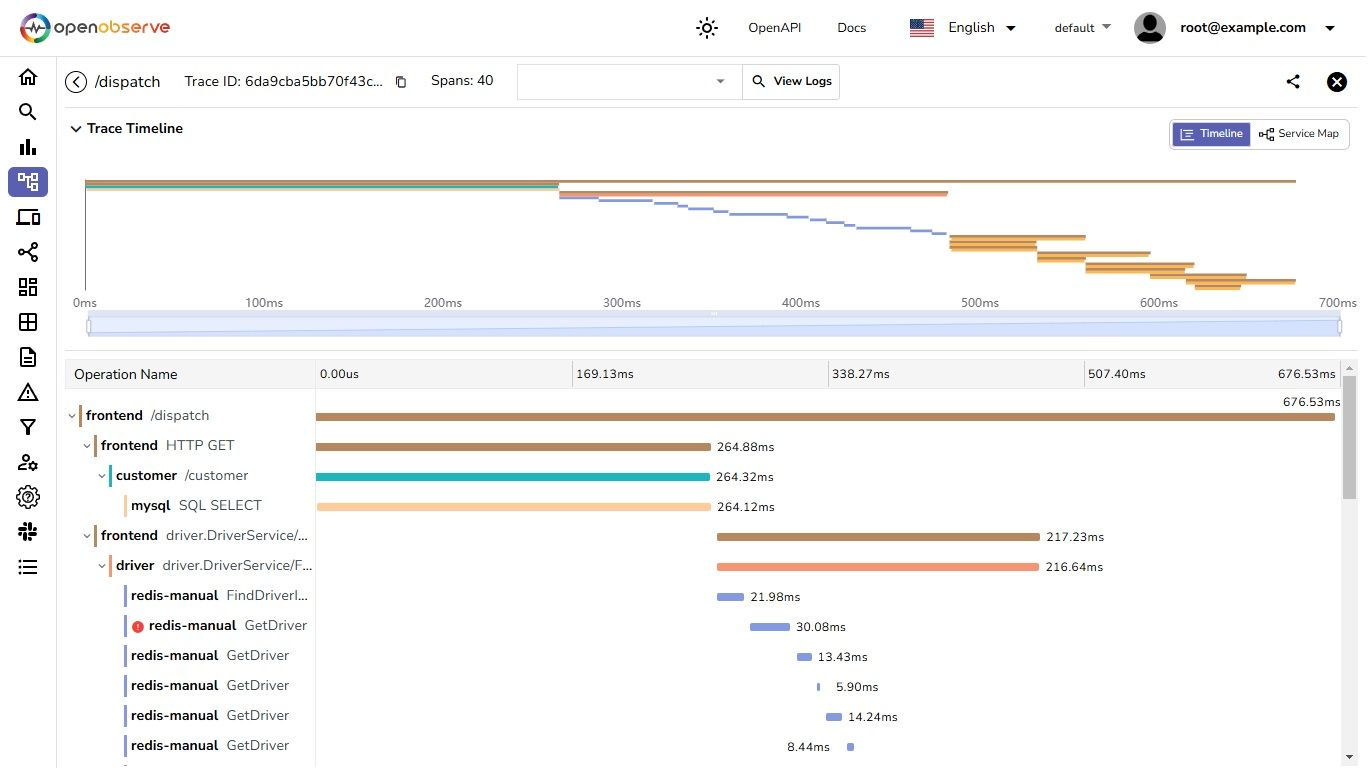
The Jaeger UI allows you to visualise traces in a timeline view, making it easier to observe the sequence of events and locate bottlenecks. The UI also provides a service dependency graph that shows the relationships between services, allowing you to monitor dependencies and the overall health of your system.
Here’s a quick guide to setting up Jaeger in your environment. We'll use Docker to deploy Jaeger and assume you have Docker installed. For a complete setup guide, refer to the Jaeger Getting Started Documentation.
Jaeger offers an all-in-one image for testing and development purposes. To start the Jaeger all-in-one container, run the following command:
docker run --rm --name jaeger \
  -e COLLECTOR_ZIPKIN_HOST_PORT=:9411 \
  -p 6831:6831/udp \
  -p 6832:6832/udp \
  -p 5778:5778 \
  -p 16686:16686 \
  -p 4317:4317 \
  -p 4318:4318 \
  -p 14250:14250 \
  -p 14268:14268 \
  -p 14269:14269 \
  -p 9411:9411 \
  jaegertracing/all-in-one:1.62.0
The above command runs the Jaeger all-in-one Docker container, which is useful for testing and development. It exposes the following ports:
Note: This setup uses memory as the default backend storage, which is intended for short-term use and is not recommended for production due to the lack of persistence.
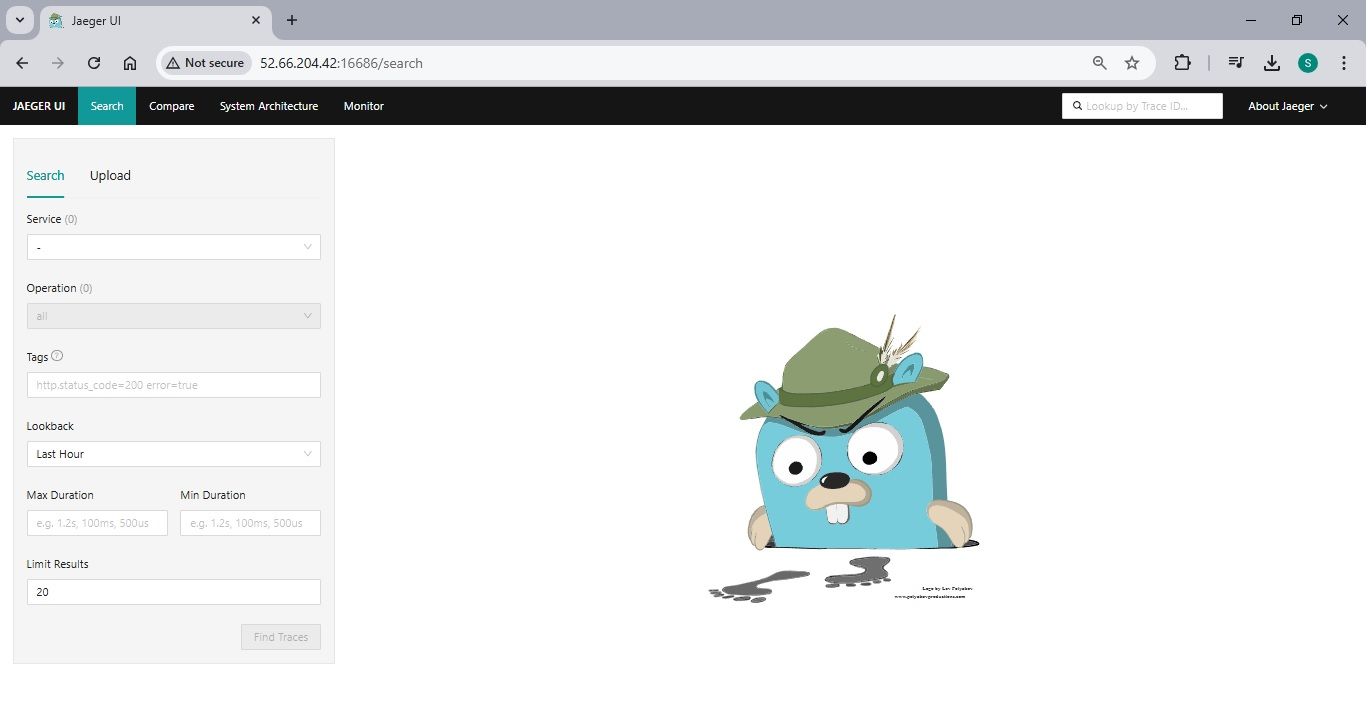
You can access the Jaeger UI at http://localhost:16686, to visualise and interact with the traces collected.
Next, we'll instrument the HotROD sample application to work with Jaeger for distributed tracing.
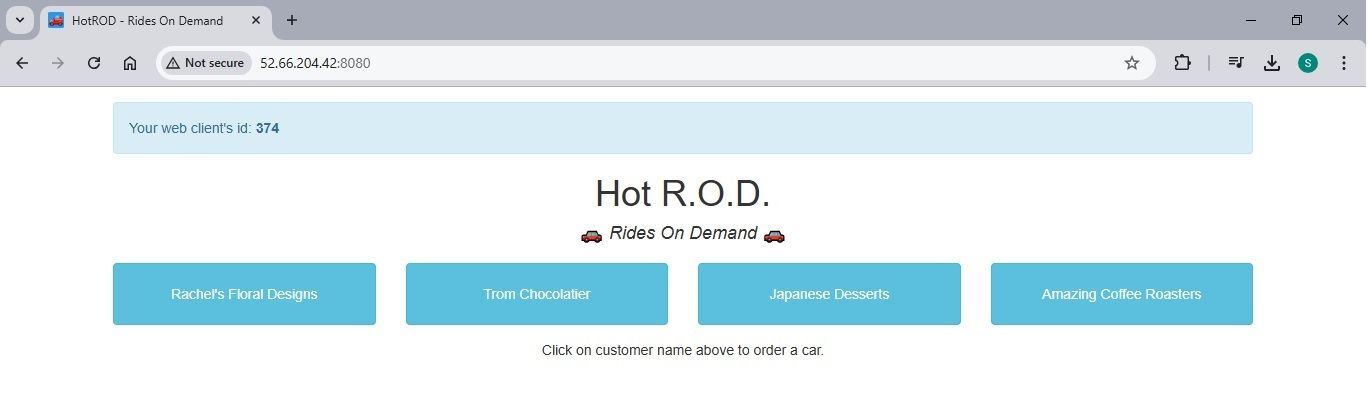
HotROD is a microservices application simulating a ride-hailing service, similar to Uber or Lyft. It consists of multiple services, such as ride management and driver management, making it an ideal example for demonstrating distributed tracing in a microservices architecture.
To run the HotROD application alongside Jaeger, use the following Docker command:
docker run --rm -it --link jaeger \
  -p8080-8083:8080-8083 \
  -e OTEL_EXPORTER_OTLP_ENDPOINT="http://jaeger:4318" \
  jaegertracing/example-hotrod:1.62.0 \
  all --otel-exporter=otlp
The above command will run the HotROD sample application in a Docker container, linking it to the Jaeger container. It will expose ports 8080 to 8083 on the host for accessing the HotROD services. The application is configured to send tracing data to Jaeger via the OpenTelemetry Protocol (OTLP) at the specified endpoint.
You can access the HotROD UI at http://localhost:8080
Once your application is instrumented, run a few requests to generate some traces.
Then, navigate to http://localhost:16686, where you can query traces, visualise the flow of requests, and see latency and dependency data.
Now, let’s guide you through the setup of OpenObserve using Docker for deployment. For a detailed setup guide, you can refer to the OpenObserve Quickstart Documentation.
OpenObserve provides a Docker image for easy deployment. To start using OpenObserve, run the following command:
docker run \
    --name openobserve \
    -v $PWD/data:/data \
    -e ZO_DATA_DIR="/data" \
    -p 5080:5080 \
    -e ZO_ROOT_USER_EMAIL="root@example.com" \
    -e ZO_ROOT_USER_PASSWORD="Complexpass#123" \
    public.ecr.aws/zinclabs/openobserve:latest
The command will start an OpenObserve Docker container named openobserve, with the following configurations:
You can access the OpenObserve UI at http://localhost:5080 to visualise and interact with your observability data.
log in with the following credentials
Run the following command to configure the HotROD sample app to send tracing data to OpenObserve (O2). Replace placeholders with the correct values from your OpenObserve setup.
docker run \
  --rm \
  --link <O2_CONTAINER_NAME> \
  --env OTEL_EXPORTER_OTLP_ENDPOINT=<O2_ENDPOINT> \
  --env OTEL_EXPORTER_OTLP_HEADERS="<Authorization=Basic <BASE64_ENCODED_CREDENTIALS>>" \
  -p 8080-8083:8080-8083 \
  jaegertracing/example-hotrod:latest \
  all
This command does the following:
By running this command, you'll be able to generate trace data from the HotROD application and send it to OpenObserve for visualisation and analysis.
You can find the HTTP endpoint and authorization details in the Data Sources section, under Traces (OpenTelemetry).
This is how command looks after replacing required fields
docker run \
  --rm \
  --link openobserve \
  --env OTEL_EXPORTER_OTLP_ENDPOINT=http://13.232.45.32:5080/api/default \
  --env OTEL_EXPORTER_OTLP_HEADERS="Authorization=Basic cm9vdEBleGFtcGxlLmNvbTpTMzVHMjhaMEkxVEdxYm9q" \
  -p 8080-8083:8080-8083 \
  jaegertracing/example-hotrod:latest \
  all
Replace
You can access the HotROD UI at http://localhost:8080 ,Once your application is instrumented, run a few requests to generate some traces.

Once your application is instrumented, generate some telemetry data by making requests to your services. You can then explore the data in the OpenObserve UI at http://localhost:8080.
| Challenge | Jaeger | OpenObserve (O2) |
|---|---|---|
| Scalability | Struggles with high traffic | Built for high scalability and performance |
| Unified Platform | Separate tools for logs and metrics | Combines metrics, logs, and traces into one platform |
| Querying | Basic querying options | Advanced querying capabilities for deeper insights |
| Cost Management | Higher storage and processing costs | Optimized for lower resource usage |
| User Experience | Traditional, complex interfaces | Modern, intuitive interface for easy navigation and analysis |
Jaeger is an excellent tool for getting started with distributed tracing and is widely adopted for microservices observability. However, as systems grow, Jaeger’s limitations in data handling and cross-function observability (metrics, logs, and traces) may become restrictive.
OpenObserve addresses these limitations by unifying metrics, logs, and traces in a single platform, making it a more comprehensive observability solution. With its scalability, enhanced query capabilities, and cost-effectiveness, OpenObserve empowers teams to monitor, troubleshoot, and optimise complex distributed systems more efficiently.
To see OpenObserve’s impact in action, read about Jidu's journey to achieving 100% tracing fidelity using OpenObserve. Their challenge with AJeger with Elasticsearch back end limited their ability to ingest traces and they were able to ingest only 10% or traces that their application generated (10 TB per day) and performance was bad for the money that was spent on the resources. After moving from Jaeger+Elasticsearch to OpenObserve they were able to increase trace ingestion to 100% (10 TB) offering higher performance on the same hardware and reduced storage cost as well. They eventually started ingesting 100 TB of traces per day in OpenObserve. Their team’s work offers valuable insights into overcoming the challenges of tracing at scale and ensuring trace fidelity. You can read the full case study here.
This case demonstrates how OpenObserve’s unified approach to observability enables improved trace fidelity and facilitates better troubleshooting, performance optimization, and insight gathering across distributed systems.
Sampath is a Developer Advocate at OpenObserve with a background in DevOps and Cloud, passionate about Observability and Open Source technologies