What Nobody Tells You About Running AI in Production
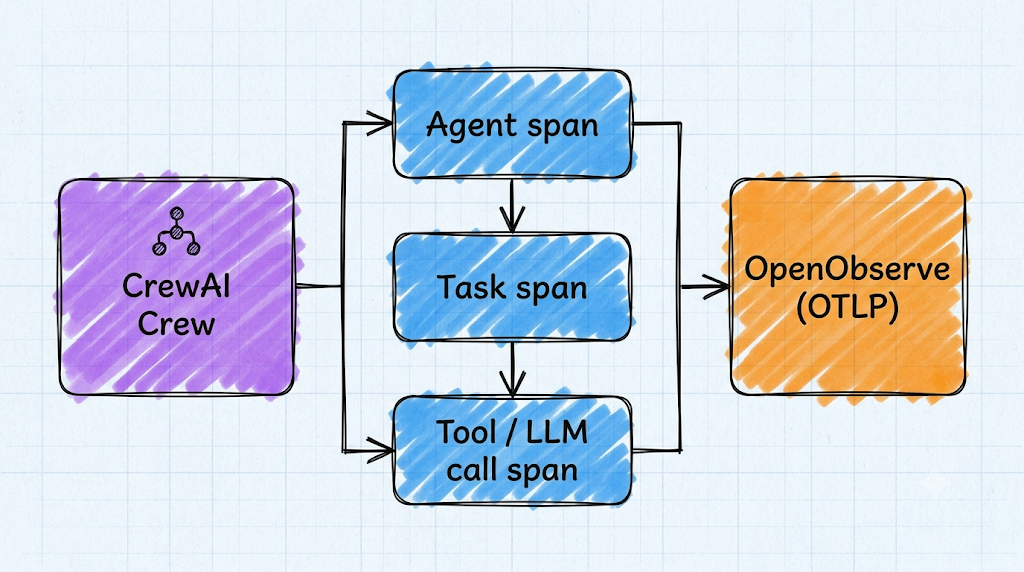
Add real observability to CrewAI: map Crew, Agent, and Task objects to OpenTelemetry spans, tell CrewAI's own anonymous telemetry apart from your own tracing, and send the full multi-agent trace to OpenObserve.
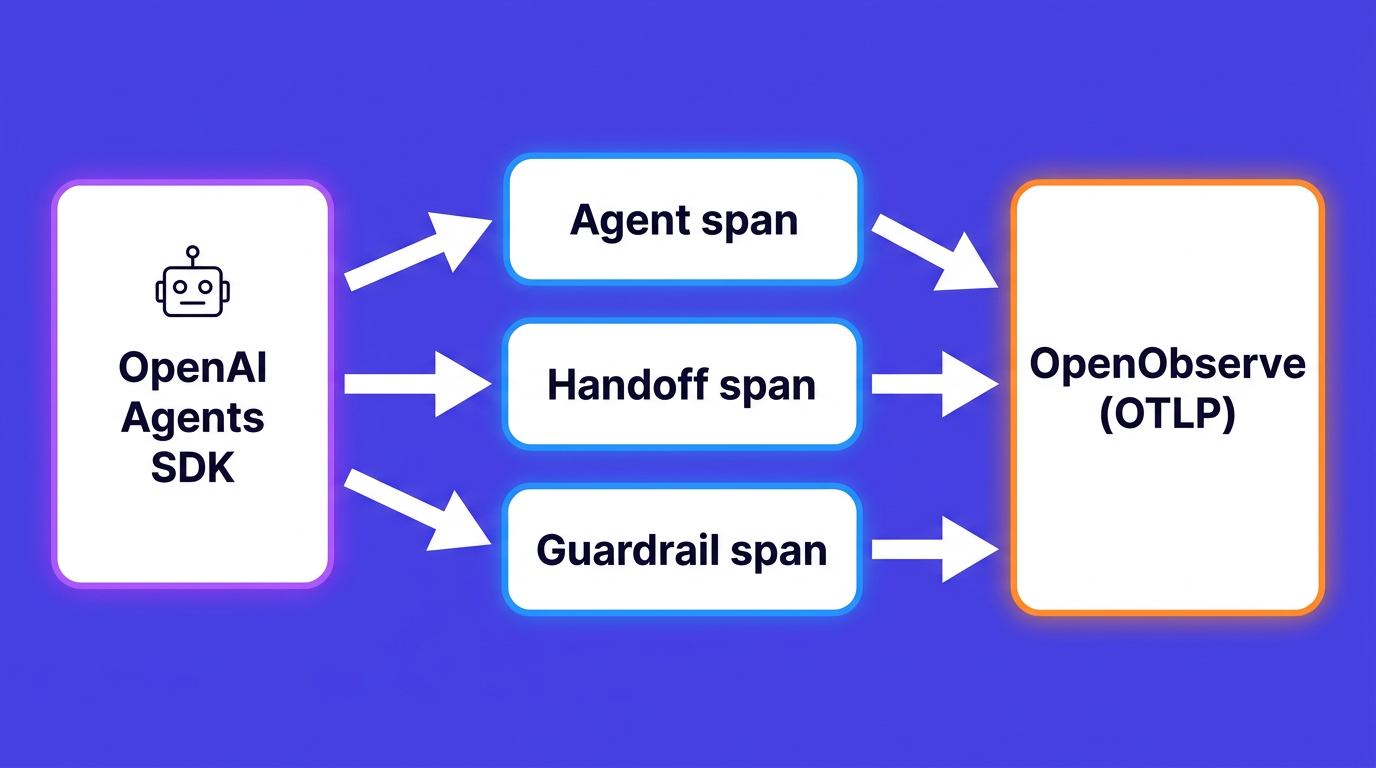
Trace the OpenAI Agents SDK with OpenTelemetry: map handoffs, guardrails, and agent spans to OTLP and send the full trace to OpenObserve, not OpenAI's backend.
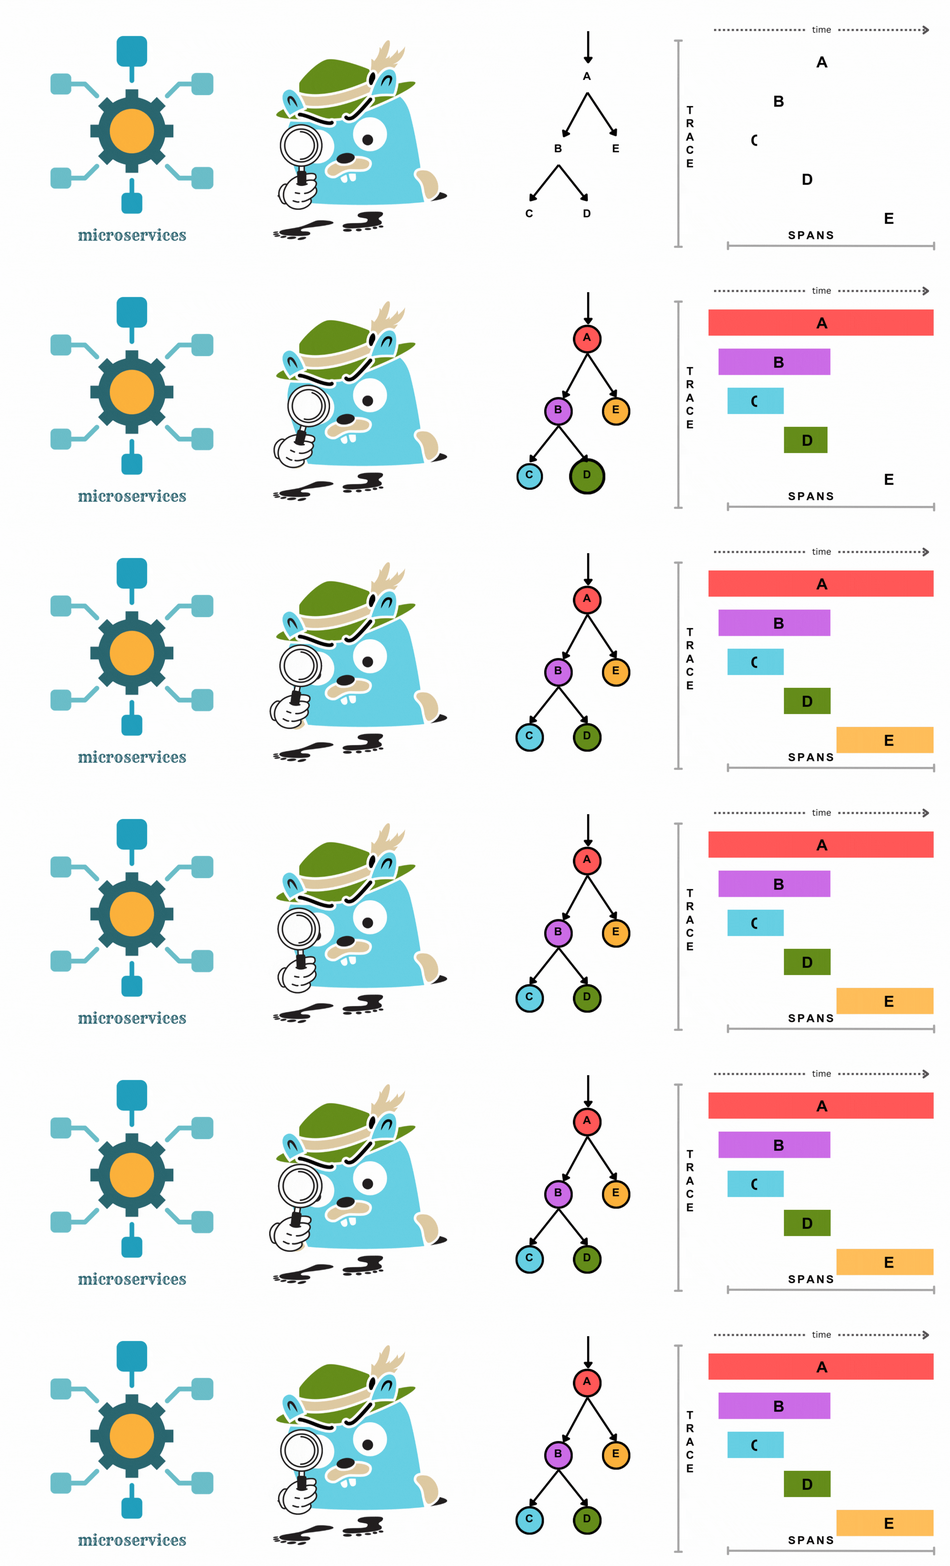
A practical guide to the best distributed tracing tools in 2026: OpenObserve, Jaeger, Grafana Tempo, Zipkin, and Honeycomb. Covers OTel compatibility, high-cardinality support, and deployment trade-offs.
A practical guide to the top 10 microservices monitoring tools in 2026: OpenObserve, Grafana LGTM, Datadog, Dynatrace, and Prometheus. Covers unified telemetry, cardinality handling, and cost trade-offs.
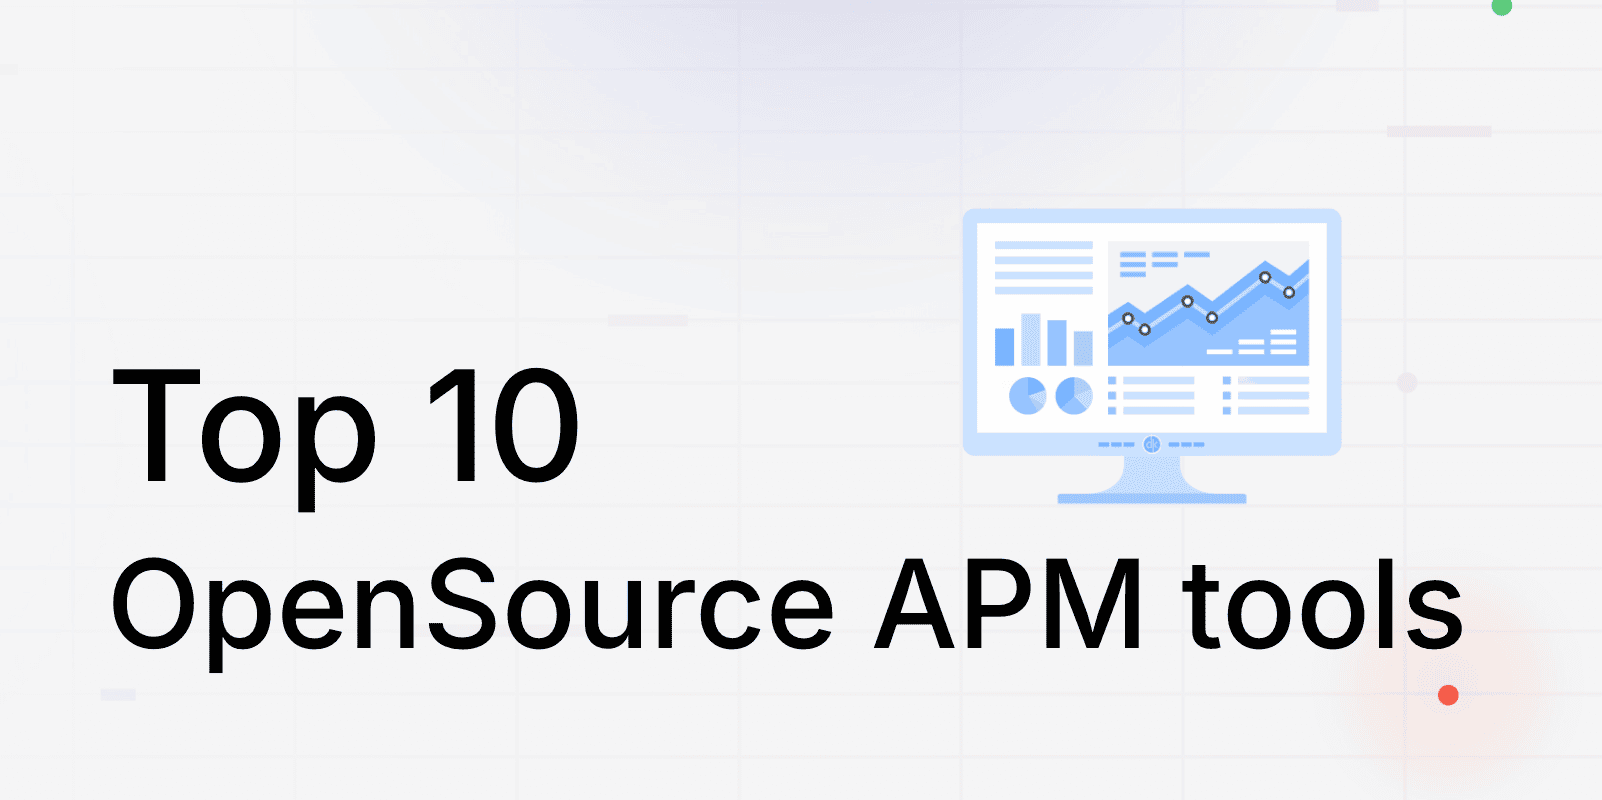
A comprehensive comparison of the top 10 open source APM tools in 2026: OpenObserve, SigNoz, Jaeger, Grafana Tempo, and Zipkin. Covers unified observability, OpenTelemetry support, storage efficiency, and self-hosted deployment options.
A practical guide to 15 essential SRE tools in 2026: OpenObserve, Datadog, PagerDuty, Prometheus, Jaeger, and LitmusChaos. Covers unified observability, alerting, incident management, SLO tracking, and chaos engineering.

Compare the best Lightstep alternatives following the March 2026 EOL. Covers OpenObserve, Jaeger, Grafana Tempo, Honeycomb, and Datadog APM with OpenTelemetry migration guides, cost comparisons, and high-cardinality tracing analysis.
Explore the top observability tools and platforms in 2026. Compare features, use cases, and alternatives to Datadog for logs, metrics, and traces in this complete guide.
Compare the top 10 open source observability tools in 2026: OpenObserve, Prometheus, Grafana, Jaeger, and Loki. Covers logs, metrics, traces, deployment options, and cost trade-offs.
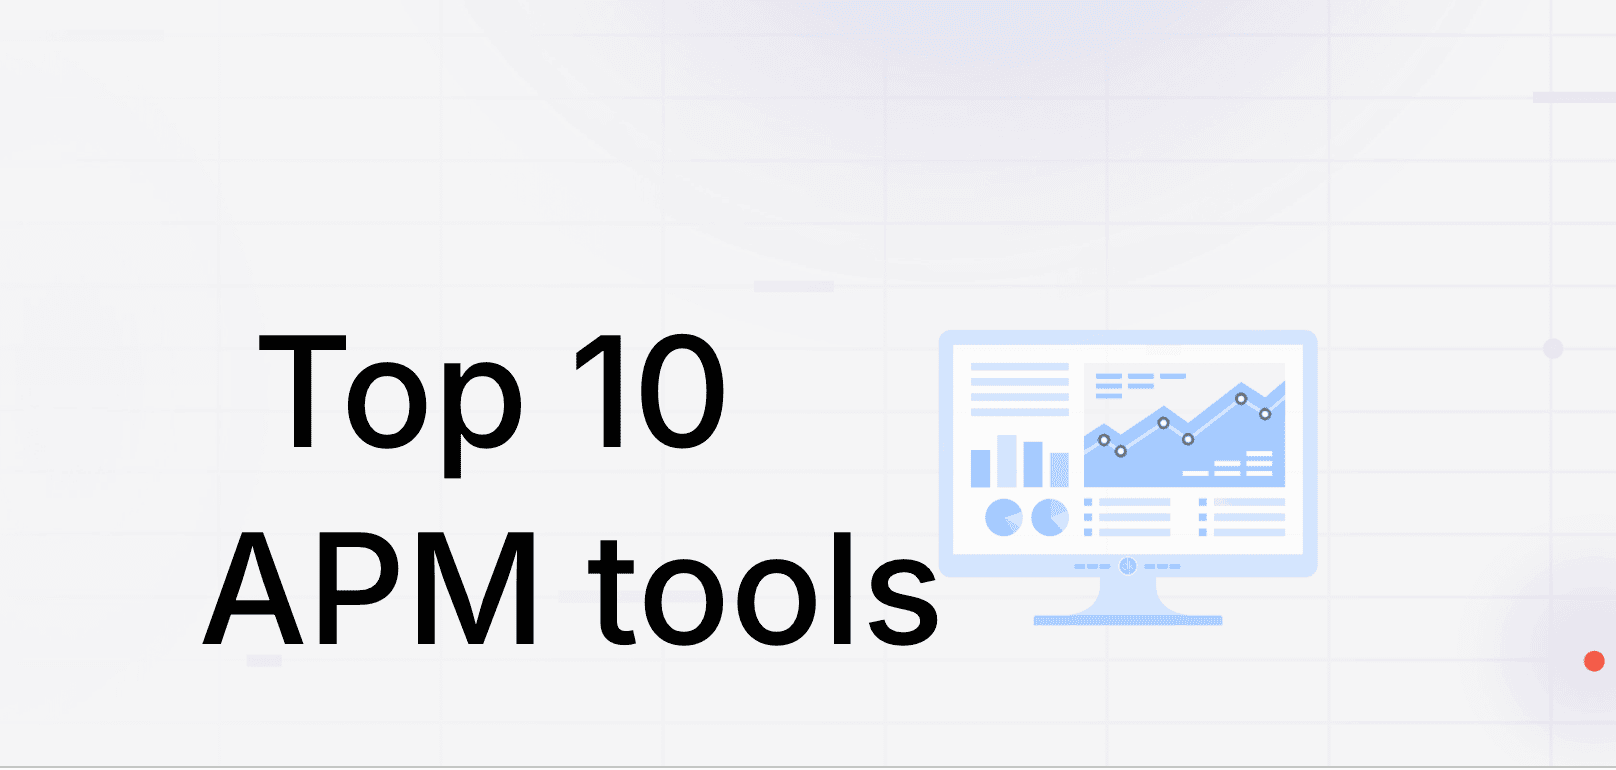
Compare the top 10 APM tools in 2026 — features, pricing, and use cases. OpenObserve delivers 60-90% cost savings with unified observability for logs, metrics, traces, and APM.
Compare the best Datadog alternatives in 2026 with real cost data, technical analysis, and migration guides. OpenObserve delivers 60-90% cost savings with unified observability for logs, metrics, and traces.
Looking for a Dynatrace alternative? Whether you're frustrated by DDU pricing complexity, vendor lock-in, or the steep learning curve, this guide covers the 10 best Dynatrace alternatives in 2026 from open-source platforms to enterprise SaaS tools.
Discover the top open-source Grafana alternatives in 2026. Compare features like dashboards, alerting, metrics, logs, traces, scalability, and ease of use for modern DevOps teams.
Explore top New Relic alternatives that offer better pricing, open-source flexibility, and full-stack observability for modern DevOps and SRE teams.
Trace, meter, and log Claude Agent SDK agents with OpenTelemetry: tool calls, MCP servers, extended thinking, and cost, all correlated in OpenObserve.
Stop tab-switching at 3AM. Wire trace_id into logs and exemplars into metrics so you can pivot from alert to root cause in seconds, not hours.
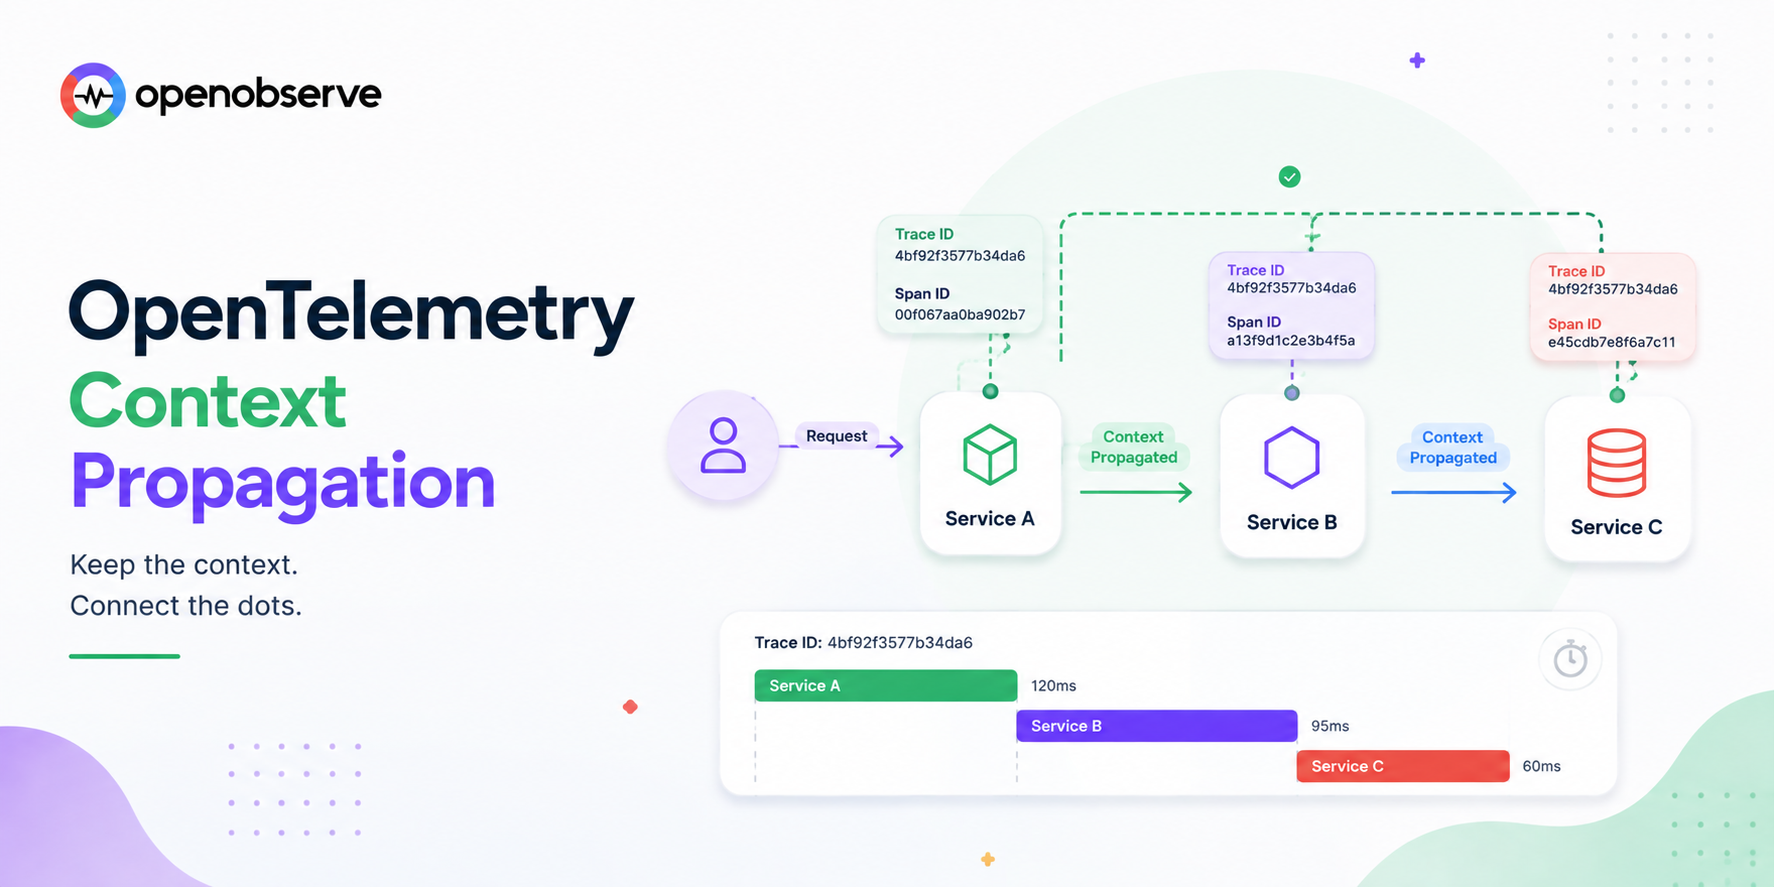
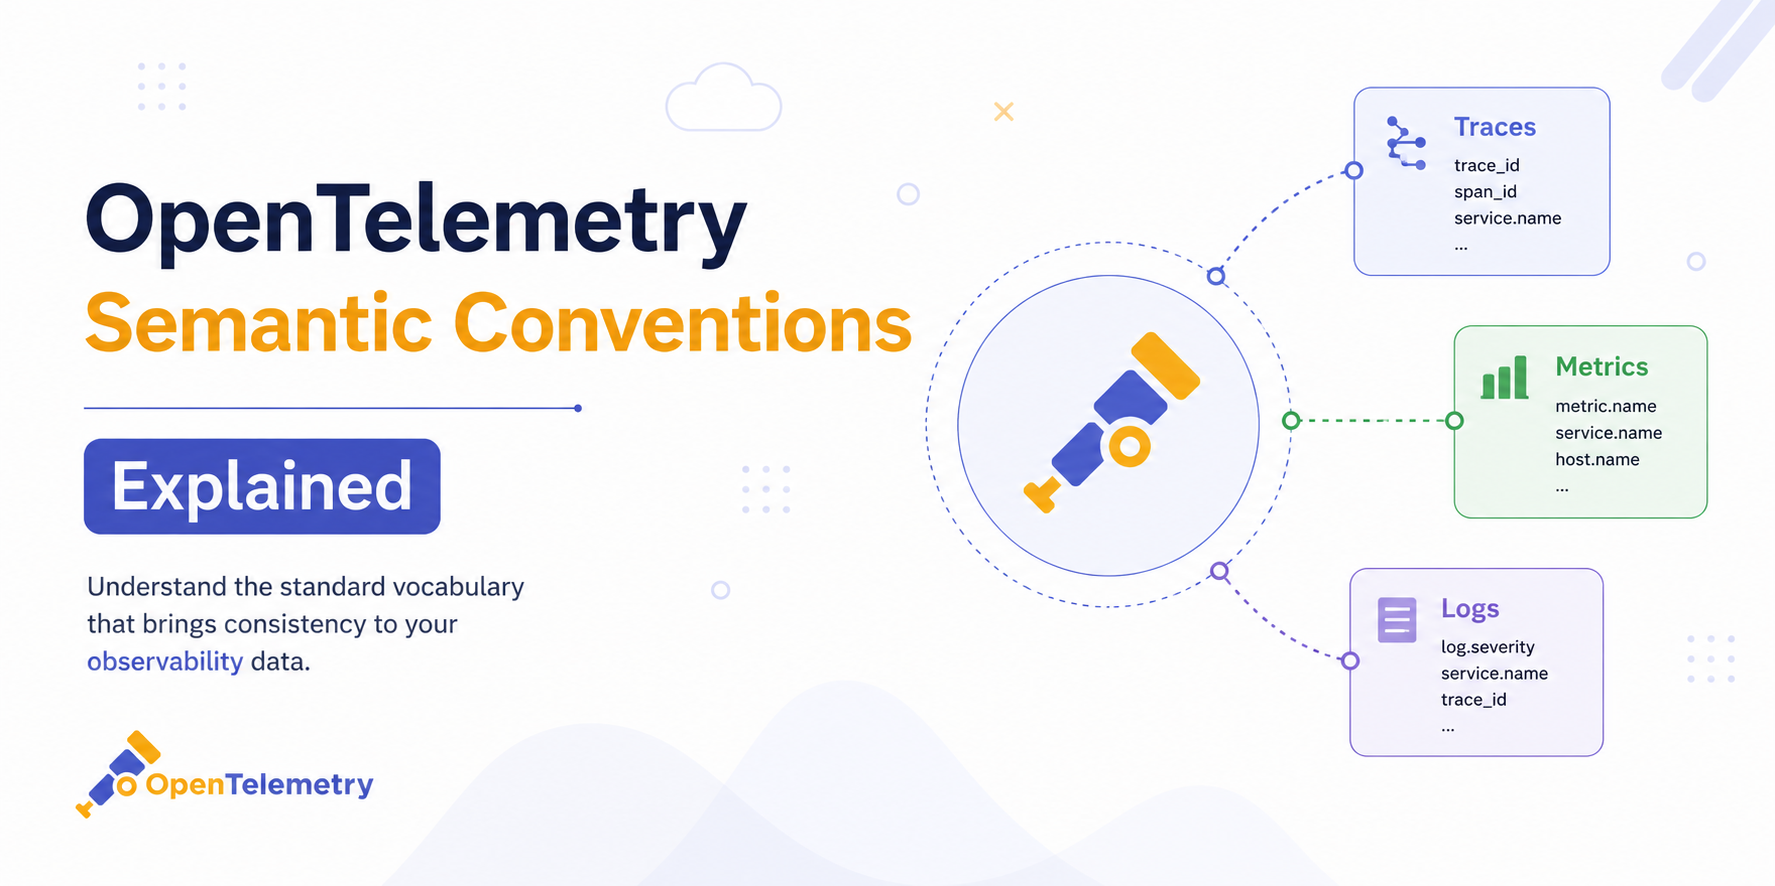
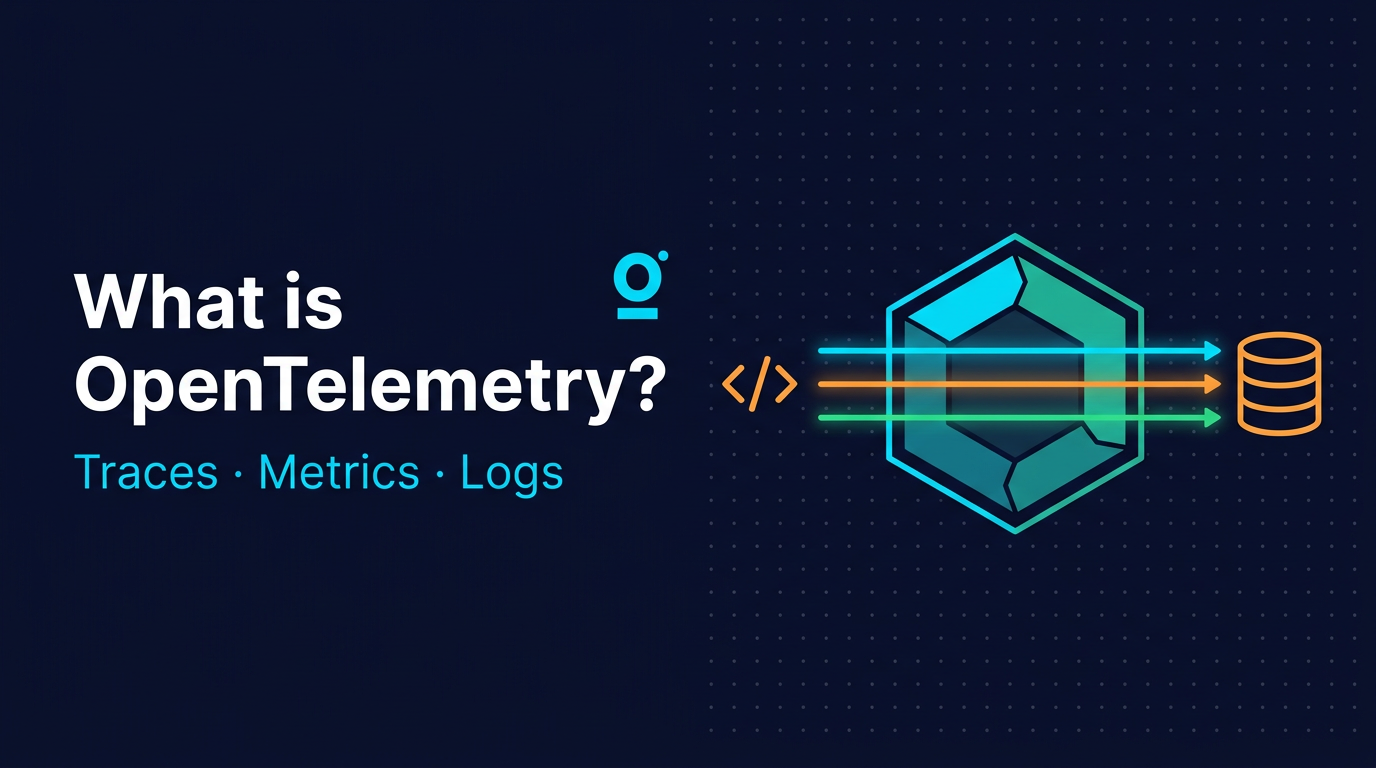
A complete guide to OpenTelemetry: what it is, how the Collector and OTLP work, and how to instrument your first service.
Learn how to add distributed tracing to LangChain and LlamaIndex apps using OpenLLMetry and the OpenTelemetry SDK, with traces flowing into OpenObserve.
Learn how incident correlation transforms observability by connecting logs, metrics, traces, and alerts into actionable insights. Discover why modern engineering teams rely on correlated telemetry to reduce MTTR and eliminate blind spots in distributed systems.
Learn how to use OpenObserve Insights for interactive log and trace analysis. Identify root causes in 60 seconds with dimension analysis. Real examples, step-by-step guides, and troubleshooting tips.
Discover how full-stack observability helps teams correlate telemetry across systems to cut MTTR, reduce data costs, and improve performance.