Getting Started with OpenObserve
Explore latest insights and updates
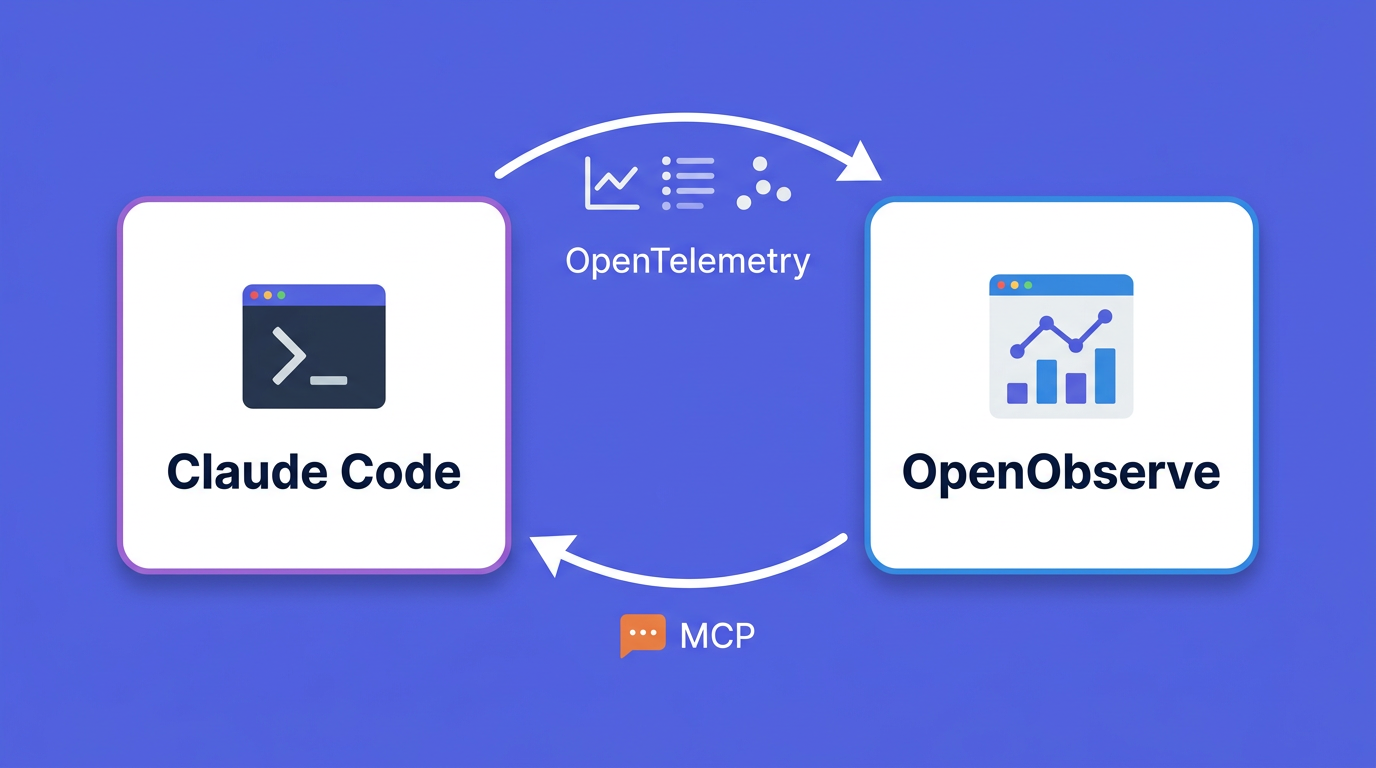
Instrument Claude Code with OpenTelemetry, ship usage and cost data to OpenObserve, then query it back from Claude Code via the OpenObserve MCP server.
Learn how to redact PII from LLM telemetry using OpenObserve's SDR, VRL pipelines, and OTel Collector - keeping traces debuggable while staying GDPR, HIPAA, and CCPA compliant.
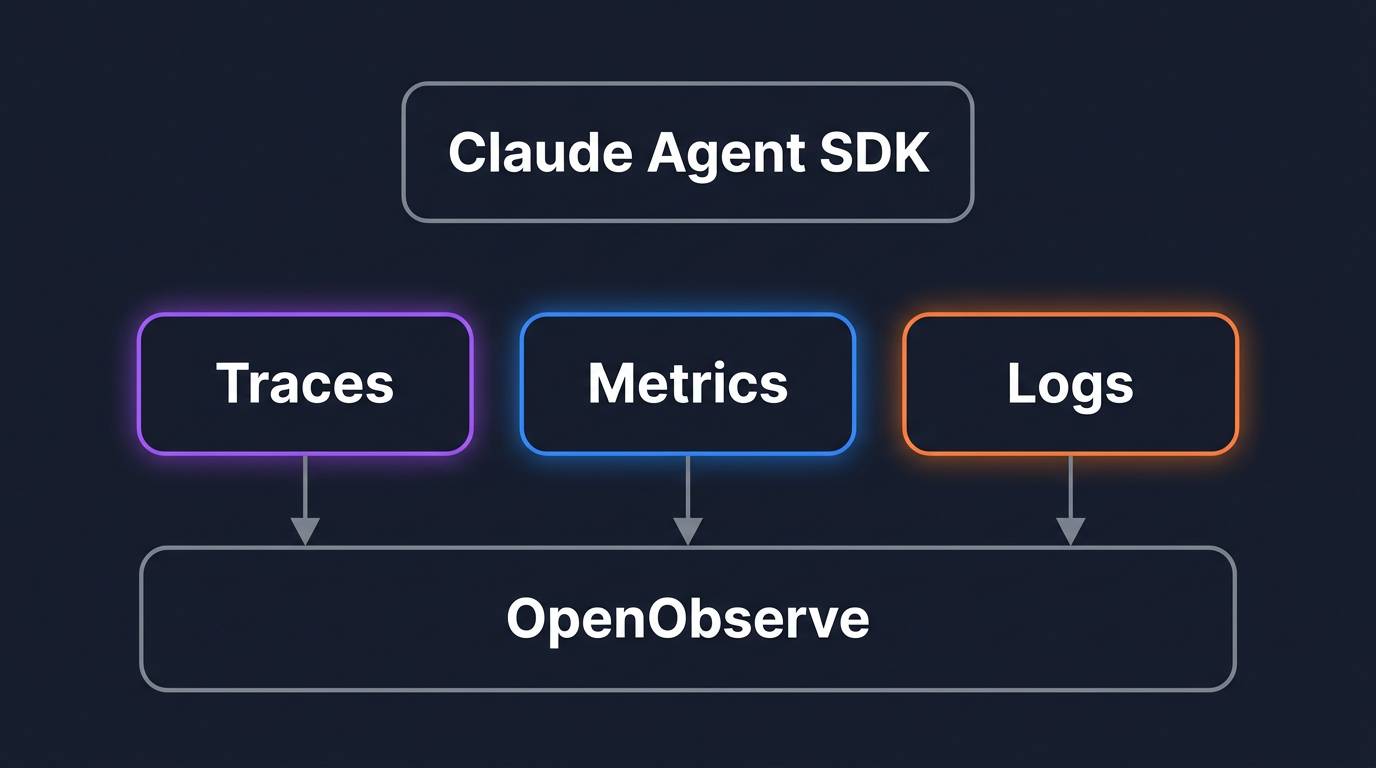
Trace, meter, and log Claude Agent SDK agents with OpenTelemetry: tool calls, MCP servers, extended thinking, and cost, all correlated in OpenObserve.
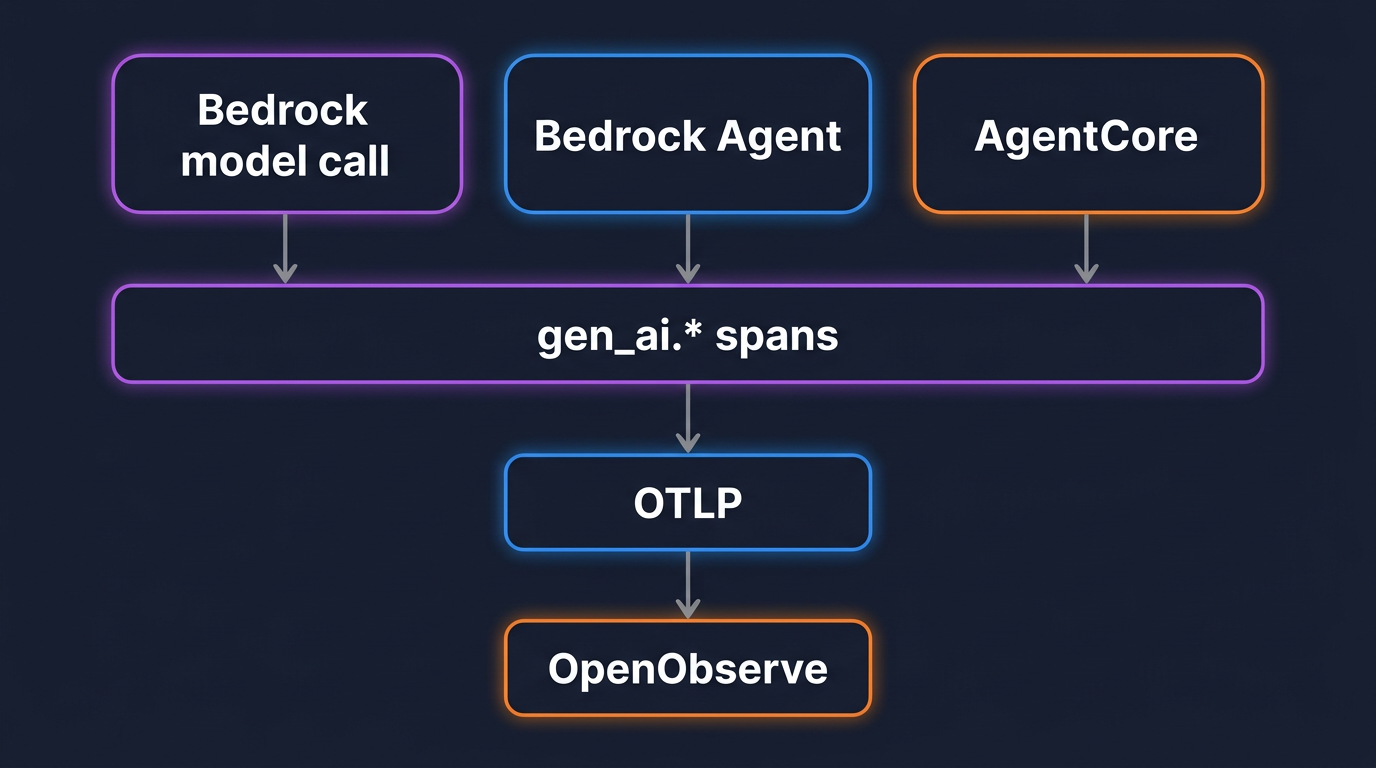
Trace Amazon Bedrock model calls, Bedrock Agents, and AgentCore with OpenTelemetry's gen_ai.* conventions (v1.41), then track token cost in dollars in OpenObserve.
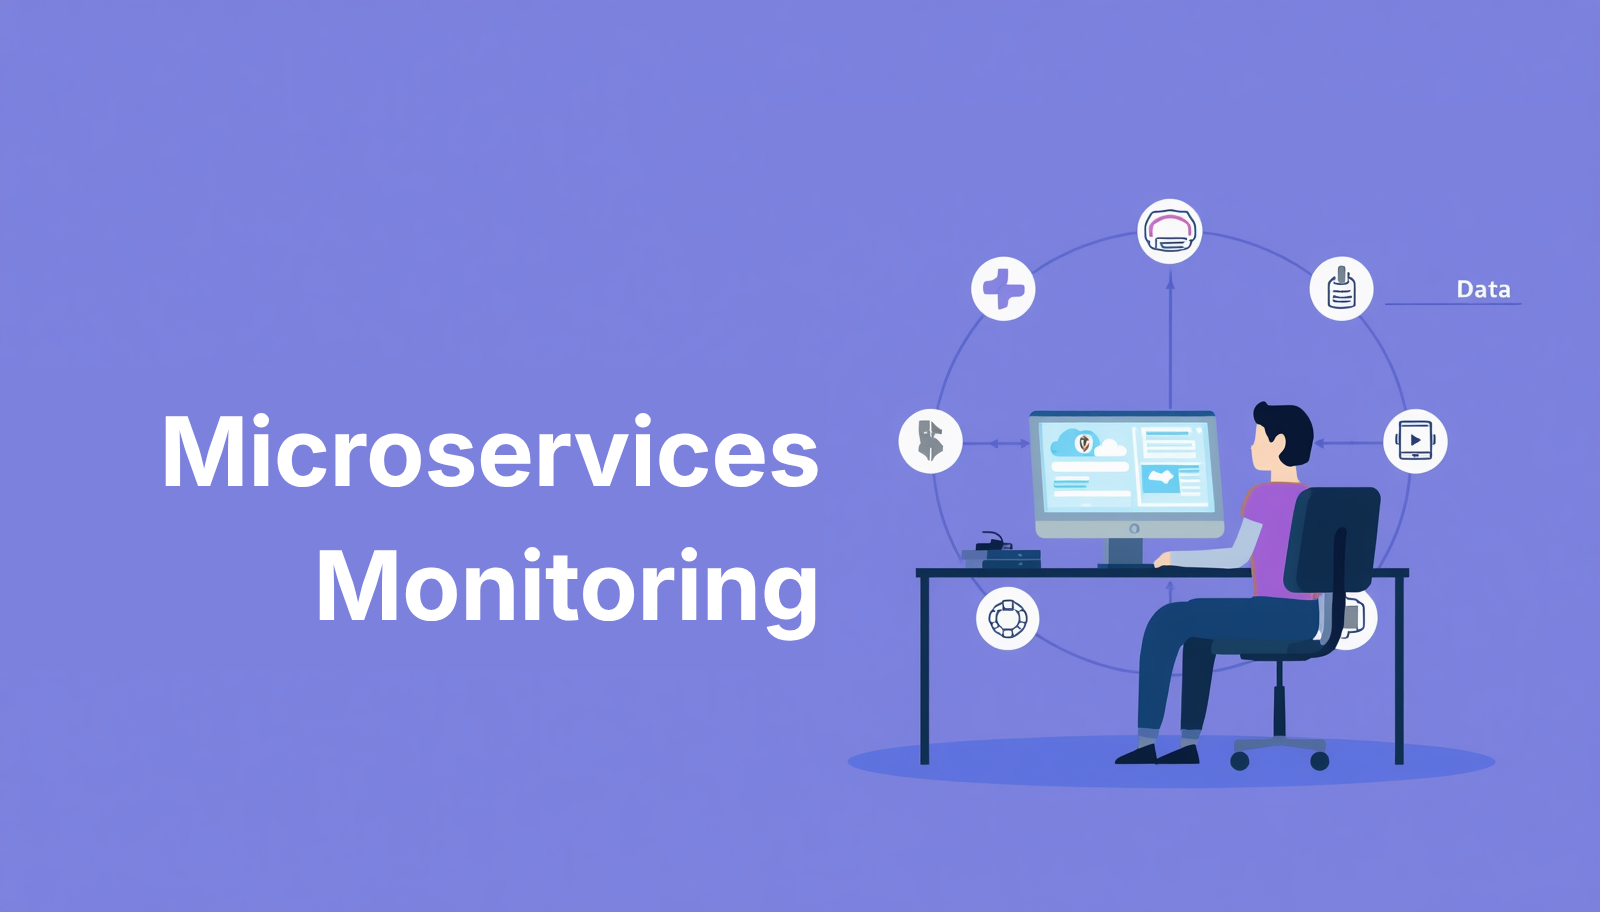
Learn what microservices monitoring is, the 3 pillars of observability, and why OpenObserve is the best open-source tool for monitoring microservices in 2026. 140x lower storage costs, unified logs, metrics, and traces.
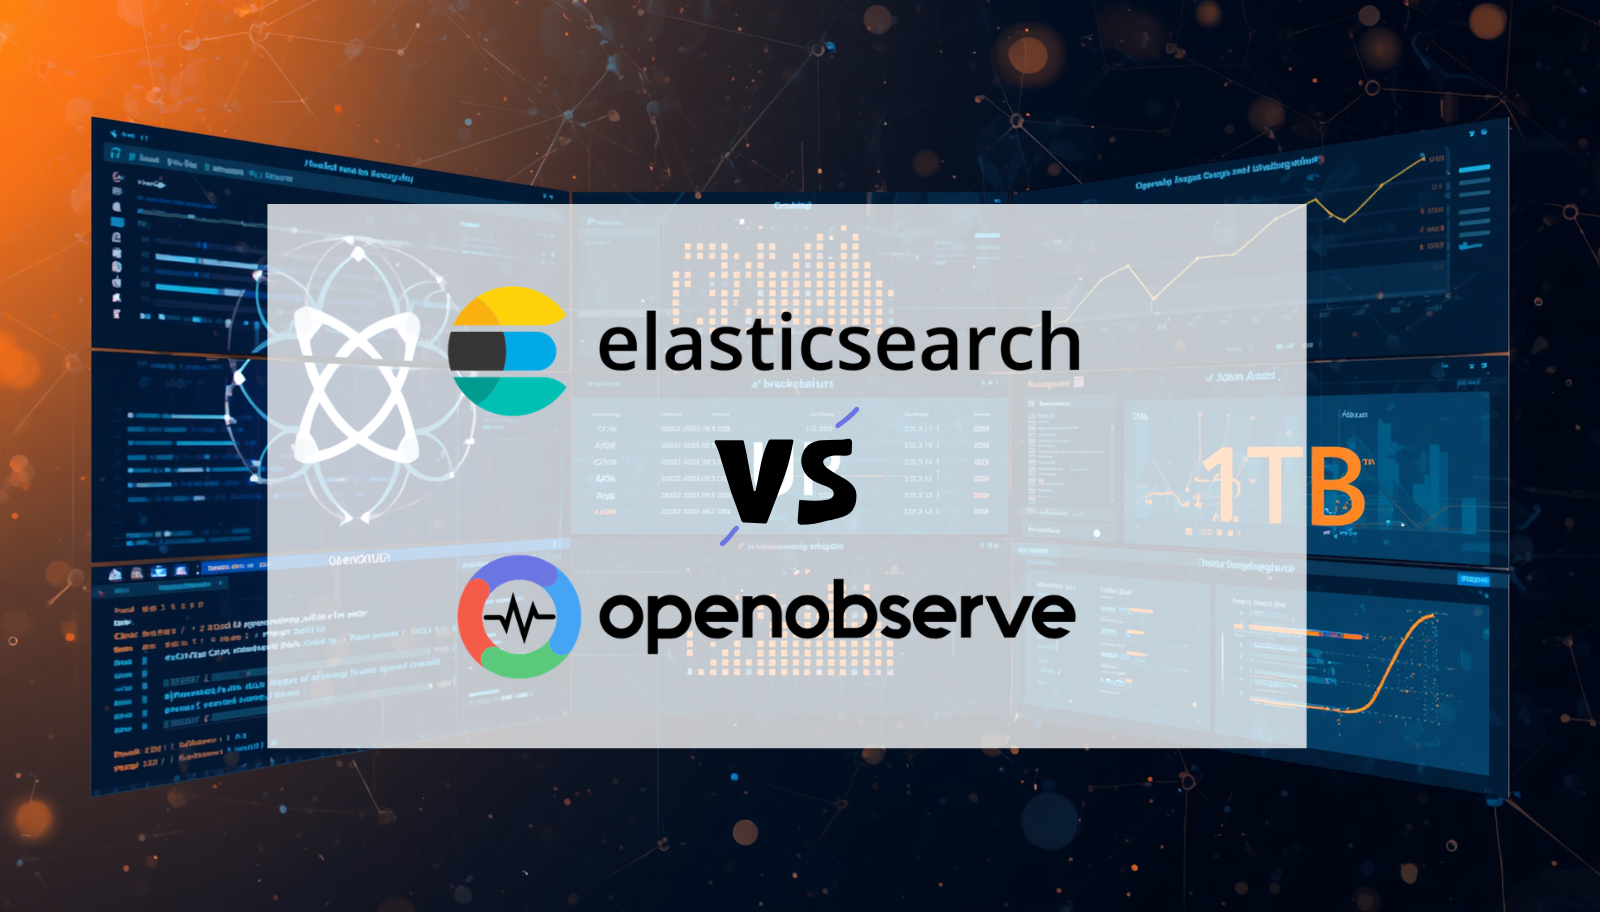
We streamed 1.1 TB of Kubernetes-format log data to both Elasticsearch and OpenObserve simultaneously on identical AWS hardware. A detailed performance benchmarking and comparison of storage, CPU, RAM, and query performance.
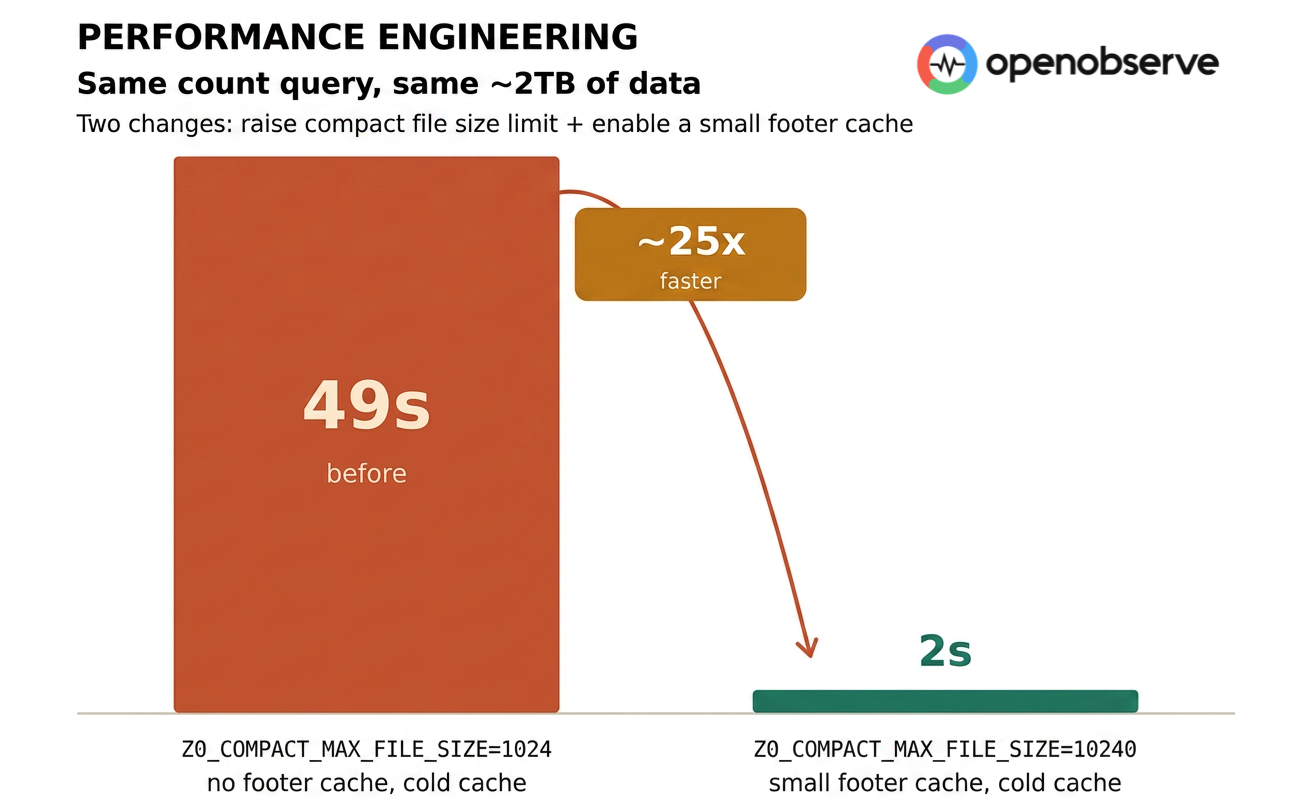
Same ~2TB of data, same count query, same querier config - two parameter changes took a Tantivy query from 49 seconds to 2 seconds. Learn how raising compact file size and enabling footer cache drove a 25× speedup by slashing S3 requests from 10,000+ to ~600.
OpenObserve now supports Terraform for infrastructure-as-code deployments, Bring Your Own Bucket for full control over your data storage, and ships targeted UX improvements across the service catalog, traces view, and log correlation.
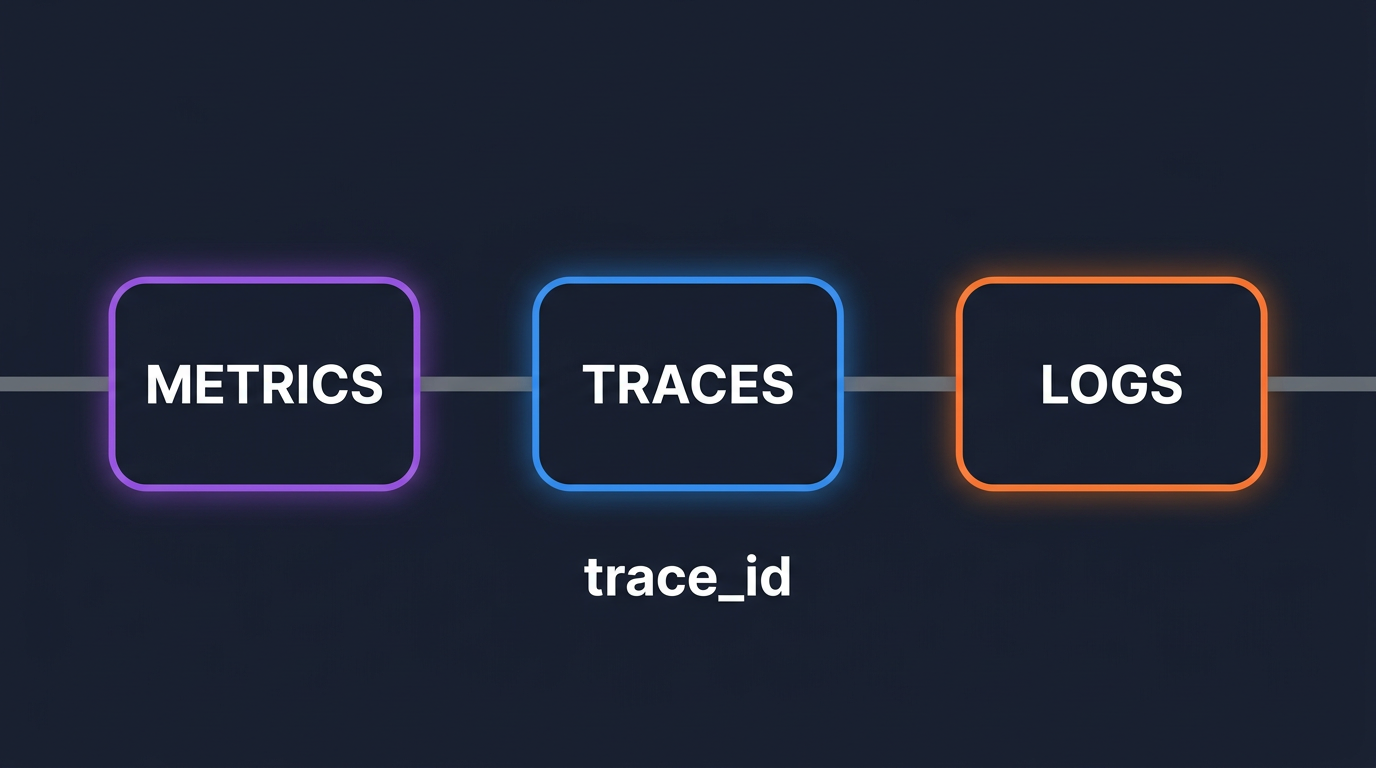
Stop tab-switching at 3AM. Wire trace_id into logs and exemplars into metrics so you can pivot from alert to root cause in seconds, not hours.
Learn how to use OpenObserve's RUM source map feature to transform cryptic minified stack traces into readable, debuggable code with original filenames, line numbers, and function names. Covers setup, CI/CD integration, and troubleshooting.
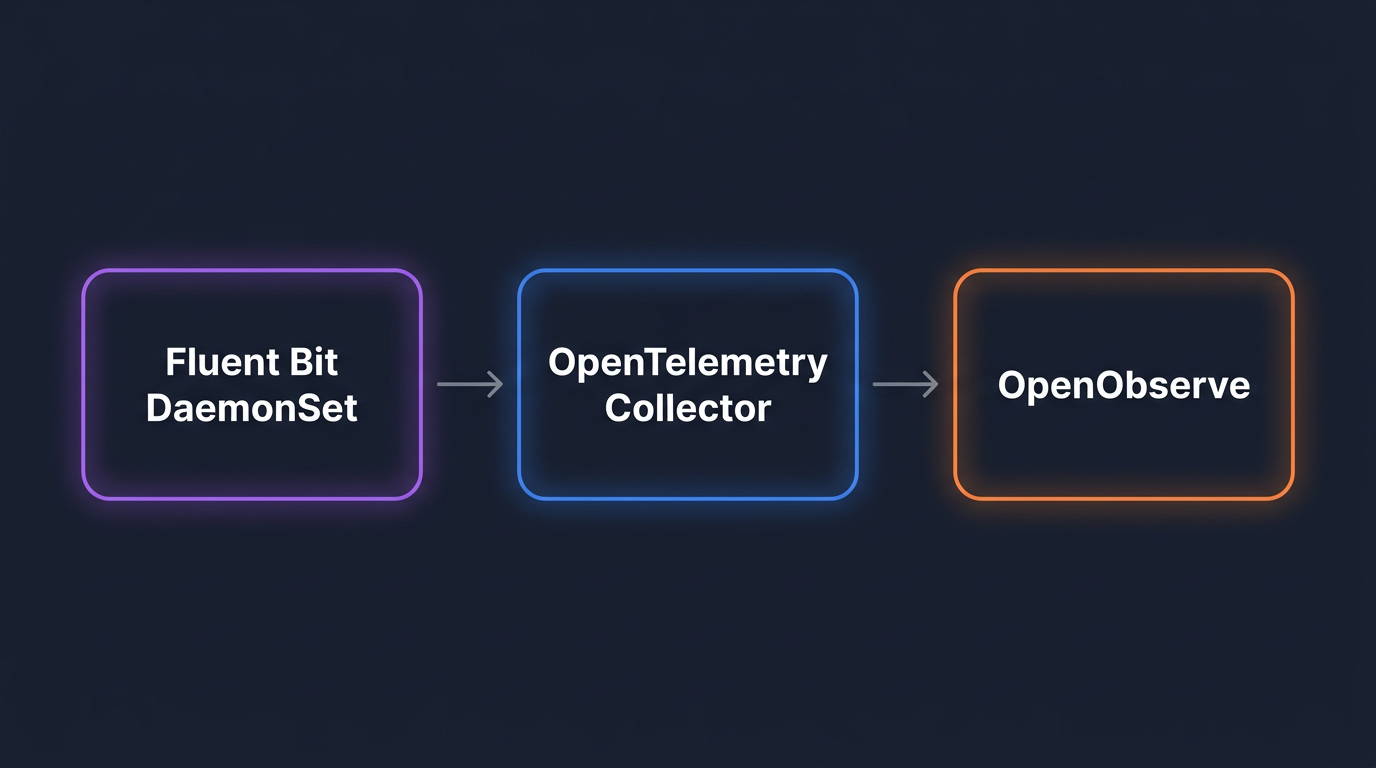
A working pipeline for monitoring Kubernetes logs at scale: the openobserve-collector Helm chart for the fast path, or Fluent Bit + OpenTelemetry Collector for full control. Helm configs, multi-cluster routing, retention math.
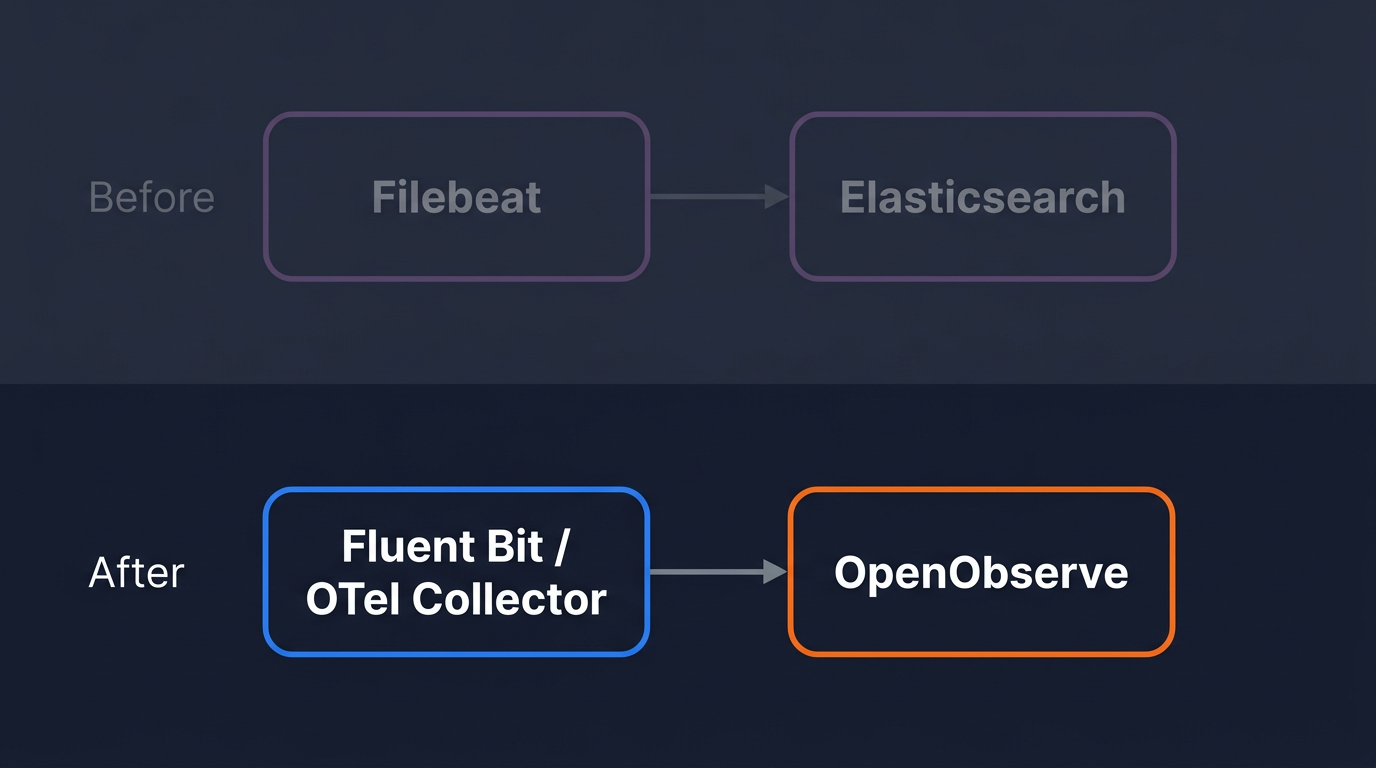
Elasticsearch was built for search, not logs. Learn how to migrate your ELK log pipeline to OpenObserve using OTel Collector or Fluent Bit.
A practical on-call runbook template built for SREs and on-call engineers. Includes a 5-phase response framework, first-5-minutes checklist, and AI-assisted debugging with OpenObserve MCP.
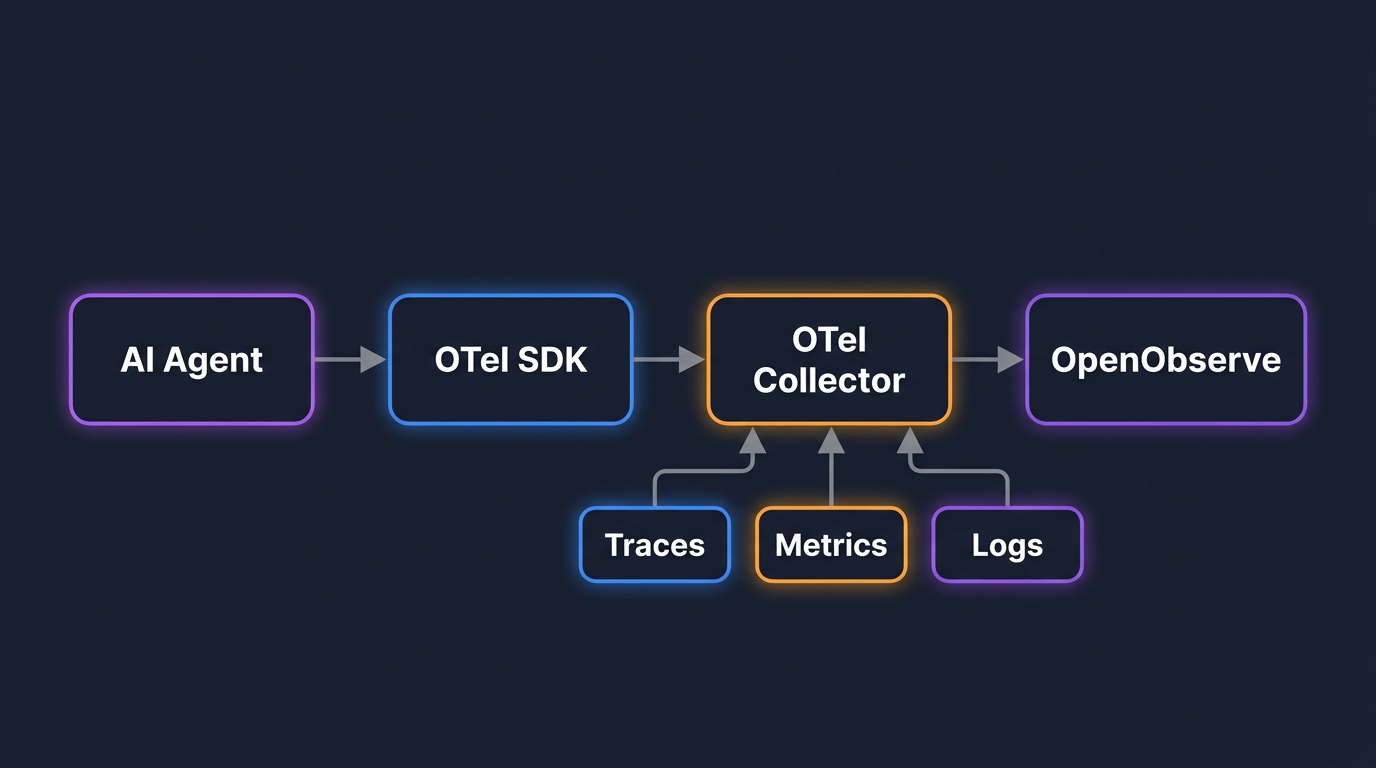
How to make AI agents observable in production: OTel instrumentation, telemetry backends, cost tracking, and trace analysis.
How to monitor n8n workflows with Prometheus metrics and OpenTelemetry tracing using OpenObserve. Covers self-hosted n8n and instrumenting services that call n8n webhooks.
A comprehensive list and comparison of observability backends that support OpenTelemetry and OTLP, covering open-source, commercial, and cloud-native options.
OpenObserve raises $10M Series A to launch Observability 3.0. Discover our AI-native platform featuring an autonomous AI SRE, LLM observability, and anomaly detection.
DevZero cut observability spend 4x after migrating from Datadog to OpenObserve in under an hour. See how predictable pricing replaced 15-20% bill swings.
Learn what MCP servers are available for observability and how to connect AI assistants to logs, metrics, and traces. Includes platform comparison, real use cases, and a 2-minute setup guide.
Datadog bills surprising you? OpenObserve is a free, open source observability platform replacing Datadog for logs, metrics, traces, dashboards, alerts, and RUM with 60–98% lower costs.
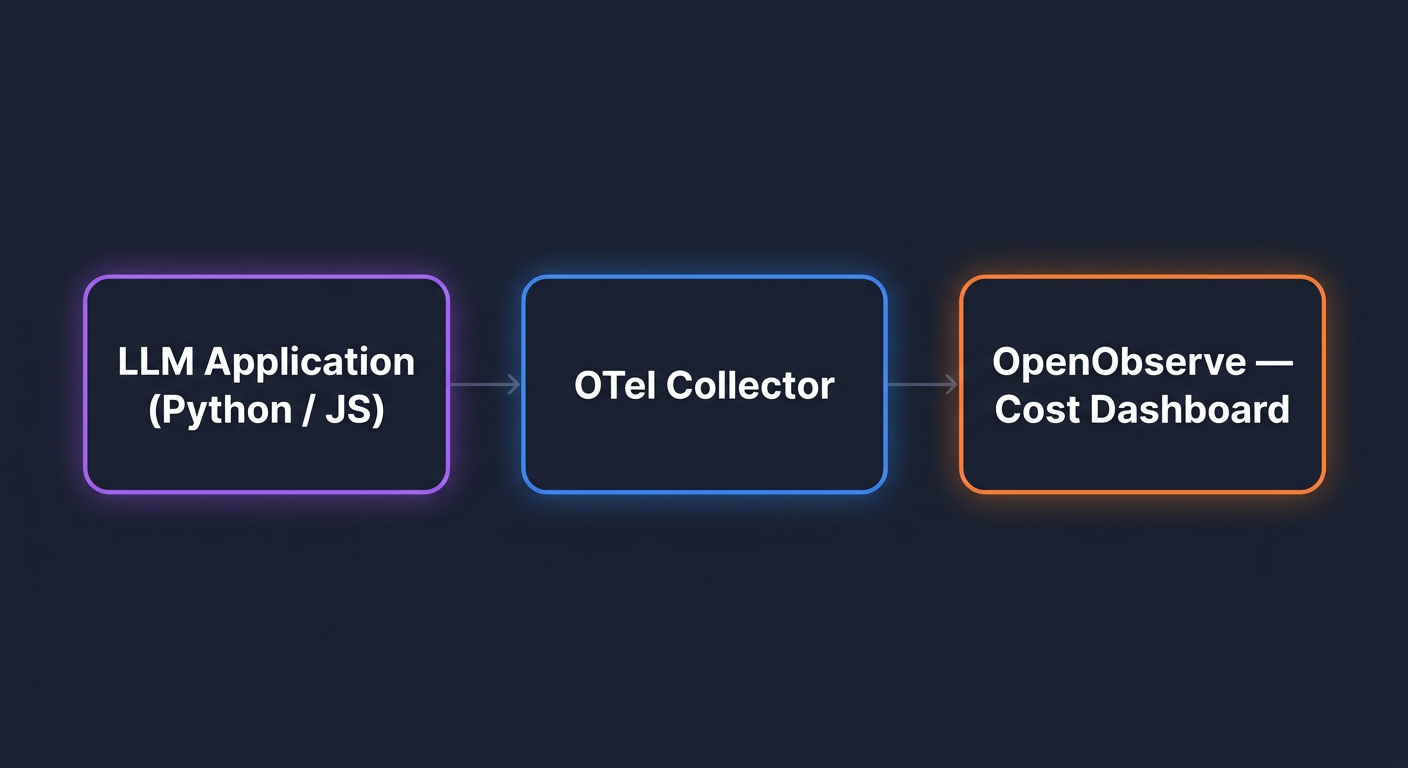
A practical, code-first guide to instrumenting OpenAI with OpenTelemetry. Capture token usage, attribute costs by user and feature, build a cost dashboard, and alert on anomalies in OpenObserve.
AI Observability by OpenObserve
OpenTelemetry-native observability for agents and LLMs.