What Nobody Tells You About Running AI in Production
Explore latest insights and updates
Top 10 open source monitoring tools explained. Learn what they are, why they matter, and how to choose to get the most from your observability strategy.
Compare the top 10 open source observability tools in 2026: OpenObserve, Prometheus, Grafana, Jaeger, and Loki. Covers logs, metrics, traces, deployment options, and cost trade-offs.
Compare the top 10 APM tools in 2026 — features, pricing, and use cases. OpenObserve delivers 60-90% cost savings with unified observability for logs, metrics, traces, and APM.
Compare the top 10 AIOps platforms in 2026 — features, pricing, and use cases for autonomous operations, alert correlation, root cause analysis, and intelligent incident response.
Compare the best Datadog alternatives in 2026 with real cost data, technical analysis, and migration guides. OpenObserve delivers 60-90% cost savings with unified observability for logs, metrics, and traces.
Discover the top open-source Grafana alternatives in 2026. Compare features like dashboards, alerting, metrics, logs, traces, scalability, and ease of use for modern DevOps teams.
Compare the top 10 Kubernetes monitoring tools in 2026, including OpenObserve, Prometheus, Datadog, and more. Features, cost, and use cases for DevOps and SRE teams.
Looking for a Dynatrace alternative? Whether you're frustrated by DDU pricing complexity, vendor lock-in, or the steep learning curve, this guide covers the 10 best Dynatrace alternatives in 2026 from open-source platforms to enterprise SaaS tools.
A comprehensive comparison of the top 10 log monitoring tools in 2026 highlighting their strengths, trade-offs, and use-cases.
Explore top New Relic alternatives that offer better pricing, open-source flexibility, and full-stack observability for modern DevOps and SRE teams.
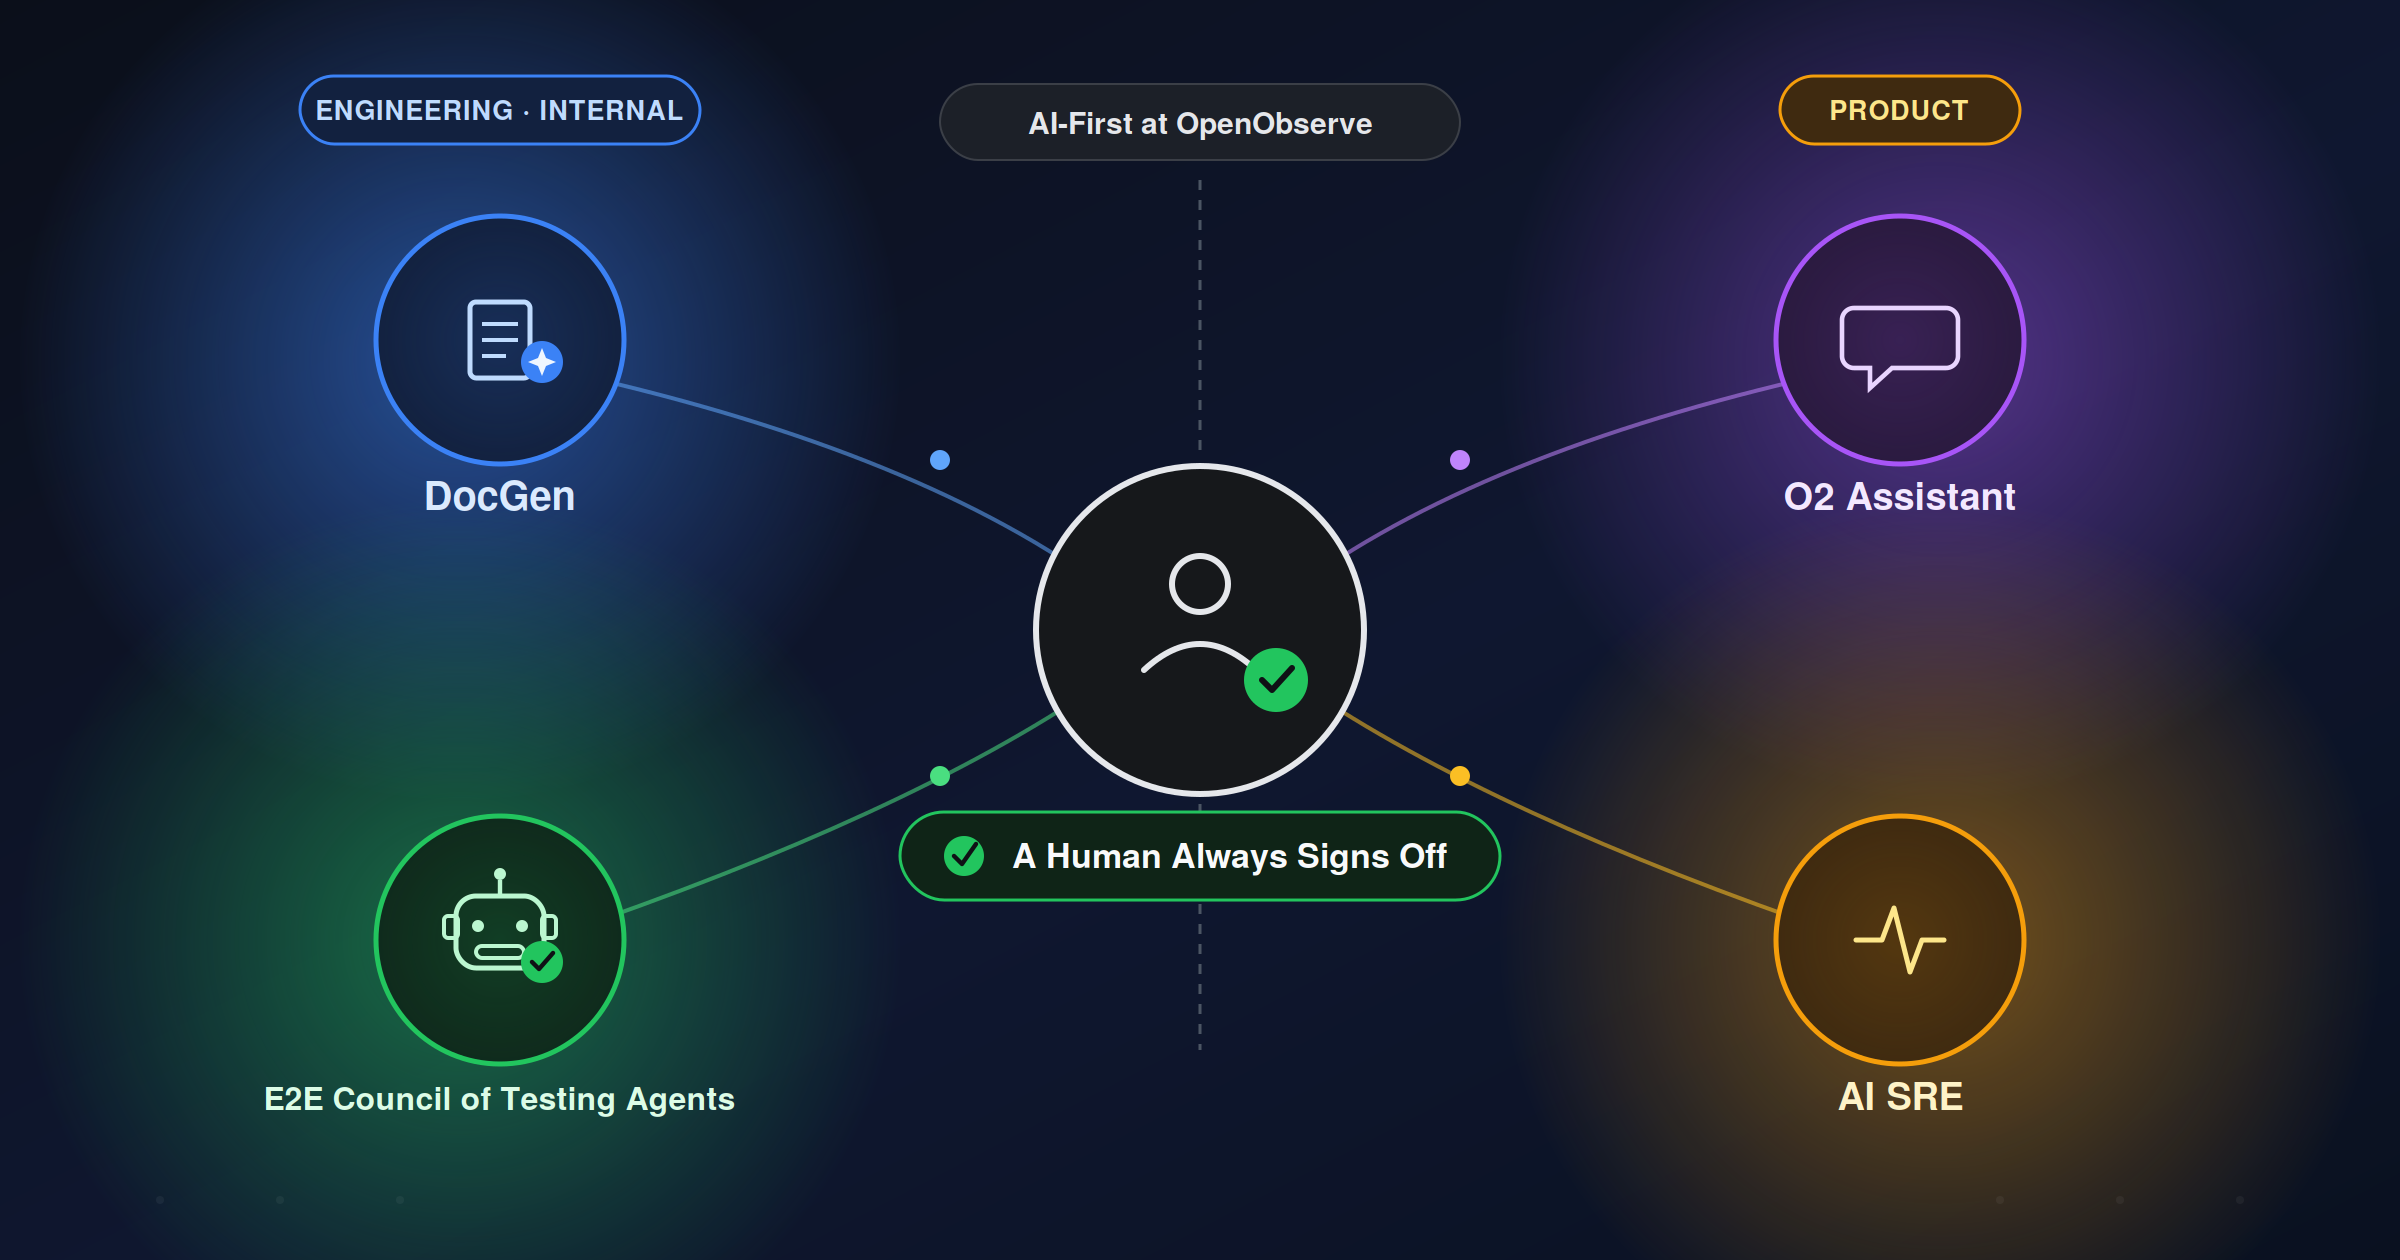
"AI-first" is easy to say and hard to prove. At OpenObserve we ship two AI features to users - O2 Assistant and the AI SRE - and run our own engineering shop the same way, with DocGen writing our docs and the Council of Agents writing and healing our end-to-end tests. This is the story of moving both out of "a human runs this locally" and into CI, where they now fire on their own: giving agents a browser, an ingestion API, and a real running instance so they can build, seed, click, and verify the tedious work instead of asking a person to grind through it.
A comprehensive comparison of the best log analysis tools in 2026, covering search, pattern detection, anomaly detection, and pipeline capabilities for engineering and SRE teams.
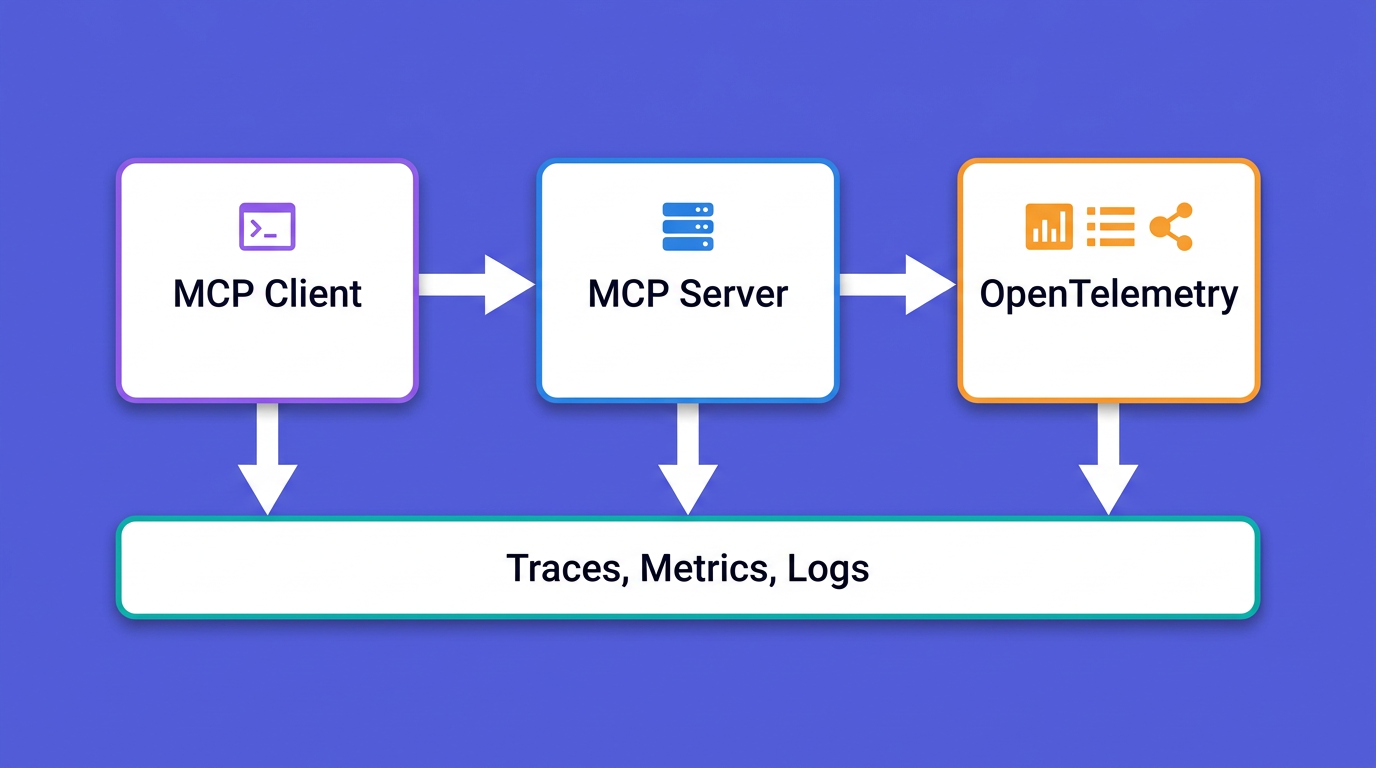
A producer-side guide to instrumenting your own MCP server with OpenTelemetry: tracing tools/call, propagating context via _meta, and deriving RED metrics.
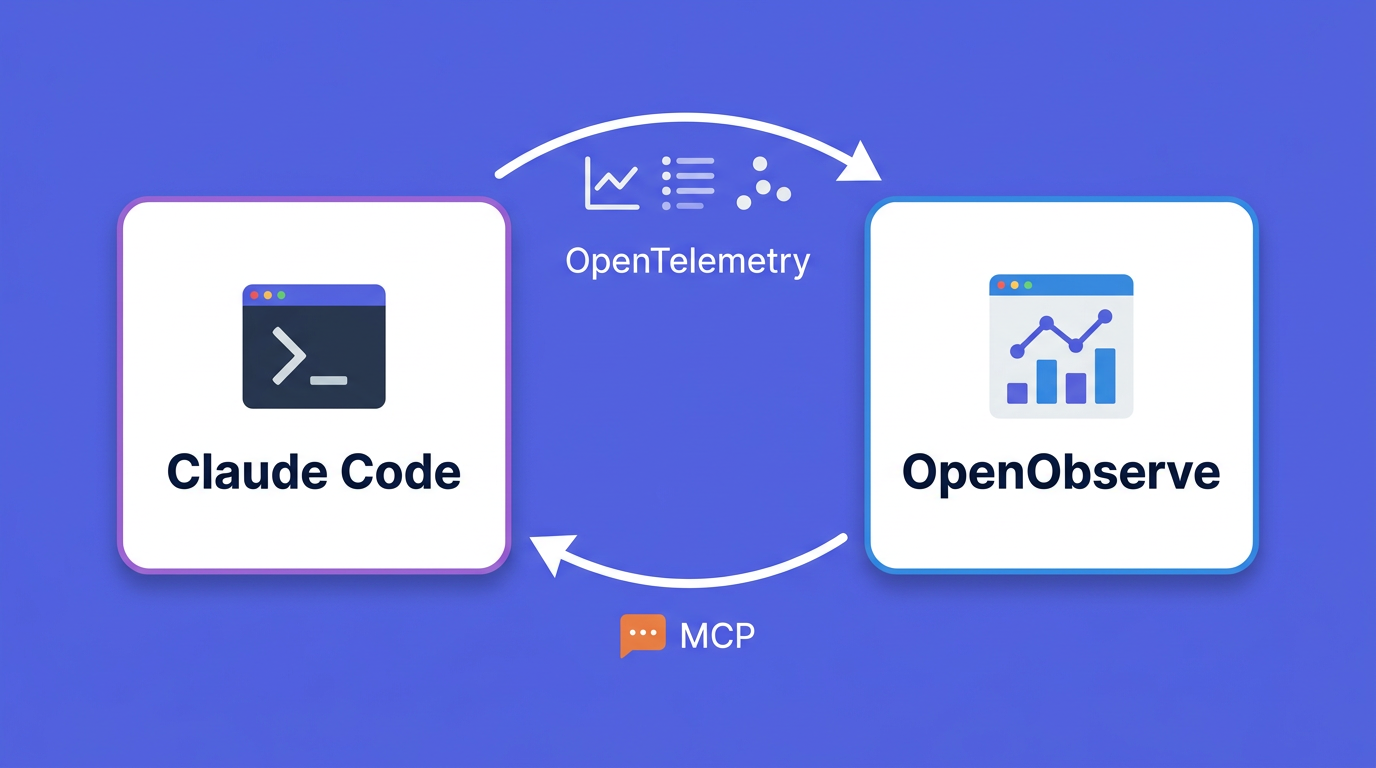
Instrument Claude Code with OpenTelemetry, ship usage and cost data to OpenObserve, then query it back from Claude Code via the OpenObserve MCP server.
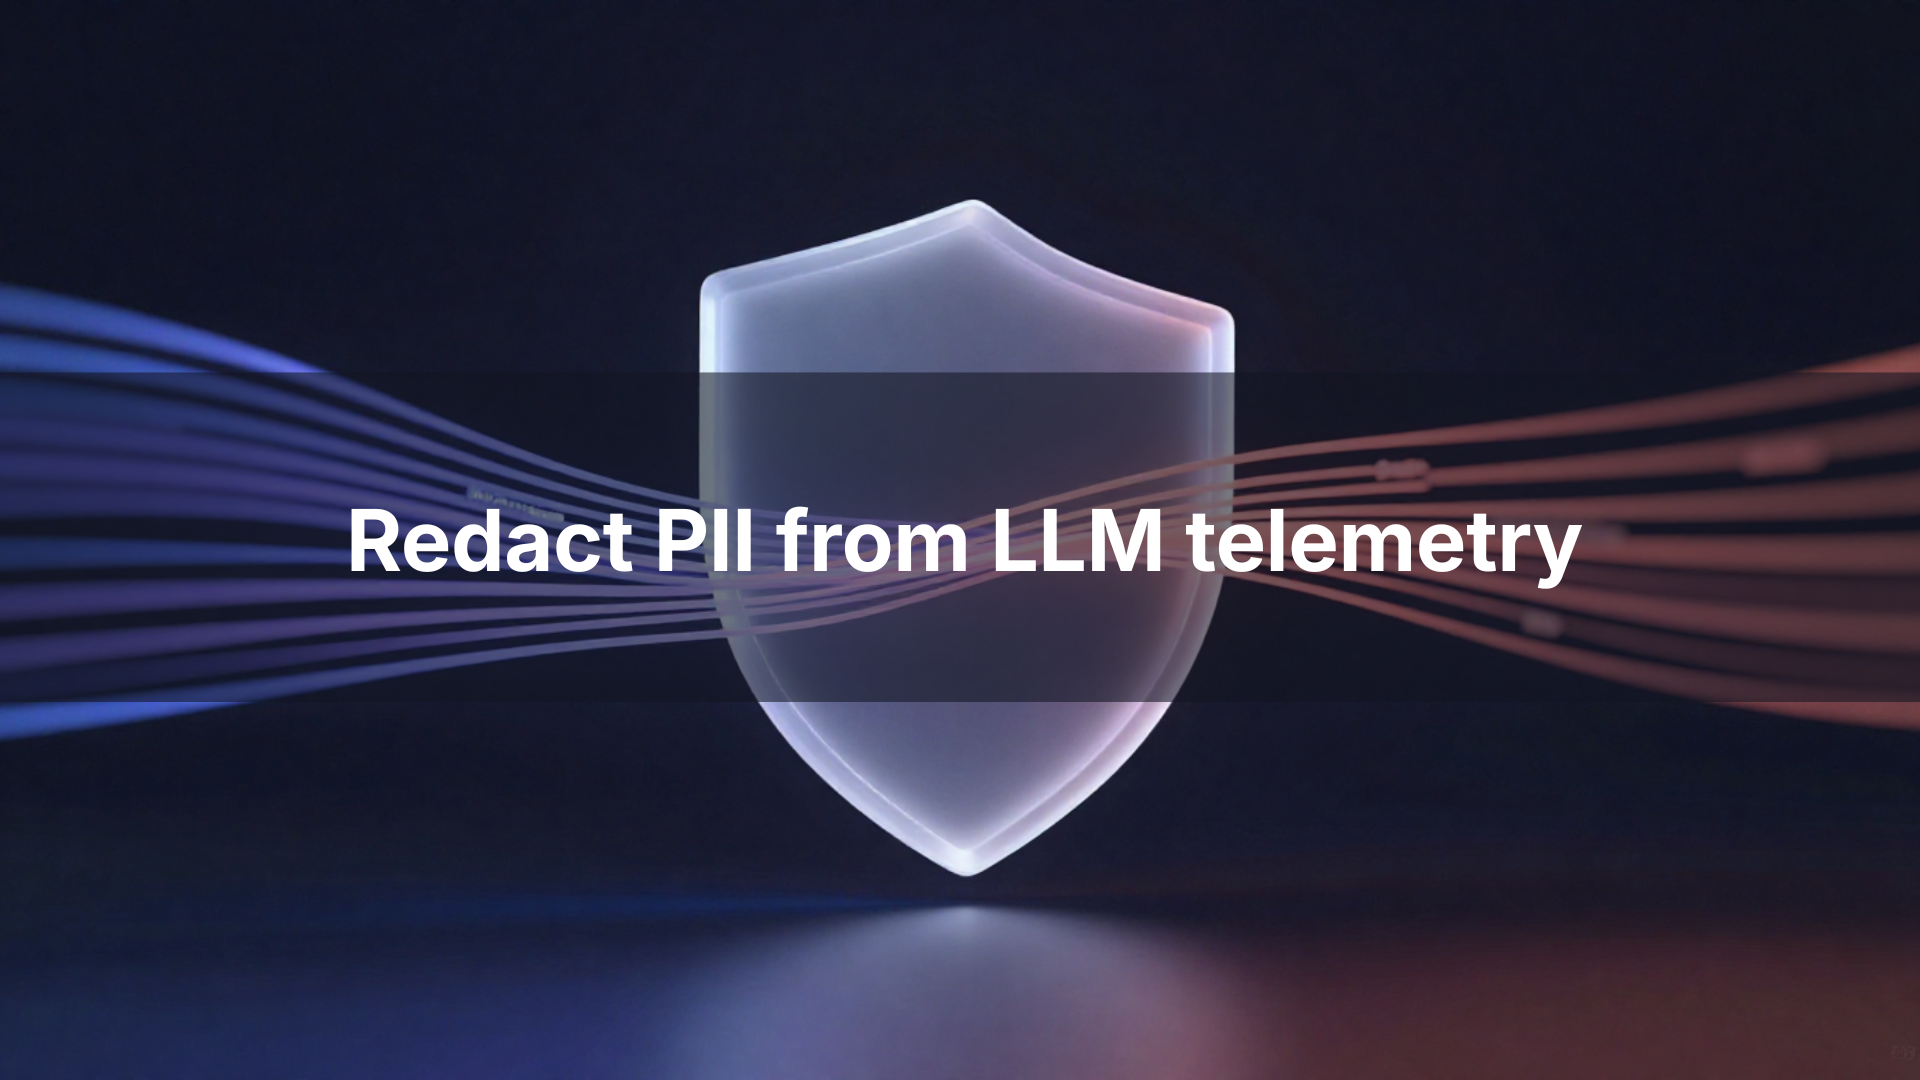
Learn how to redact PII from LLM telemetry using OpenObserve's SDR, VRL pipelines, and OTel Collector — keeping traces debuggable while staying GDPR, HIPAA, and CCPA compliant.
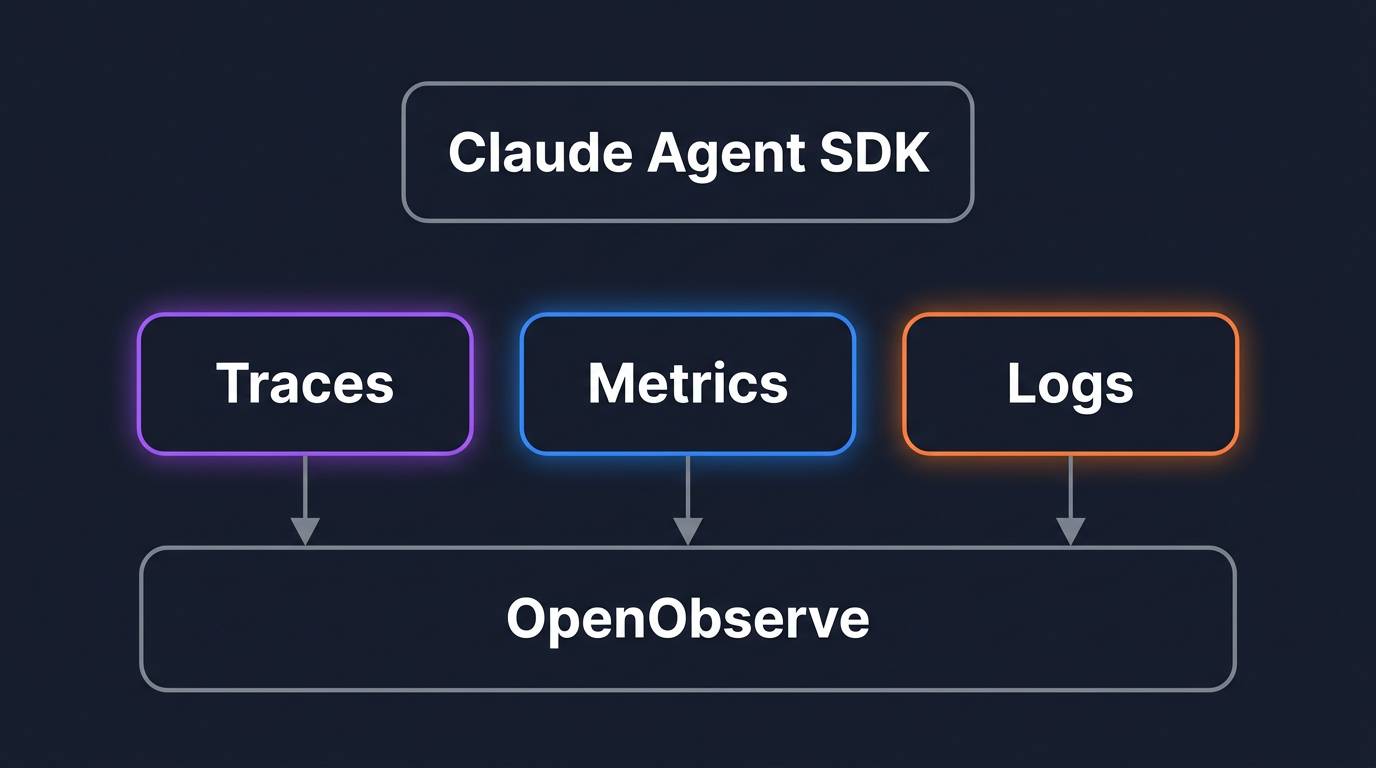
Trace, meter, and log Claude Agent SDK agents with OpenTelemetry: tool calls, MCP servers, extended thinking, and cost, all correlated in OpenObserve.
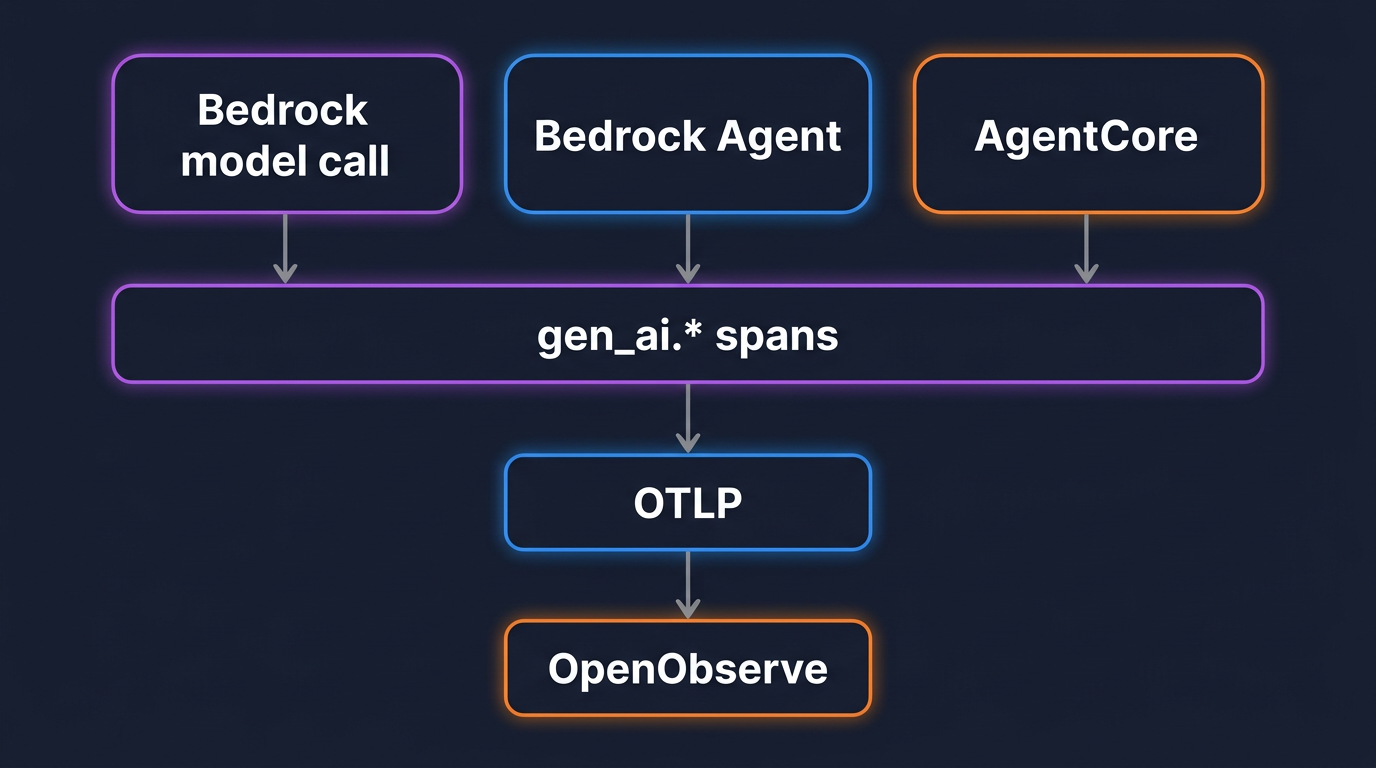
Trace Amazon Bedrock model calls, Bedrock Agents, and AgentCore with OpenTelemetry's gen_ai.* conventions (v1.41), then track token cost in dollars in OpenObserve.
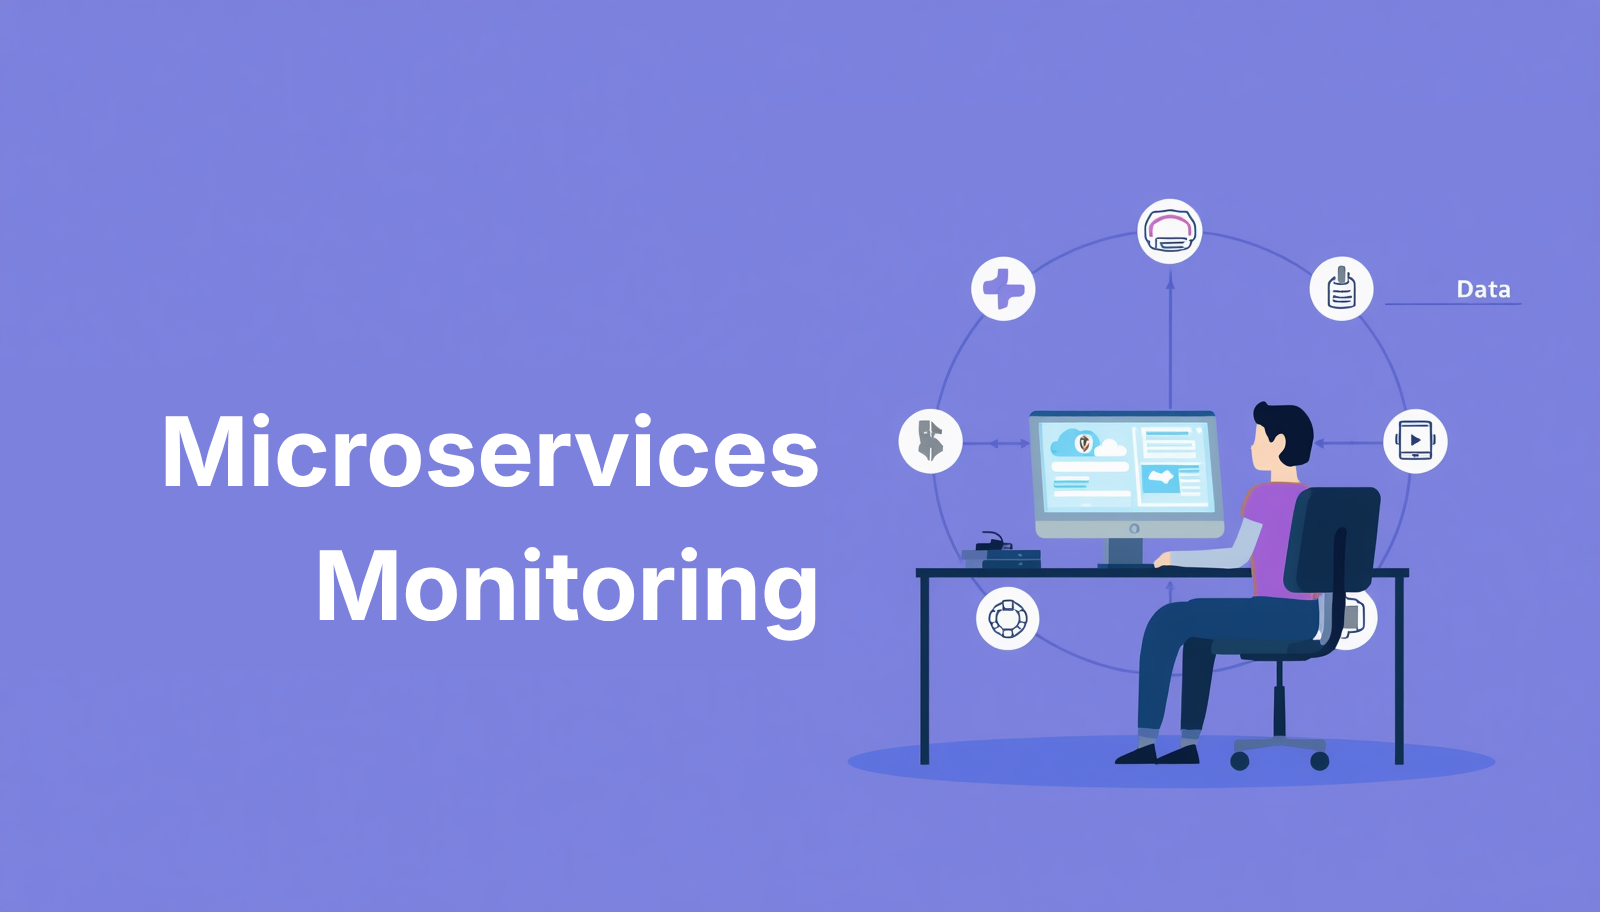
Learn what microservices monitoring is, the 3 pillars of observability, and why OpenObserve is the best open-source tool for monitoring microservices in 2026. 140x lower storage costs, unified logs, metrics, and traces.
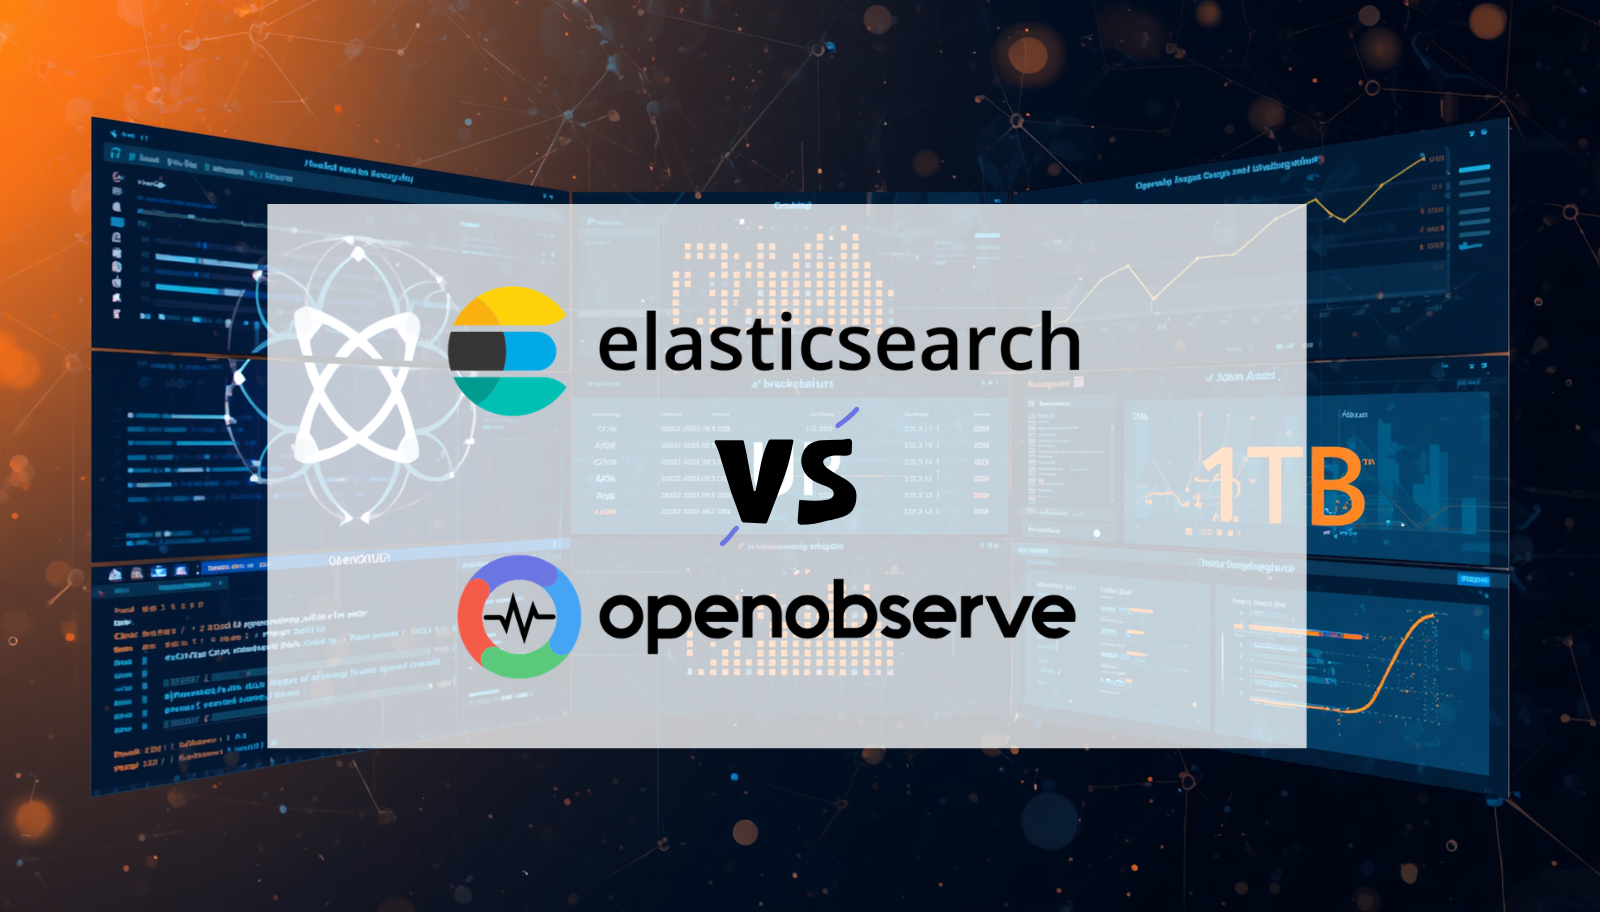
We streamed 1.1 TB of Kubernetes-format log data to both Elasticsearch and OpenObserve simultaneously on identical AWS hardware. A detailed performance benchmarking and comparison of storage, CPU, RAM, and query performance.
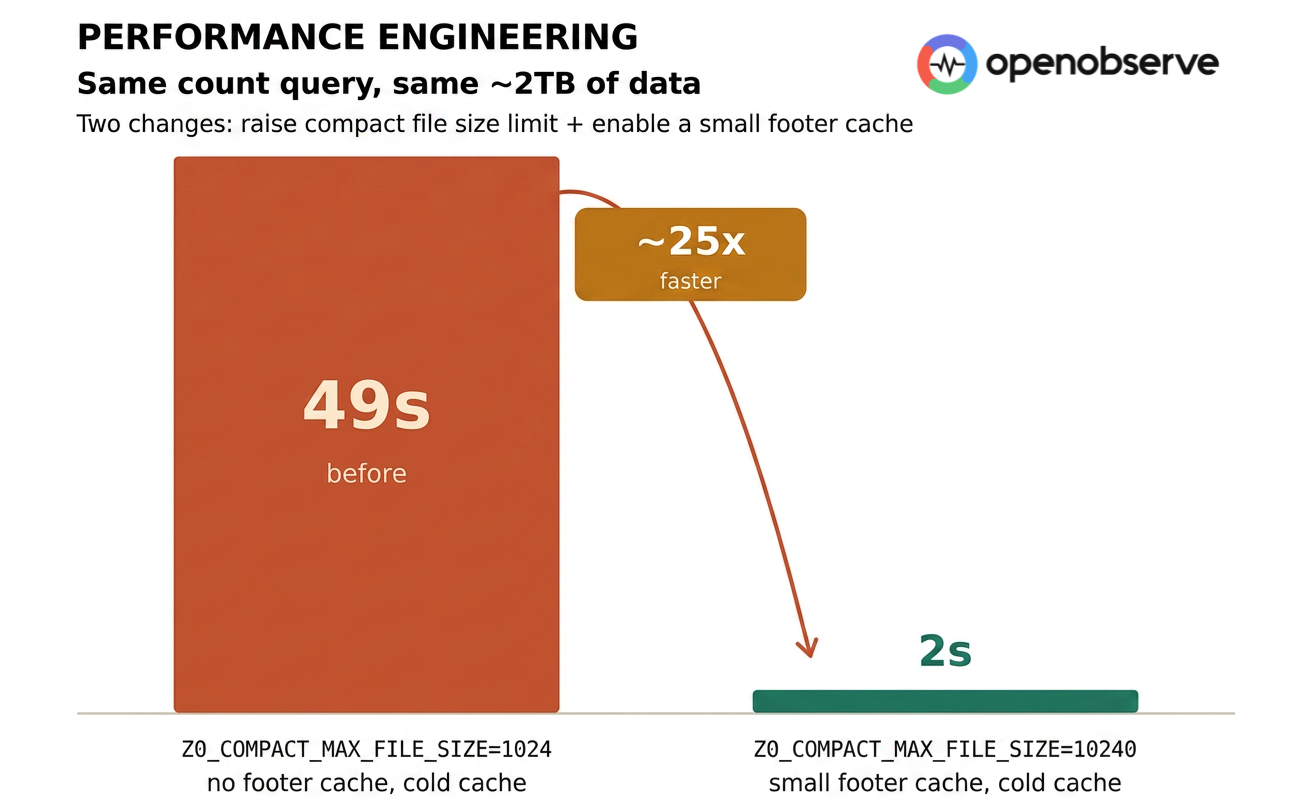
Same ~2TB of data, same count query, same querier config — two parameter changes took a Tantivy query from 49 seconds to 2 seconds. Learn how raising compact file size and enabling footer cache drove a 25× speedup by slashing S3 requests from 10,000+ to ~600.
OpenObserve now supports Terraform for infrastructure-as-code deployments, Bring Your Own Bucket for full control over your data storage, and ships targeted UX improvements across the service catalog, traces view, and log correlation.