Understanding Full Stack Monitoring and Observability
In a world where application performance and user experience are directly tied to business outcomes, having a comprehensive view across your entire tech stack is no longer optional. That’s where full stack monitoring comes into play.
The beauty of full stack monitoring lies in its holistic approach. Unlike traditional monitoring that might focus on specific components in isolation, full stack monitoring provides a unified view of everything—from synthetic tests and real-user behavior to logs, metrics, and traces.
If you're looking to simplify your monitoring strategy without overhauling tools or methodologies, full stack monitoring is the logical step.
Let’s explore how this approach provides a complete view of your system's health, and how it helps you streamline performance management across various tech stacks.
Full-Stack Monitoring Explained
Full stack monitoring provides an all-encompassing view of your systems, allowing you to seamlessly monitor applications, infrastructure, and services.
Think of it like full-stack software development—covering everything from front-end to back-end—but for observability.
Instead of viewing different components in isolation, full stack monitoring integrates synthetic monitoring, real-user behavior, logs, metrics, and traces to give you a unified perspective.
This allows teams to understand how each layer of their tech stack impacts overall system health.
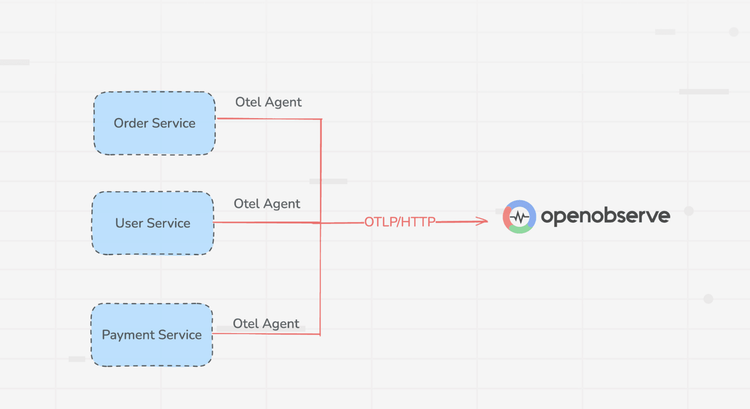
OpenObserve fits perfectly into this system by providing a comprehensive solution that unifies logs, metrics, and traces into a single platform. Whether you’re tracking application performance, infrastructure health, or user experience, OpenObserve gives you the insights needed for end-to-end visibility.
By holistically viewing applications, services, and infrastructure through one lens, you can simplify your operations and streamline decision-making. Full stack monitoring ensures that you can stay on top of every layer of your system, ensuring stability and performance across the board.
Sign up for OpenObserve today and experience comprehensive full stack monitoring.
Now, let’s dive into how full-stack observability extends these capabilities for real-time insights.
Read more on Revolutionizing Observability - Unveiling OpenObserve, the High-Performance, Cloud-Native Platform
Full-Stack Observability Explained
Full-stack observability goes beyond traditional monitoring by offering a real-time view of every component in your technology stack. From the infrastructure to the application layer, observability provides insights into how each element functions and interacts, giving you a deeper understanding of system performance, health, and behavior.
With observability, you're not just collecting metrics or logs. Instead, you’re piecing together all available data—metrics, logs, traces, and more—to form a complete picture of your system’s internal state.
This allows you to see patterns, detect anomalies, and predict failures before they impact your users. It’s about context, not just data.
While monitoring typically tracks known issues (e.g., CPU spikes, memory usage), observability helps you explore deeper insights by examining what's happening inside your system.
With full-stack monitoring, you're simply keeping tabs on performance indicators, but full-stack observability digs deeper, allowing you to proactively diagnose problems and gain actionable insights.
Having a real-time status of each component enables you to make informed decisions quickly. Whether it’s understanding how a microservice is interacting with others or tracking down a bottleneck in your infrastructure, full-stack observability enables you to respond faster and more effectively.
Next, we’ll explore the benefits of combining full-stack monitoring and observability to optimize performance and drive success.
Read more on Difference Between Monitoring and Observability Explained
Benefits of Full-Stack Monitoring and Observability
Full-stack monitoring and observability offer significant advantages when implemented correctly, providing a comprehensive view of your systems. Here’s how:
- Streamline monitoring processes: By combining synthetic monitoring and real-user monitoring under one system, you eliminate the fragmentation of data sources. This allows you to manage all your observability needs in a single operation, giving you clearer insights and reducing operational complexity.
- Improved efficiency: Consolidating monitoring efforts around a single tool reduces the friction between various teams. Instead of handling different platforms for applications, infrastructure, and user monitoring, everything can be managed under one roof, making troubleshooting faster and communication between teams more effective.
- Comprehensive data collection and interpretation: Full-stack monitoring enables the detection of performance risks early by collecting data from logs, metrics, and traces. By correlating these data points, you can identify potential issues before they affect your system's performance, allowing for proactive solutions rather than reactive fixes.
- Enhanced domain knowledge: With a more cohesive approach to monitoring, teams can increase their understanding of how each element in the system behaves. This, in turn, supports better business decisions by tying technical performance to broader strategic goals.
- Improved application security: By continuously assessing data and logs from every layer of the stack, you can detect potential security threats early. Whether it’s identifying vulnerabilities or monitoring suspicious activity, full-stack observability helps protect your systems and maintain uptime.
- Enhanced customer experience: A well-monitored stack ensures reduced latency issues and uninterrupted service. By catching performance bottlenecks in real-time, you can ensure your users experience seamless interactions with your application, leading to higher satisfaction and retention.
Next, we’ll dive into how full-stack monitoring and observability can be implemented in practice to streamline operations and increase system reliability.
Putting Full-Stack Monitoring and Observability into Practice
Implementing full-stack monitoring successfully requires not just tools, but a strategy that aligns your teams and data processes. Here the key steps to ensure you’re getting the most out of your observability approach:
- Simplifying the toolset: Having a broad range of monitoring needs can overwhelm teams, which is why using platforms that offer comprehensive capabilities is vital.
Open-source solutions like OpenObserve provide unified logs, metrics, and traces, while also being scalable and customizable to meet various organizational requirements. Simplifying the toolset with such platforms minimizes friction and ensures the team has everything they need in one place.
Visit our website to explore all the powerful features and solutions we offer.
- Unifying monitoring teams: Different teams often use different tools to handle varied monitoring tasks, from application performance to infrastructure health. Unifying your monitoring teams to work collaboratively on a single platform leads to a more cohesive approach. This also improves cross-team communication, making it easier to resolve issues as they arise.
- Comprehensive analysis: A solid full-stack monitoring setup means that the insights gained aren’t siloed into separate teams or tools. Instead, all monitoring data—whether from logs, metrics, or traces—should feed into one unified view, making the analysis more comprehensive. This integration allows for identifying trends and anomalies quickly and efficiently.
- Breaking down operational silos: Aligning IT teams around shared contexts removes the operational silos that often impede real-time problem solving. By bringing together all parts of your tech stack into a single observability tool, you can provide every team with the visibility needed to understand how their components interact with others. This approach not only increases efficiency but fosters a culture of collaboration across departments.
Up next, we’ll explore how proactive issue resolution within full-stack monitoring can enhance system reliability and performance.
Read more on Building Open Source Observability Platform: Tools and Testing
Proactive Issue Resolution
Proactive issue resolution ensures that you can maintain optimal performance and minimize downtime by catching problems early.
Pinpoint Problems Before They Affect Performance
In full stack monitoring, one of the primary objectives is to detect issues before they impact the user experience. By monitoring logs, metrics, and traces in real-time, you can spot anomalies in performance or behavior early, allowing you to resolve issues before they become critical.
AI and ML for Problem Diagnosis and Tracking
Leveraging AI and machine learning (ML) algorithms for problem diagnosis enables a more efficient and automated approach. These tools can recognize patterns, predict failures, and even suggest fixes based on historical data. AI-driven insights significantly reduce the time it takes to identify root causes, making your resolution process faster and more efficient.
Correlating Logs, Metrics, and Traces for Faster Resolution
Full stack monitoring also involves combining multiple data types—logs, metrics, and traces. By correlating these data points, you get a more holistic view of your system’s behavior, which aids in diagnosing problems faster. For instance, an error trace can quickly lead you to the specific service malfunctioning, while real-time logs provide deeper insights into what triggered the error.
In the next section, we'll explore how resource optimization and cost management complement proactive issue resolution.
Read more on Navigating Observability: Logs, Metrics, and Traces Explained
Resource Optimization and Cost Management
Predicting Computing, Storage, and Network Resource Needs
Effective full stack monitoring is not just about performance; it's also about understanding your resource needs. By monitoring usage patterns and system demands, you can predict how much computing power, storage, or network capacity you'll need in the future. This predictive insight allows you to scale your infrastructure before you hit performance bottlenecks, ensuring optimal performance at all times.
Real-Time Resource Forecasting and Allocation
One of the key benefits of full stack monitoring is the ability to perform real-time resource forecasting and allocation. By tracking resource consumption across different components—such as CPU, memory, and bandwidth—you can allocate resources dynamically. This ensures that critical applications have the resources they need while avoiding waste.
Proactive Actions to Minimize Costs and Maximize Performance
Cost management is a critical concern for most organizations. Full stack monitoring helps optimize resources, allowing you to take proactive actions to minimize costs. By identifying underused resources, you can reallocate or reduce them, helping to keep your infrastructure lean and efficient without sacrificing performance.
With platforms like OpenObserve, organizations can manage large volumes of data in a cost-effective manner. OpenObserve’s ability to handle both cloud and on-premises deployments means you can choose the solution that fits your budget while still getting high performance and resource efficiency.
Read more on Empowering Monitoring Excellence with OpenObserve on Azure AKS
Conclusion
To conclude, full stack monitoring enables organizations to gain a holistic view of their infrastructure, applications, and services, ensuring that everything from resource allocation to performance is optimized. It’s essential for businesses aiming to enhance efficiency, security, and user experience. By integrating logs, metrics, and traces, you’re able to proactively resolve issues, minimize costs, and make data-driven decisions that align with your business goals.
OpenObserve plays a critical role here by offering a scalable, cost-effective platform that simplifies full stack monitoring. Its robust capabilities in handling real-time data, optimizing resources, and delivering actionable insights make it an ideal solution for organizations of any size.
Ready to take your monitoring to the next level? Sign up with OpenObserve today!
For more information, visit our website. For developers, you can also explore the project on GitHub and start contributing.