Log Management and Analytics
Transform your log data into actionable insights with real-time analysis and industry-leading storage efficiency.
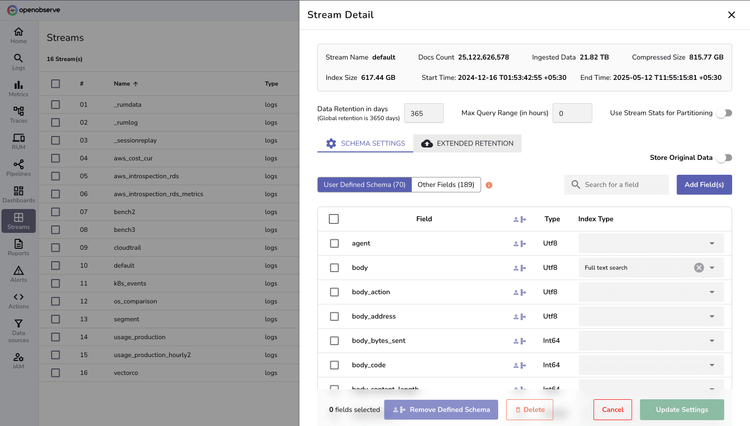
Significantly Efficient
140x lower storage costs compared to Elasticsearch
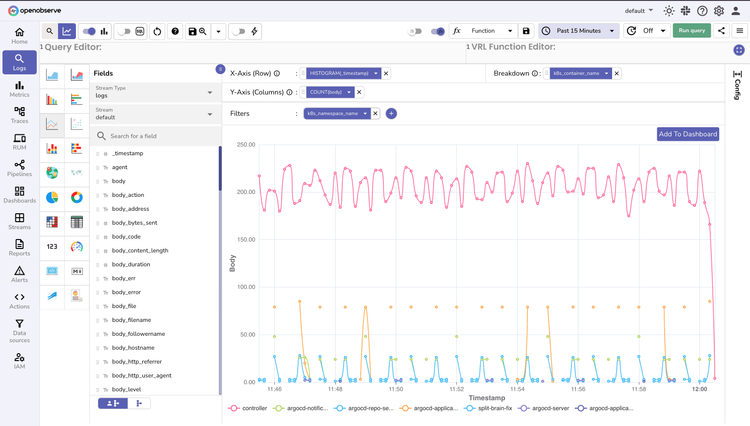
Highly Performant
Run lightning-fast queries across terabytes of data.
OTel-Native Logs
Standardized collection with zero vendor lock-in.
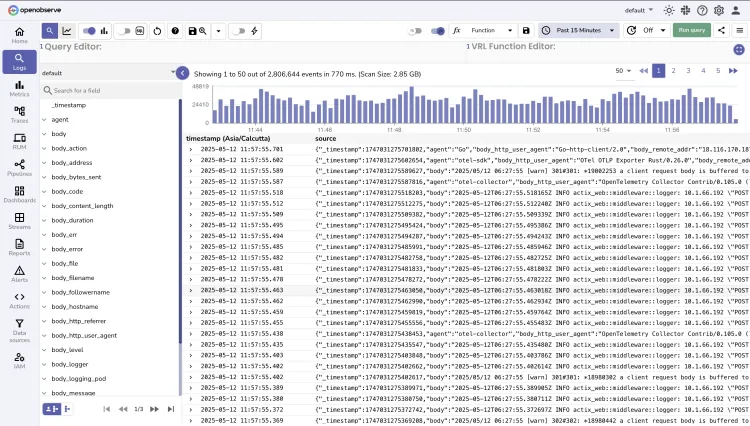
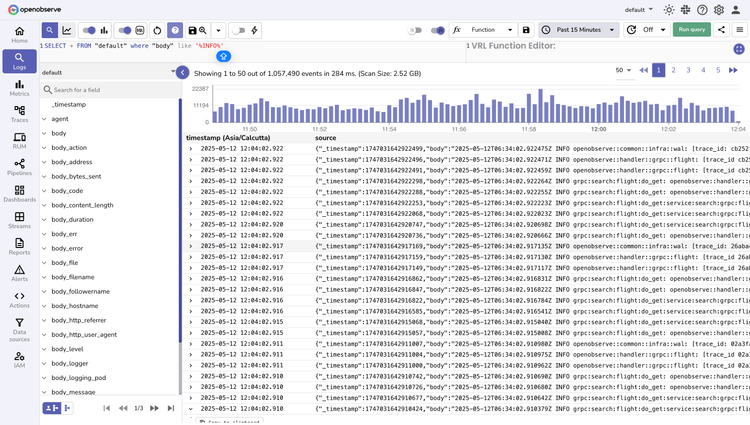
OpenObserve Logs
Scale from gigabytes to petabytes while dramatically reducing costs.
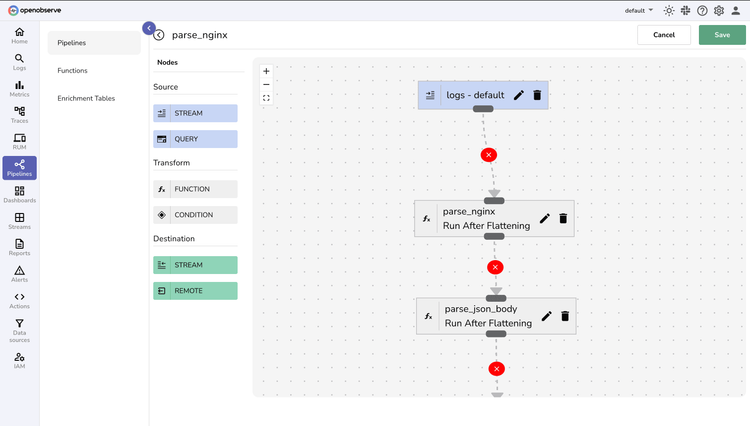
Log Processing
Automated Parsing
Flexible Transformation Pipeline
Enrich, filter, and reshape logs during ingestion with Vector Remap Language—maintaining peak performance while handling any log format.
Log FAQs
Latest From Our Blogs


Ready to get started?
Try OpenObserve today for more efficient and performant observability.