OpenObserve's Turnkey Observability Solutions
Launch in Minutes, Not Weeks
Spin up observability instantly without complex setups or manual configuration.
Cut Observability Costs
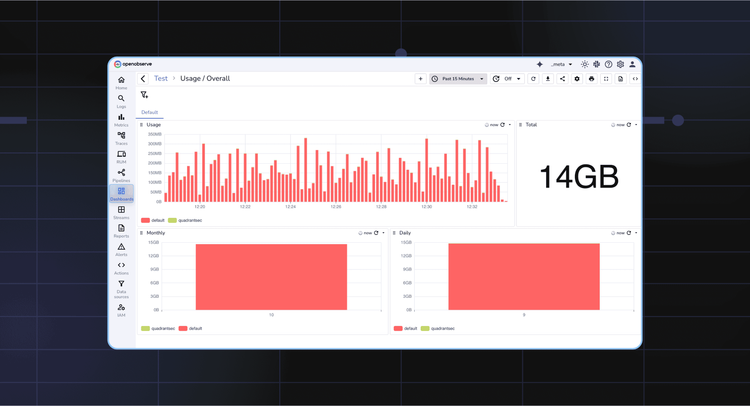
Reduce telemetry storage spend using OpenObserve's ultra-efficient compression and smart retention.
Consolidate for Clarity
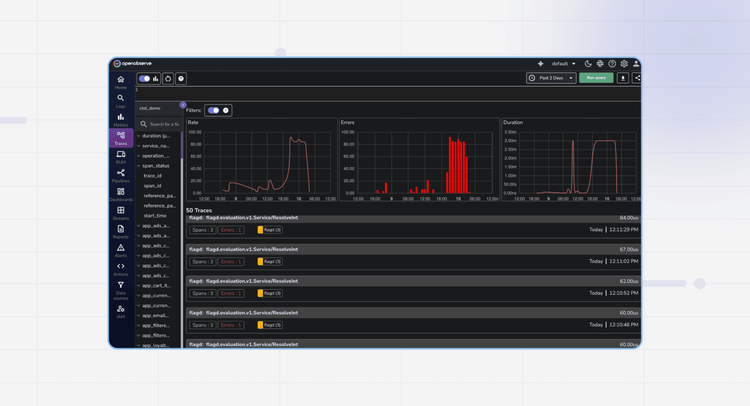
Correlate metrics, logs, and traces in a single platform for faster root cause analysis.
Explore Our Solutions
Discover how OpenObserve can address your specific observability needs with our tailored solutions
Solutions
AWS Monitoring
Comprehensive visibility into your AWS infrastructure performance, health, and resource utilization.
Real-Time Visibility & Insights
Efficient Data Processing
Service Coverage & Integration
Cost-Effective Monitoring

Latest From Our Blogs


Ready to get started?
Try OpenObserve today for more efficient and performant observability.