AI Incident Management: How AI Reduces MTTR and Automates Root Cause Analysis

Manas Sharma
March 19, 2026
15 min read
Don’t forget to share!
Try OpenObserve Cloud today for more efficient and performant observability.

When your payment service crashes at 2 AM and 147 alerts flood your incident channel, your on-call engineer faces an impossible problem: which alert matters? Where did the failure start? What broke, and why?
Traditional incident management tools add to the chaos. They create tickets, send notifications, and page people—but they don't answer the critical questions. Engineers waste hours correlating logs across services, tracing requests through distributed systems, and manually piecing together what went wrong.
AI incident management changes this fundamentally. Instead of drowning teams in alerts, AI-powered systems automatically correlate events, identify root causes, and generate structured incident reports—reducing Mean Time to Resolution (MTTR) from hours to minutes.
Modern AI incident management platforms use machine learning for log clustering, distributed trace analysis for dependency mapping, metric correlation to identify causal relationships, and large language models (LLMs) to synthesize findings into actionable root cause analysis. The result: incidents that used to take 4 hours to diagnose now resolve in under 15 minutes.
This guide explores how AI incident management works technically, why it's transforming production operations in 2026, and how platforms like OpenObserve are delivering 90% MTTR reduction through autonomous incident investigation.
The shift to microservices and cloud-native infrastructure has created an operational complexity crisis. A single API request might touch 15 different services, each running across dozens of containers. When something breaks, the blast radius is massive—and the signal-to-noise ratio is abysmal.
According to recent industry surveys:
The problem isn't detection—it's understanding. Modern monitoring tools are excellent at noticing when metrics deviate from baselines. They're terrible at explaining why those deviations matter and what actually broke.
Here's what traditional incident response looks like:
Steps 1-7 are pure waste. They don't fix anything—they just figure out what needs fixing. This is exactly where AI incident management delivers transformational value.
AI incident management isn't a single algorithm—it's a stack of complementary techniques that work together to automate investigation. Here's how the core capabilities function:
The first step is reducing noise. When 147 alerts fire, AI groups them into 2-3 actual incidents.
How it works:
Dimension matching analyzes alert metadata (service name, cluster, namespace, environment) to detect relationships:
payment-service-pod-1 is a subset of alert for payment-service-*production-cluster get grouped under cluster-level incidentService topology awareness understands dependencies. If the database fails, AI knows that downstream API errors are symptoms, not separate incidents.
Semantic deduplication uses NLP to identify that "High error rate in payment processor" and "Payment service failing health checks" describe the same problem.
Result: Alert volume drops 80-90% on day one. Instead of 147 individual tickets, you see 3 incidents with clear hierarchical relationships.
For more on how alert correlation works, see our deep-dive: How Alert Correlation Reduces MTTD and MTTR.
Once alerts are grouped, AI analyzes logs to understand what's happening.
Log clustering uses machine learning to group similar log lines:
User <ID> failed authentication from <IP>Pattern-based anomaly detection compares current log distributions to historical baselines:
Natural Language Processing (NLP) extracts meaning from unstructured logs:
Result: Instead of manually grep'ing through millions of log lines, engineers see "Top 3 anomalous log patterns during incident window" with frequency distributions and first occurrence timestamps.
Logs tell you what happened. Traces tell you where it happened and why it propagated.
Trace-based dependency mapping follows individual requests through distributed systems:
Error propagation analysis distinguishes root causes from symptoms:
Anomalous trace detection finds requests that behave differently:
Result: Engineers see "Payment failed because order-service → inventory-check timed out at 14:32:17" with direct links to the failing trace span—no manual trace searching required.
Metrics provide quantitative evidence. AI correlates metric changes with incidents to identify contributing factors.
Time-series correlation identifies which metrics changed when the incident started:
database-pod-3 at 14:31:58 (32 seconds before first error)us-west-2a subnet at 14:31:45Causal inference attempts to determine what caused what:
Baseline comparison shows what changed from normal:
Result: Instead of guessing which metric matters, engineers see "Top 3 metrics correlated with incident start" ranked by causal likelihood with visual timeline overlays.
This is where everything comes together. Large language models synthesize findings from logs, traces, and metrics into structured root cause analysis.
How LLM-assisted RCA works:
Transparency is critical: Unlike black-box AIOps, engineers can review exactly what data informed each conclusion. Every finding is grounded in actual telemetry signals, not opaque model outputs.
Result: 5 minutes after incident start, engineers have a complete RCA draft that would have taken 2-3 hours to produce manually.
For more on how incident correlation works technically, see: Incident Correlation: The Key to Reducing Alert Fatigue.
Not all AI incident management tools deliver on the promise. Here's what separates effective platforms from marketing hype:
1. Unified observability data
2. Transparent AI reasoning
3. Historical learning
4. Automated documentation
5. No per-user pricing
Several platforms offer AI-powered incident management capabilities:
For a comprehensive comparison of AIOps platforms, see: Top 10 AIOps Platforms in 2026.
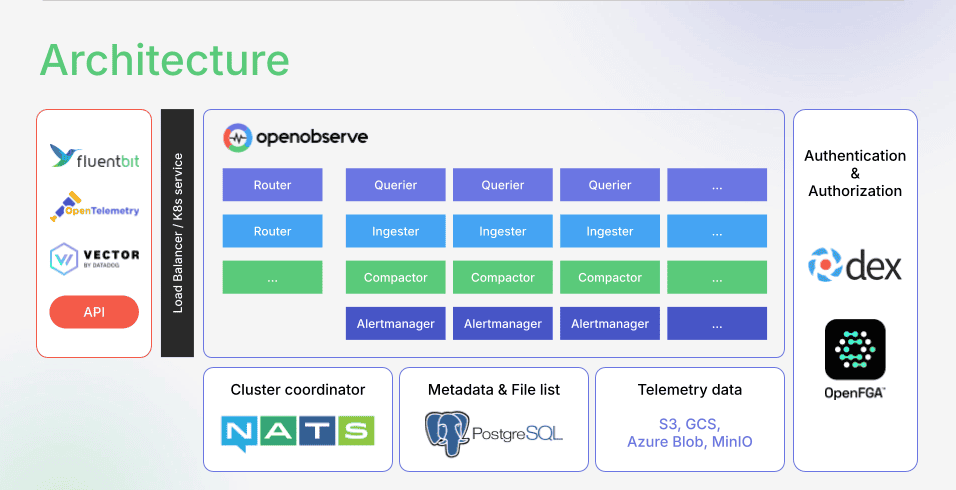
OpenObserve takes a different approach to AI incident management—one grounded in the principle that AI is only as intelligent as the data it analyzes.
Most observability platforms force trade-offs: sample 99% of traces to control costs, aggregate logs to reduce volume, tier data into "hot" and "cold" storage. Each compromise degrades AI effectiveness. The anomaly you need to detect is often in the data you didn't capture.
OpenObserve solves the economics problem first. By using columnar storage (Parquet), aggressive compression, and efficient indexing, OpenObserve delivers 140x lower storage costs than traditional platforms. This makes full-fidelity telemetry affordable— so AI has complete, uncompromised context.
OpenObserve Incidents is powered by the AI SRE Agent, that automates incident investigation from alert to root cause.
Core capabilities:
1. Autonomous Incident Analysis
When alerts fire, the O2 SRE Agent immediately begins investigation:
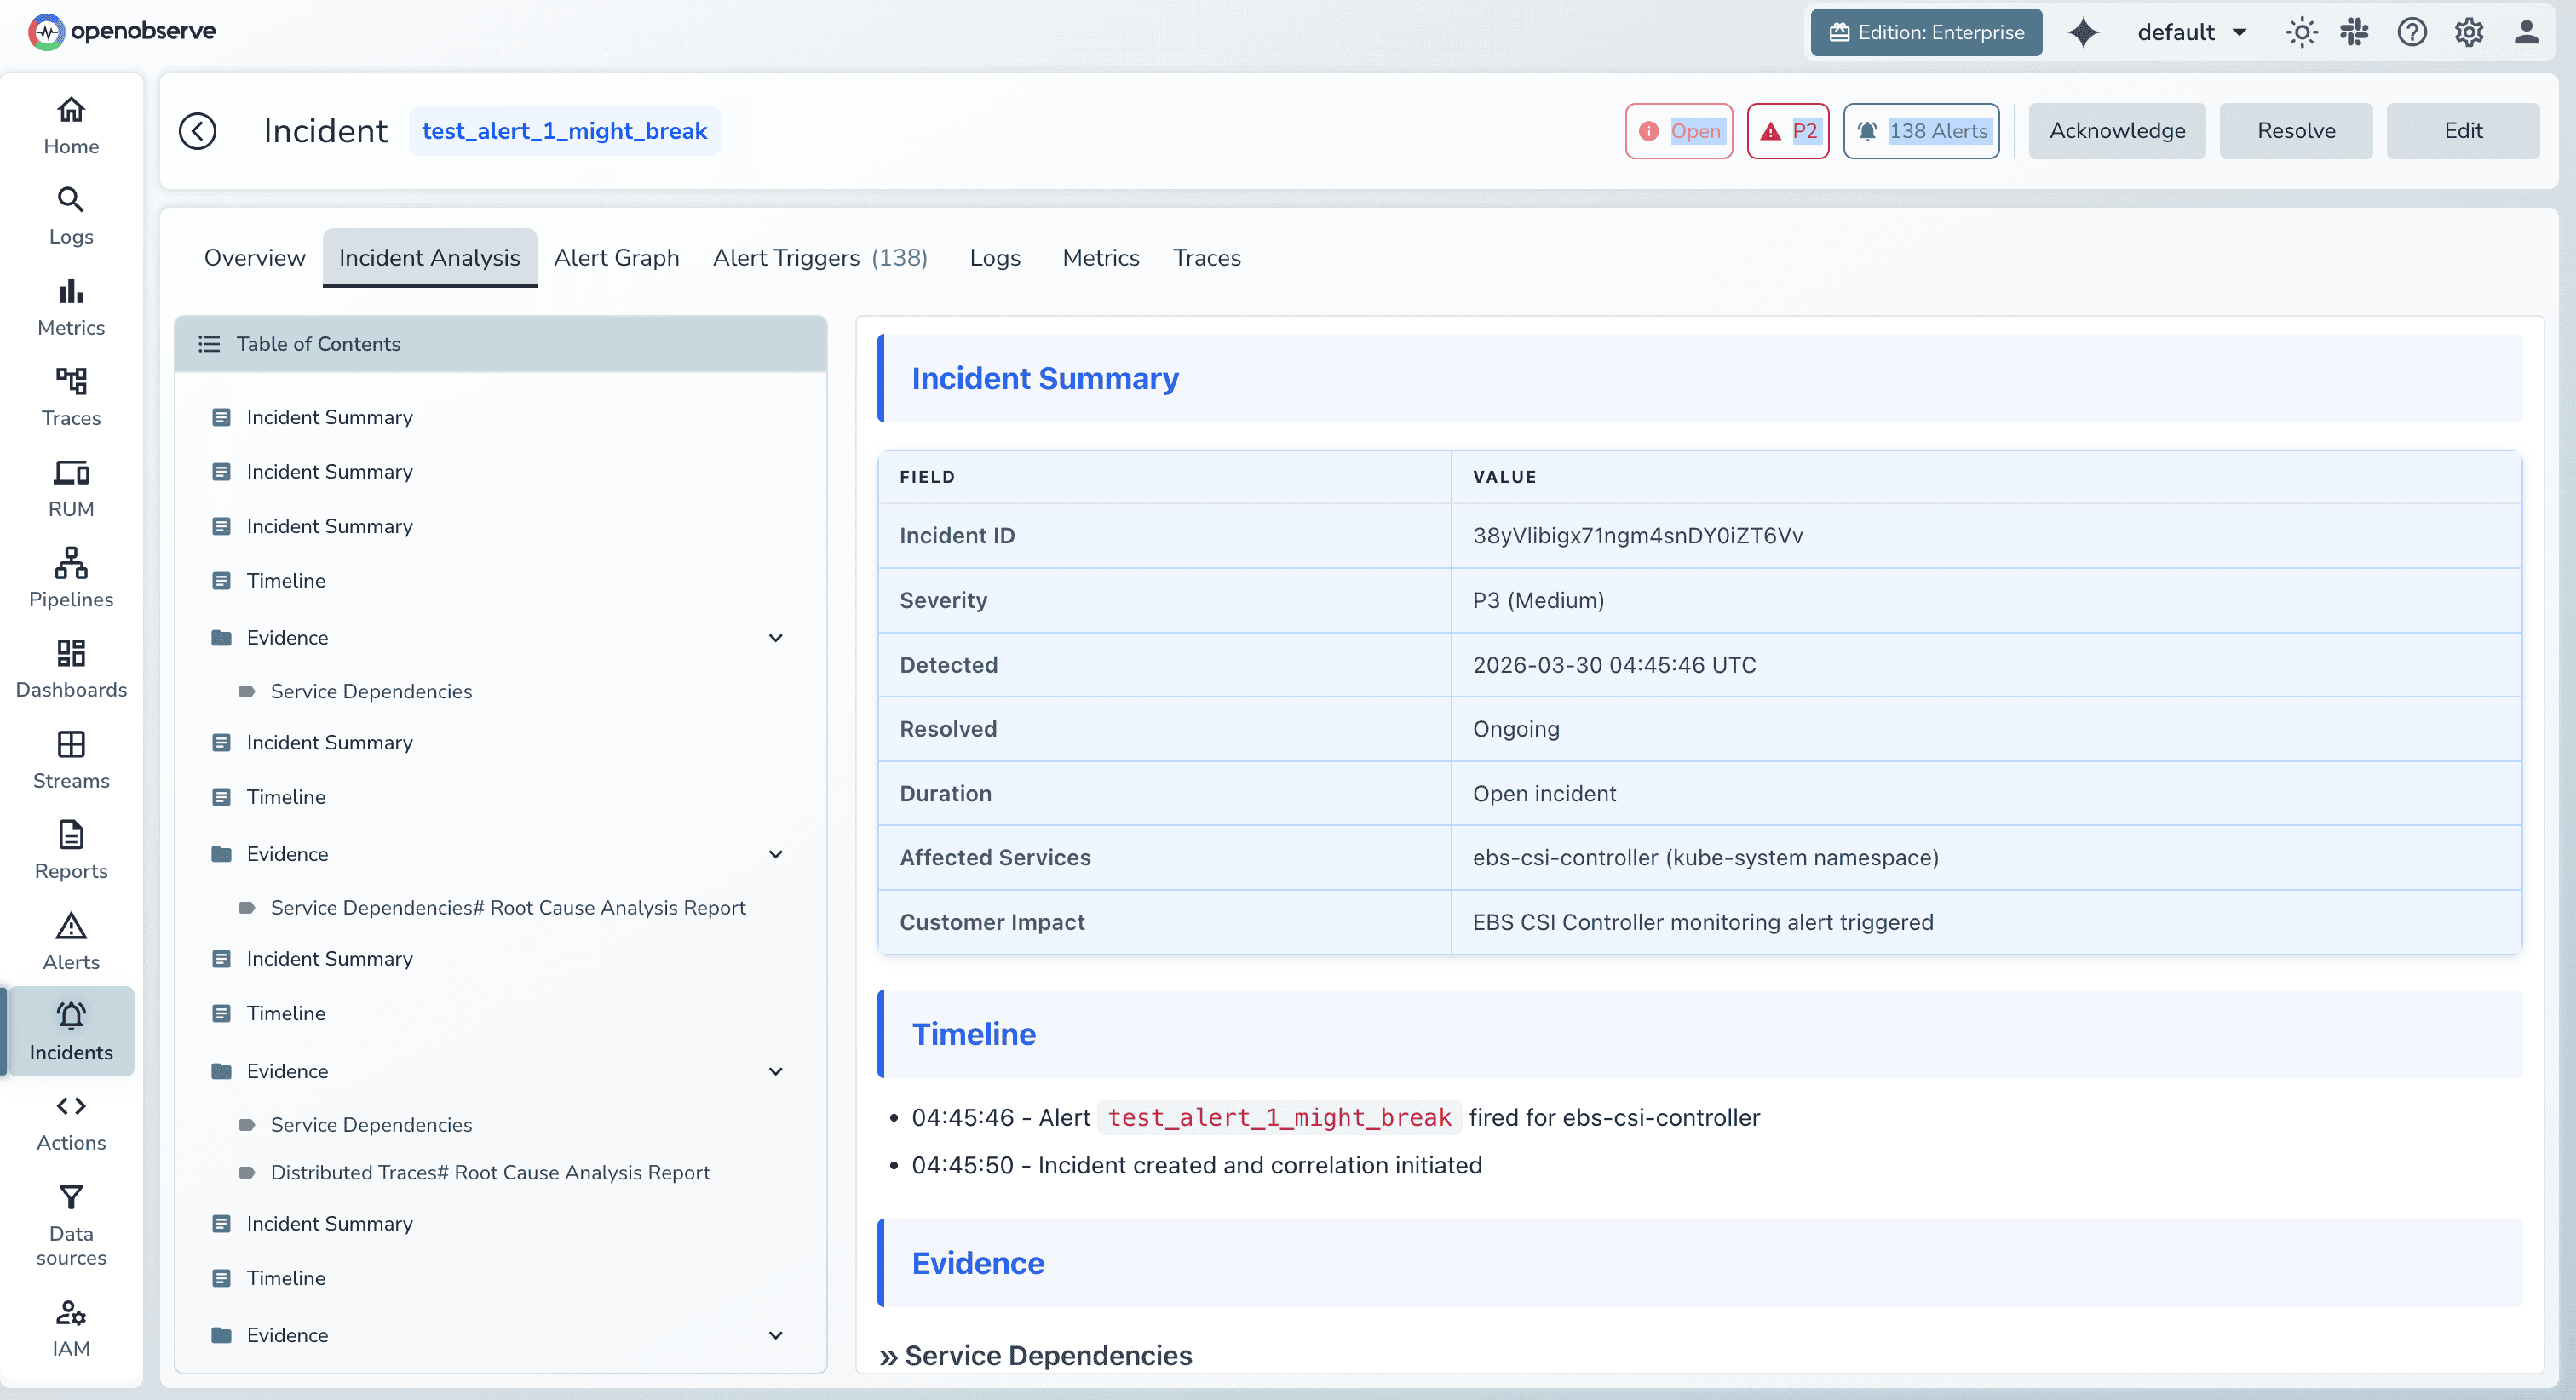
Result: Mean time to resolution drops by 90%. While your team is logging in, the AI has already identified root cause and drafted remediation steps.
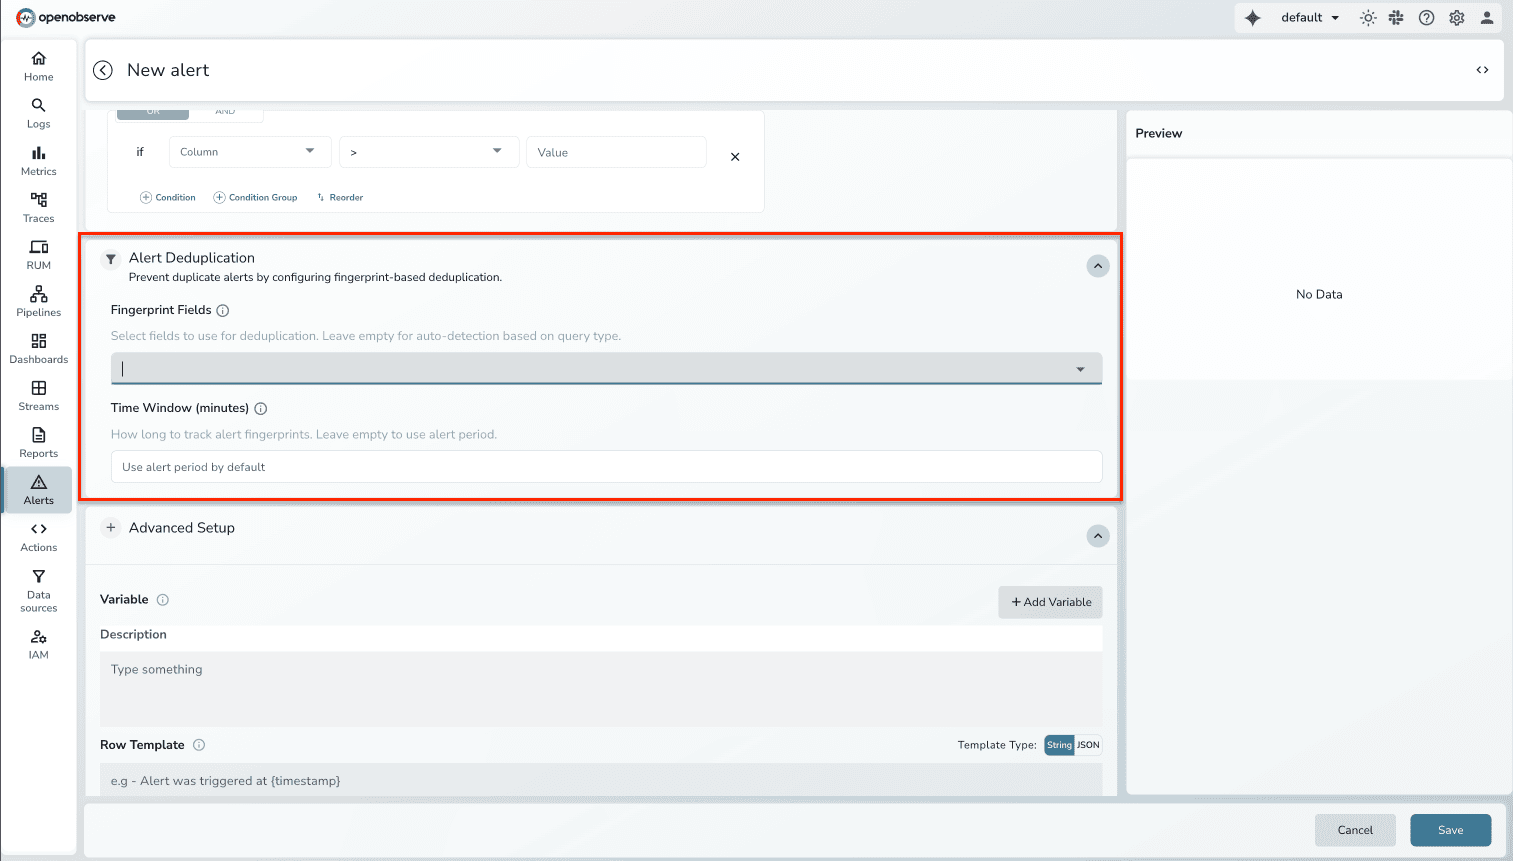
2. Intelligent Alert Grouping
The agent consolidates alert noise automatically:
Result: 80-90% reduction in alert noise from day one. No manual rule configuration required.
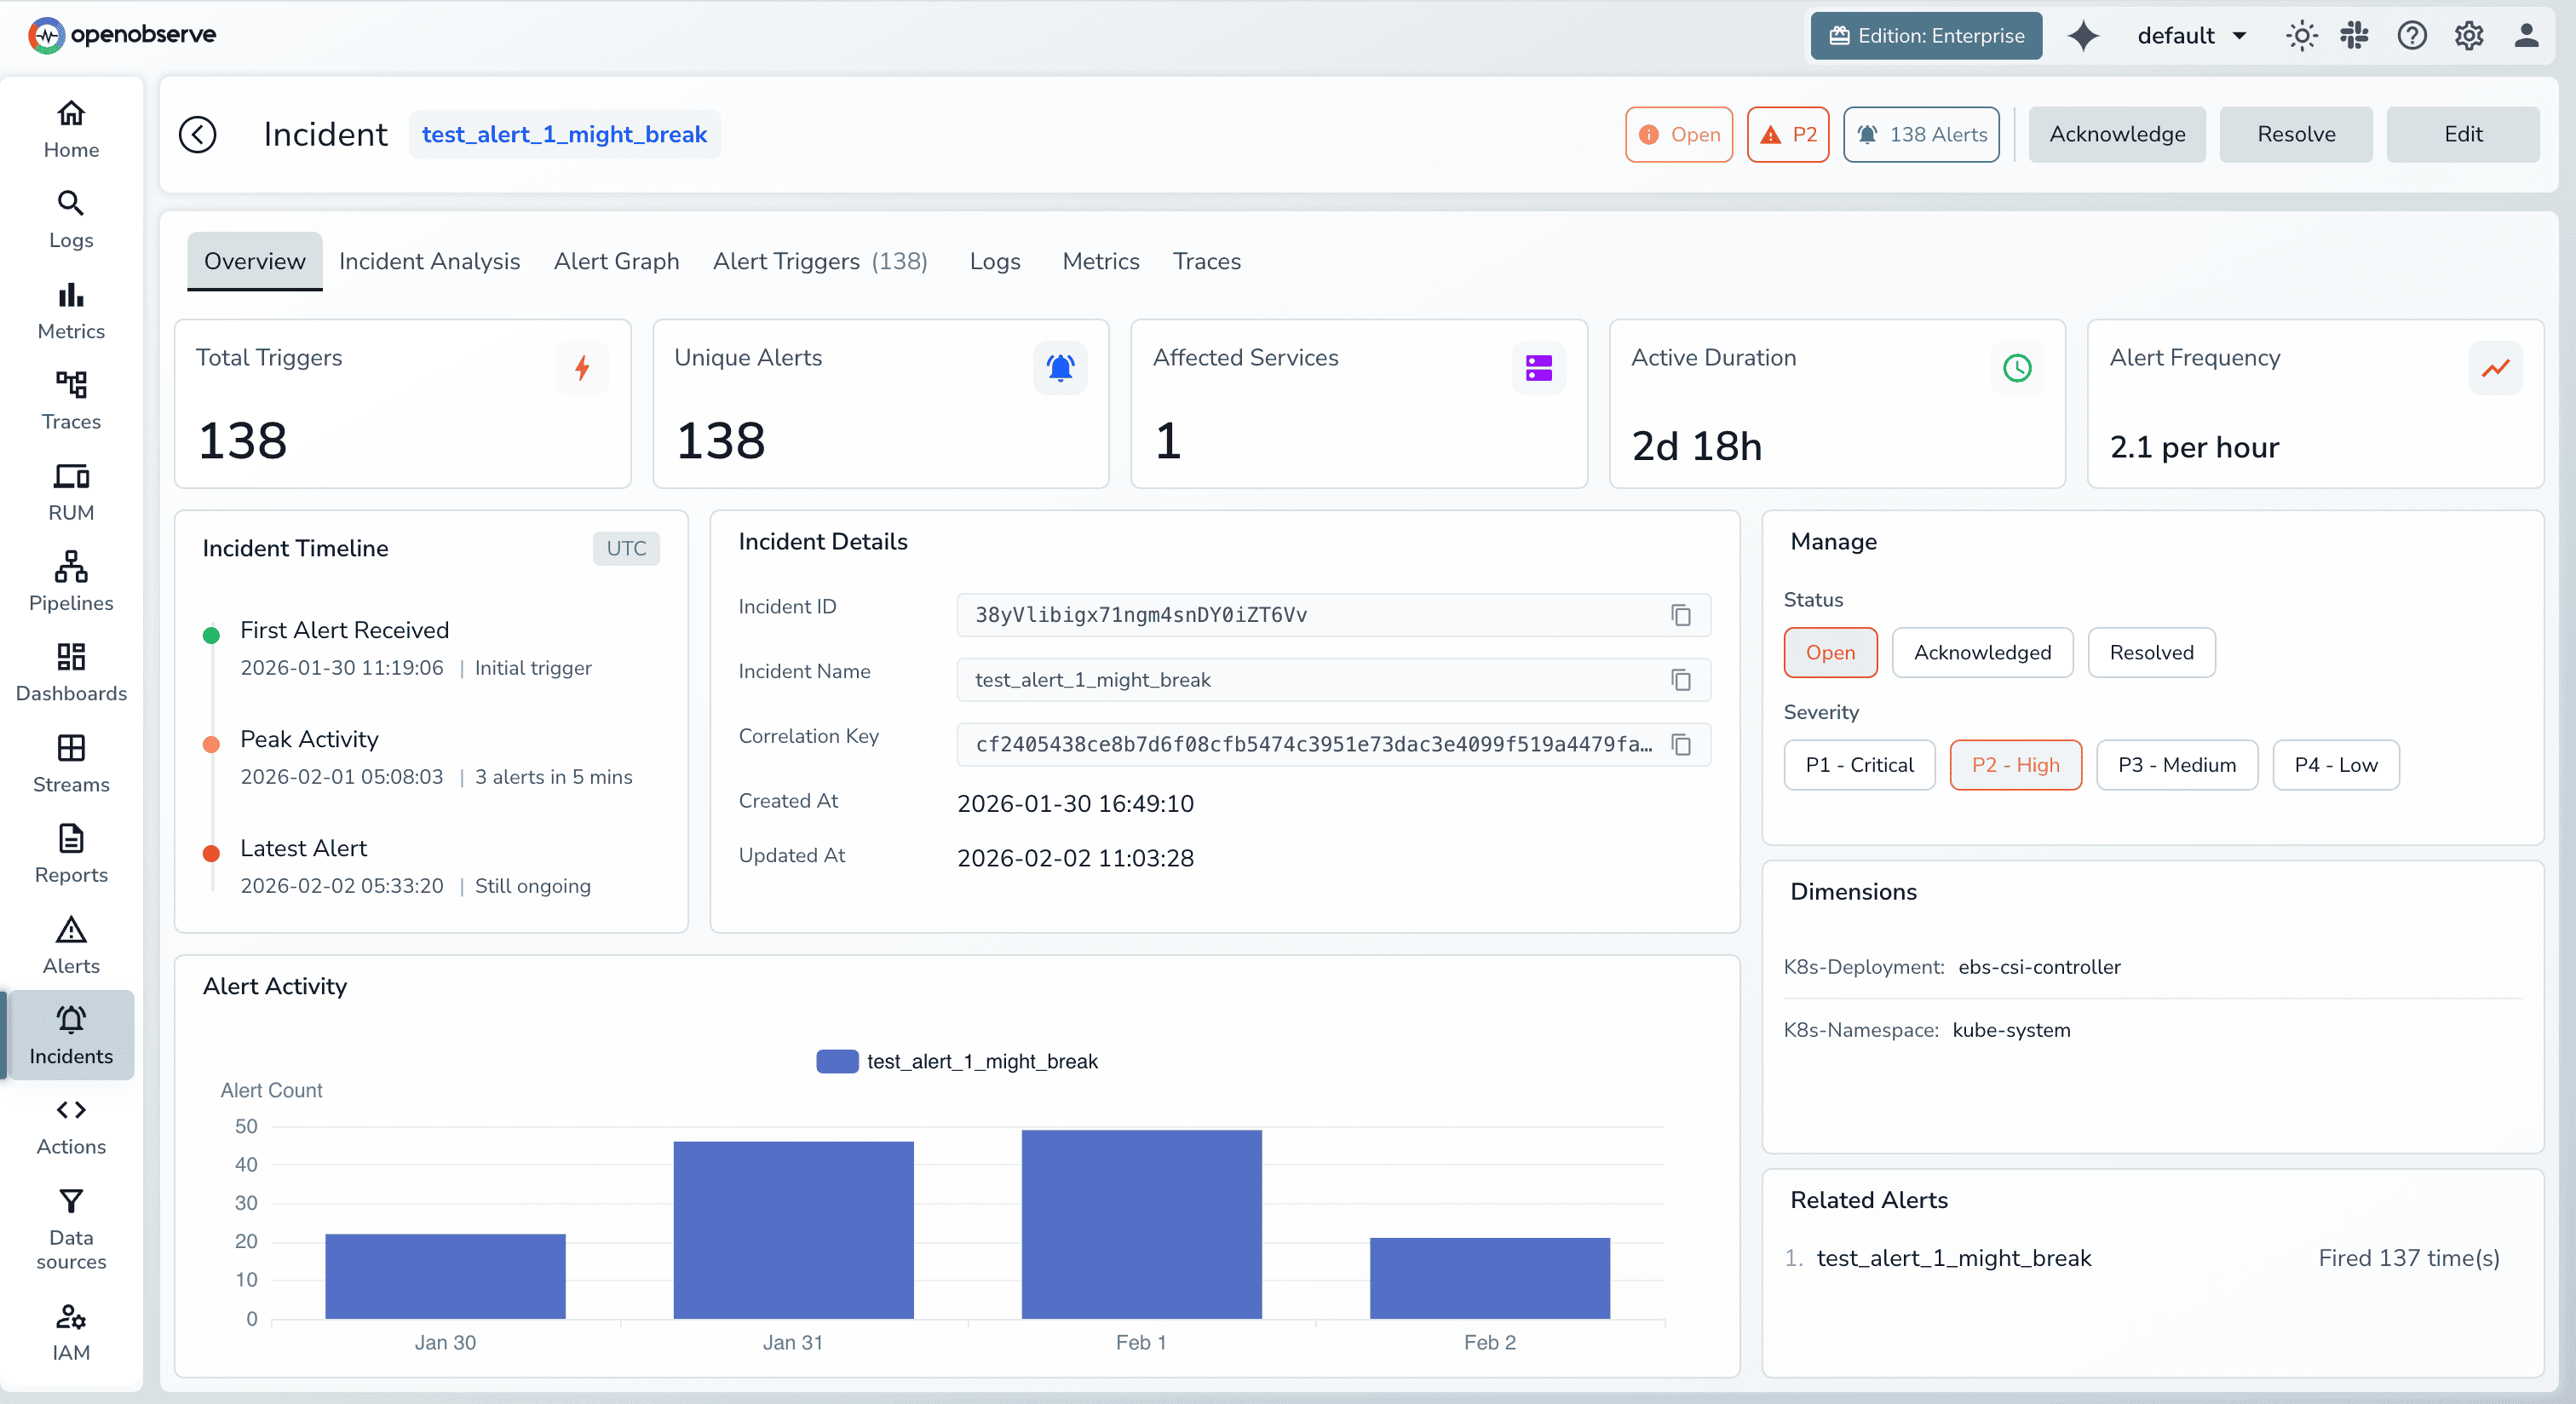
3. Historical Pattern Matching
The agent learns from every incident your team handles:
Result: Common incidents get faster to resolve as the agent builds organizational memory. Knowledge compounds instead of being lost in Slack threads.
4. Automated Incident Documentation
Every incident gets a comprehensive report automatically:
Result: High-quality postmortems without the 2-hour writing tax. Engineers verify and publish instead of drafting from scratch.
Engineers can also connect Claude (or other AI providers) directly to OpenObserve via the OpenObserve MCP server
This integration brings AI-powered observability directly into the tools engineers already use—no context switching required.
AI platforms group alerts by environment scope (cluster, namespace, deployment) rather than individual workload instances. Dimension matching detects subset/superset relationships between alerts to consolidate related signals into single focused incidents. This delivers 80-90% noise reduction without manual rule configuration.
Reliability depends on data quality and transparency. Effective AI incident management grounds every conclusion in actual telemetry signals (logs, metrics, traces). Engineers can validate findings by reviewing the evidence that informed AI conclusions. Treat AI-generated RCA as a high-fidelity first draft—verify against evidence before publishing.
Transparent platforms show their work. When AI misidentifies root cause, engineers can see why it reached that conclusion (which signals it weighted, which patterns it matched). This creates learning opportunities: teams can tune correlation rules, adjust metric thresholds, or improve instrumentation. Black-box systems that hide reasoning are untrustworthy—avoid them.
Yes, but differently than familiar patterns. For known incident types, AI references historical resolutions for fast remediation. For novel incidents, AI still performs correlation and evidence gathering—it just won't have historical playbooks to suggest. Engineers still benefit from automated log clustering, trace analysis, and metric correlation even if the final RCA requires human interpretation.
Immediate for alert correlation (works day one). Historical pattern matching improves over 2-3 months as the system learns from resolved incidents. Root cause analysis accuracy starts at 70-80% and improves to 90%+ as the agent trains on your specific environment.
No, it augments them. AI handles the repetitive, time-consuming investigation work (log searching, trace correlation, metric analysis). Engineers focus on the creative problem-solving humans excel at: designing fixes, making architectural decisions, improving resilience. Think of AI as the tireless junior engineer who does the grunt work so senior engineers can focus on high-leverage activities.
AI incident management in 2026 has moved beyond hype into production-grade reliability. The platforms that win are those that:
For teams managing modern cloud-native infrastructure, AI incident management isn't a luxury—it's a necessity. The operational complexity of distributed systems has outpaced human ability to manually investigate failures. AI closes that gap.
The question isn't whether to adopt AI incident management. It's whether your observability foundation can support it with the complete, high-quality data AI needs to deliver accurate results.
Ready to reduce MTTR by 90% and eliminate alert fatigue? OpenObserve Incidents delivers AI-powered incident management built on a full-fidelity observability foundation.
Get started:
Learn more:
Manas is a passionate Dev and Cloud Advocate with a strong focus on cloud-native technologies, including observability, cloud, kubernetes, and opensource. building bridges between tech and community.


