How to Export Azure Monitor Metrics using OpenTelemetry to OpenObserve

Simran Kumari
November 20, 2025
6 min read
Don’t forget to share!
Try OpenObserve Cloud today for more efficient and performant observability.
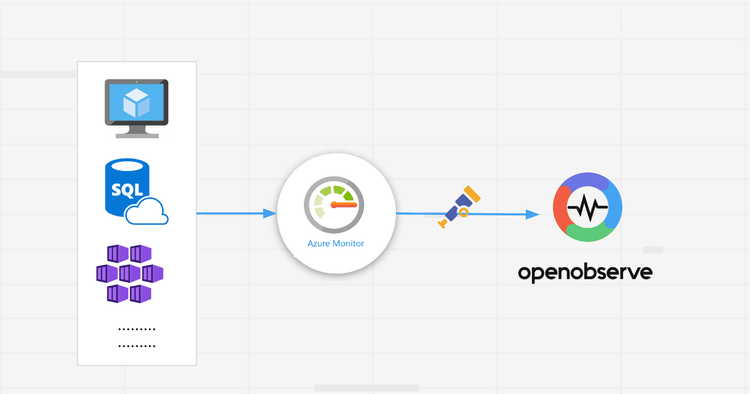
Using the OpenTelemetry Collector, you can collect metrics from Azure Monitor and export them directly to OpenObserve, an OpenTelemetry-native observability platform. Azure Monitor is great at capturing infrastructure and application-level metrics, but the data often stays siloed inside Azure.
This limits your ability to correlate metrics with logs, traces, and other signals across your broader environment.
This is where OpenObserve becomes extremely powerful. With OpenObserve’s OpenTelemetry-native ingestion, SQL/PromQL queries, and real-time dashboards, you can bring Azure Monitor metrics into a unified analytics layer, without paying for expensive proprietary pipelines.
If you want to jump straight into implementation, start at the Prerequisites section.
Azure Monitor can collect metrics from a wide set of Azure and hybrid environments. These metrics give deep visibility inside Azure, but the challenge is correlation. If your logs, traces, and external infrastructure live outside Azure , insights are incomplete.
Exporting metrics into OpenObserve solves this.
Exporting metrics out of Azure Monitor enables:
OpenTelemetry (OTel) is the open standard for collecting logs, metrics, and traces.It provides:
You will use the OpenTelemetry Collector to extract metrics from Azure Monitor and push them into OpenObserve.
A standalone service that:
It supports dozens of receivers, including the azuremonitor receiver used in this integration. The Azure Monitor receiver in OpenTelemetry Collector only supports metrics. For logs or events, consider using Diagnostic Settings → Event Hub and configure OpenTelemetry Collector accordingly.
Example receiver:
receivers:
  otlp:
    protocols:
      grpc:
      http:
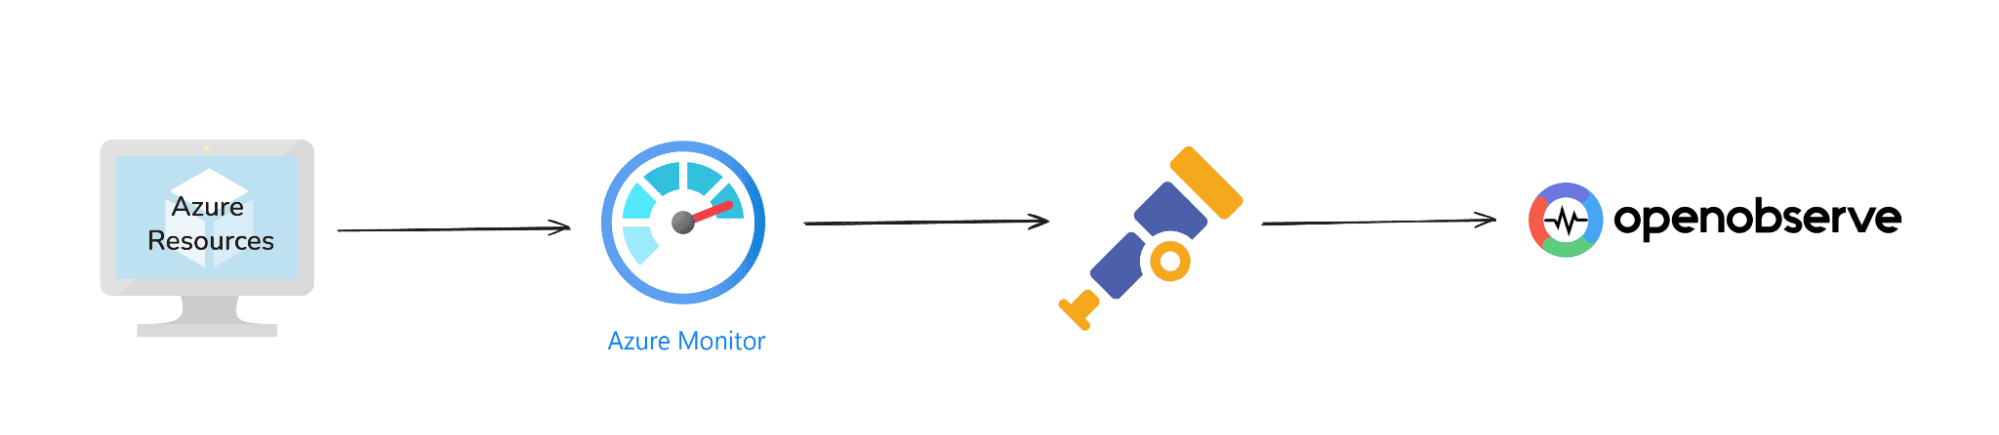
Here’s the high-level flow of how Azure Monitor metrics reach OpenObserve:
Before starting, ensure you have:
Note: Azure Monitor automatically collects standard metrics from most Azure resources. For additional or custom metrics/logs, you can enable Diagnostic Settings. Make sure the account or identity used to pull metrics has Reader access to the relevant resources.
You need a backend to receive and visualize the telemetry.
Easiest way to start: fully managed ingestion + storage + dashboards. Create a free account at https://cloud.openobserve.ai/ .
Supports Kubernetes, Docker Compose, or binary installation. Docs: OpenObserve Installation Guide
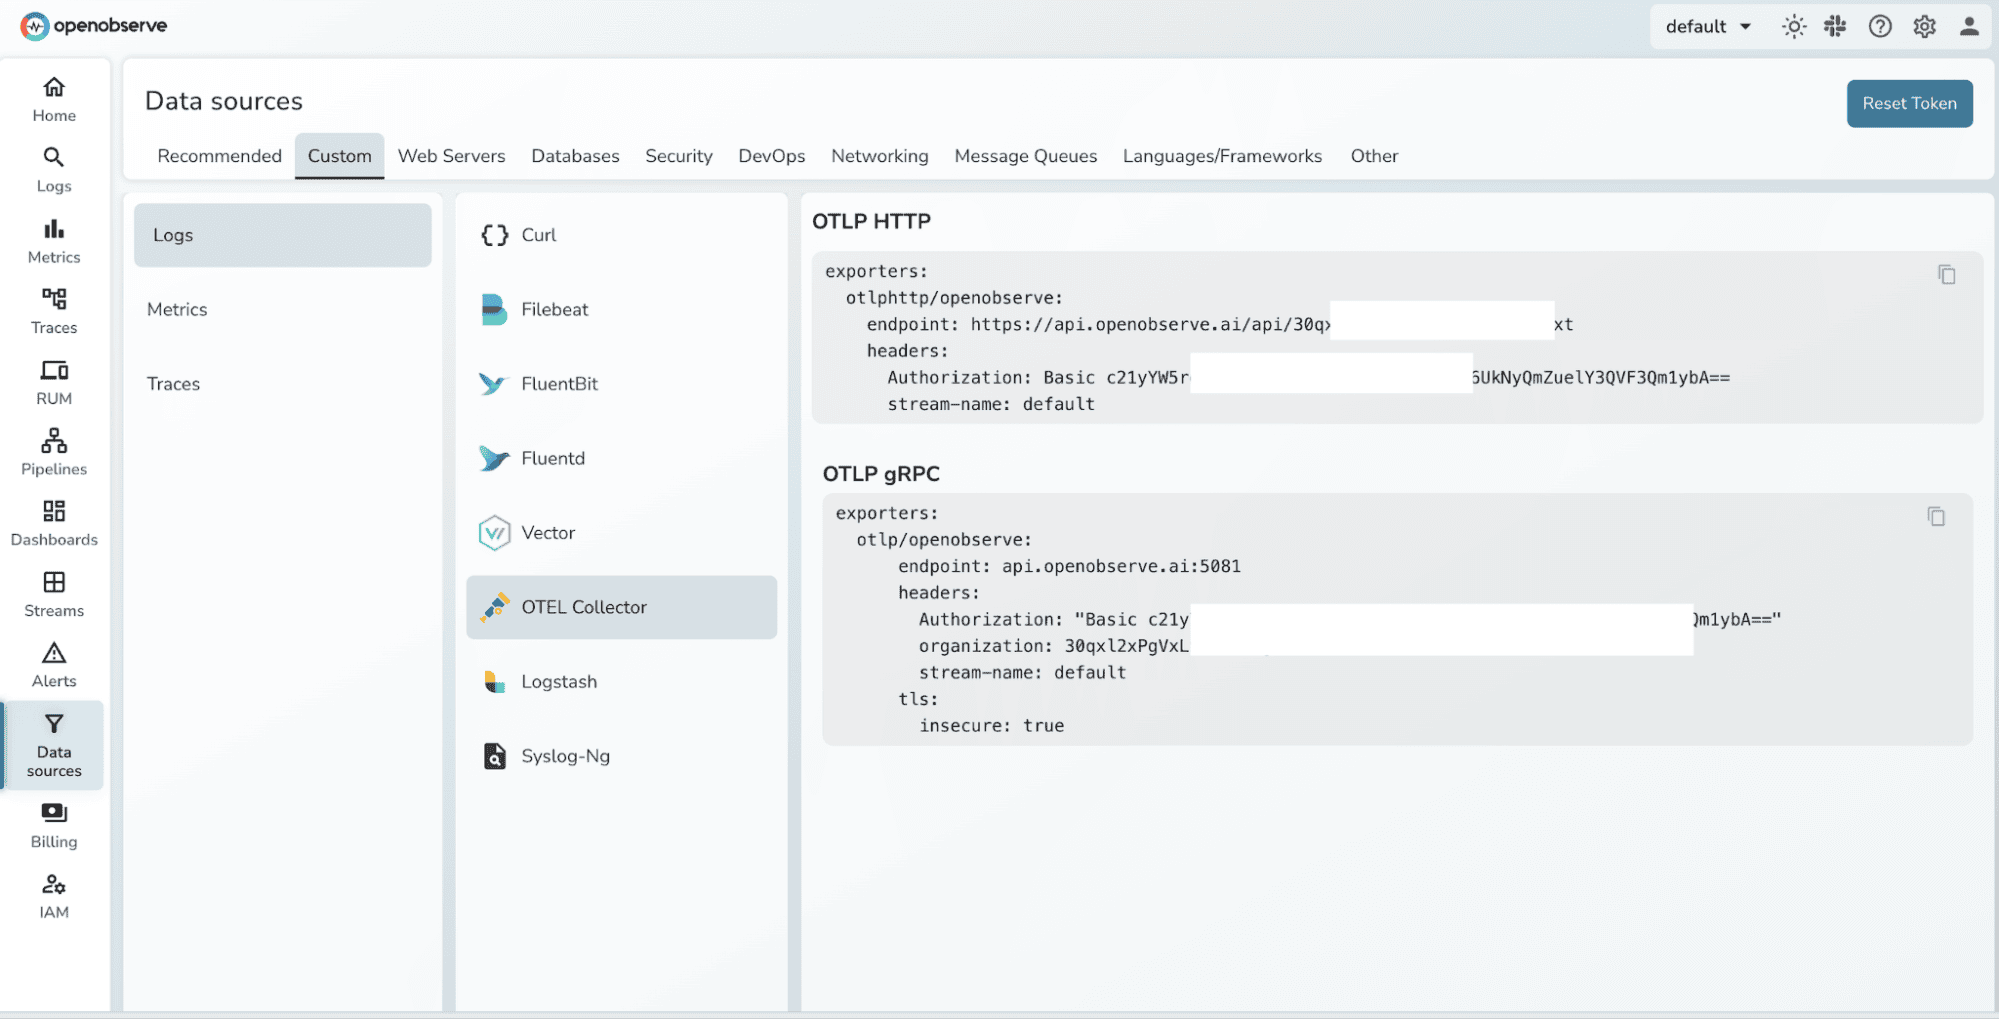
Once set up, you will use the OTLP / ingestion endpoint: https://<openobserve-host>/api/<ord_id>
You will also need your organization ID and API ingestion token from your OpenObserve console.
A Service Principal is an identity in Azure Active Directory (AAD) that can be used by applications or scripts.
az login az ad sp create-for-rbac \
--name "<sp-name>" \
--role Reader \
--scopes /subscriptions/<subscription-id>
<sp-name> → name of your SP (e.g., otel-collector-sp) <subscription-id> → your Azure subscription IDOutput example:
{
  "appId": "xxxx-xxxx-xxxx-xxxx",
  "displayName": "otel-collector-sp",
  "password": "xxxx-xxxx-xxxx-xxxx",
  "tenant": "xxxx-xxxx-xxxx-xxxx"
}
These values map directly to your OpenTelemetry Collector YAML:
receivers:
  azuremonitor:
    subscription_id: "<subscription-id>"
    tenant_id: "<tenant-id>"      # tenant
    client_id: "<appId>"          # appId
    client_secret: "<password>"   # password
You need the OTel Collector to pull the data from Azure Monitor and push it to OpenObserve. You can run the collector anywhere: locally, on an Azure VM, or inside a container, as long as it can reach the Event Hub.
It’s recommended to use containers for production scale environments.
1. Download the Collector (Binary)
For Linux/Ubuntu:
# Download latest contrib build
wget https://github.com/open-telemetry/opentelemetry-collector-releases/releases/latest/download/otelcol-contrib-linux-amd64.tar.gz

# Extract
tar -xvzf otelcol-contrib-linux-amd64.tar.gz
cd otelcol-contrib
This gives you the otelcol-contrib binary you can run directly.
Note: Use the contrib build, the regular OTel Collector doesn’t support these receivers.
2. Create a configuration file azure-to-o2.yaml:
receivers:
  azuremonitor:
    subscription_id: "<subscription-id>"
    tenant_id: "<tenant-id>"
    client_id: "<sp-appId>"       # if using Service Principal
    client_secret: "<sp-password>"
    resource_groups: ["<resource-group>"]
    collection_interval: 60s

exporters:
  otlphttp/openobserve:
    endpoint: "https://api.openobserve.ai/api/<orgid>"
    headers:
      Authorization: "Bearer <token>"

service:
  pipelines:
    metrics:
      receivers: [azuremonitor]
      exporters: [otlphttp]
3. Run the otel-collector :
./otelcol-contrib --config azure-to-o2.yaml
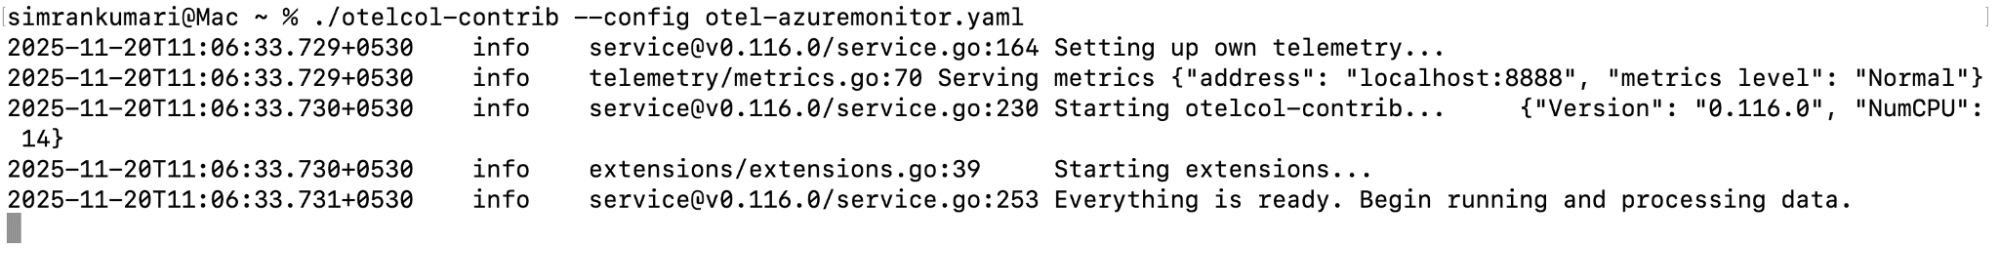
Once your OpenTelemetry Collector is running and sending Azure Monitor metrics, you can confirm that the data is reaching OpenObserve.
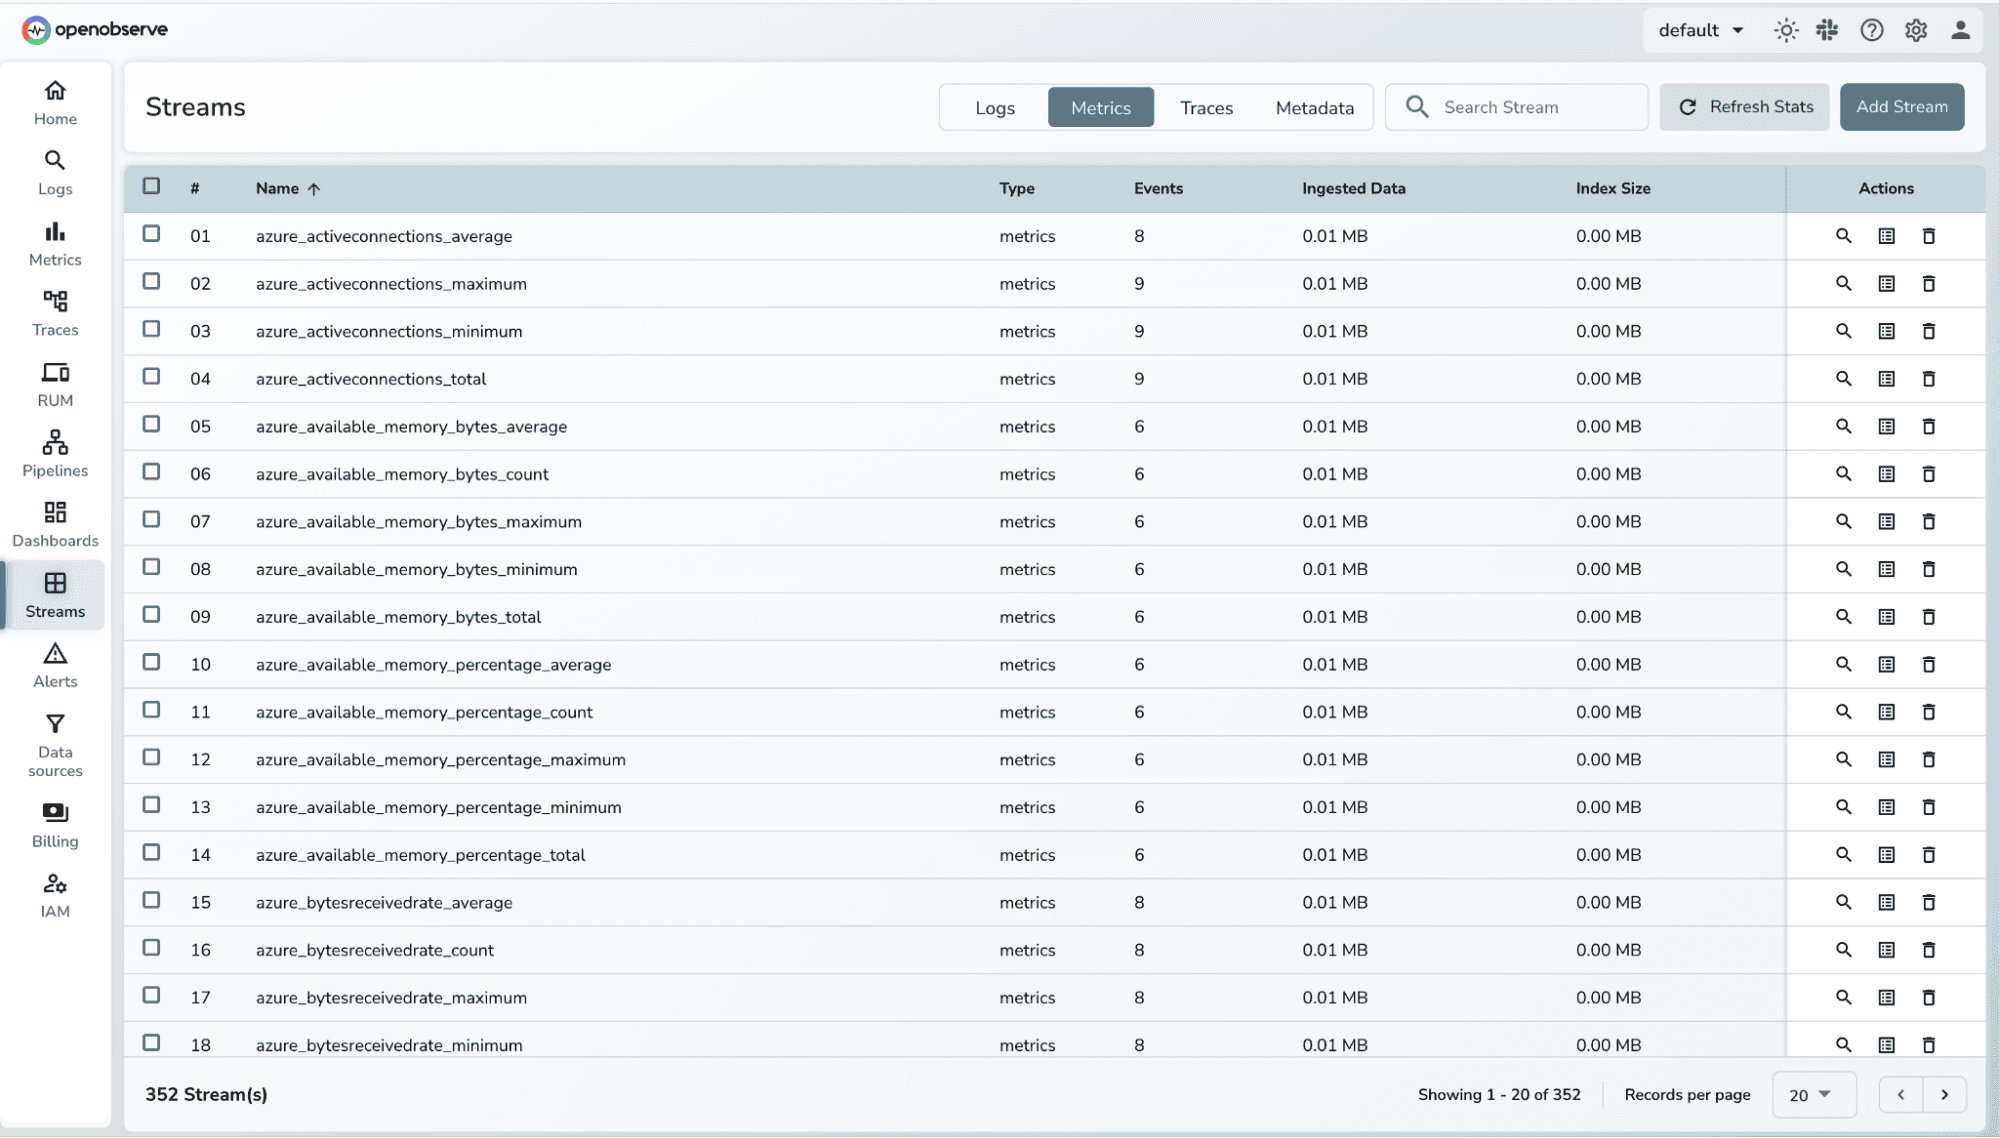
Navigate to OpenObserve → Streams.
In the Metrics section, you will see a list of metrics coming from Azure Monitor.Most metrics will have an Azure-specific tag, usually starting with azure_ (e.g., azure_vm_cpu_percent, azure_k8s_pod_count).
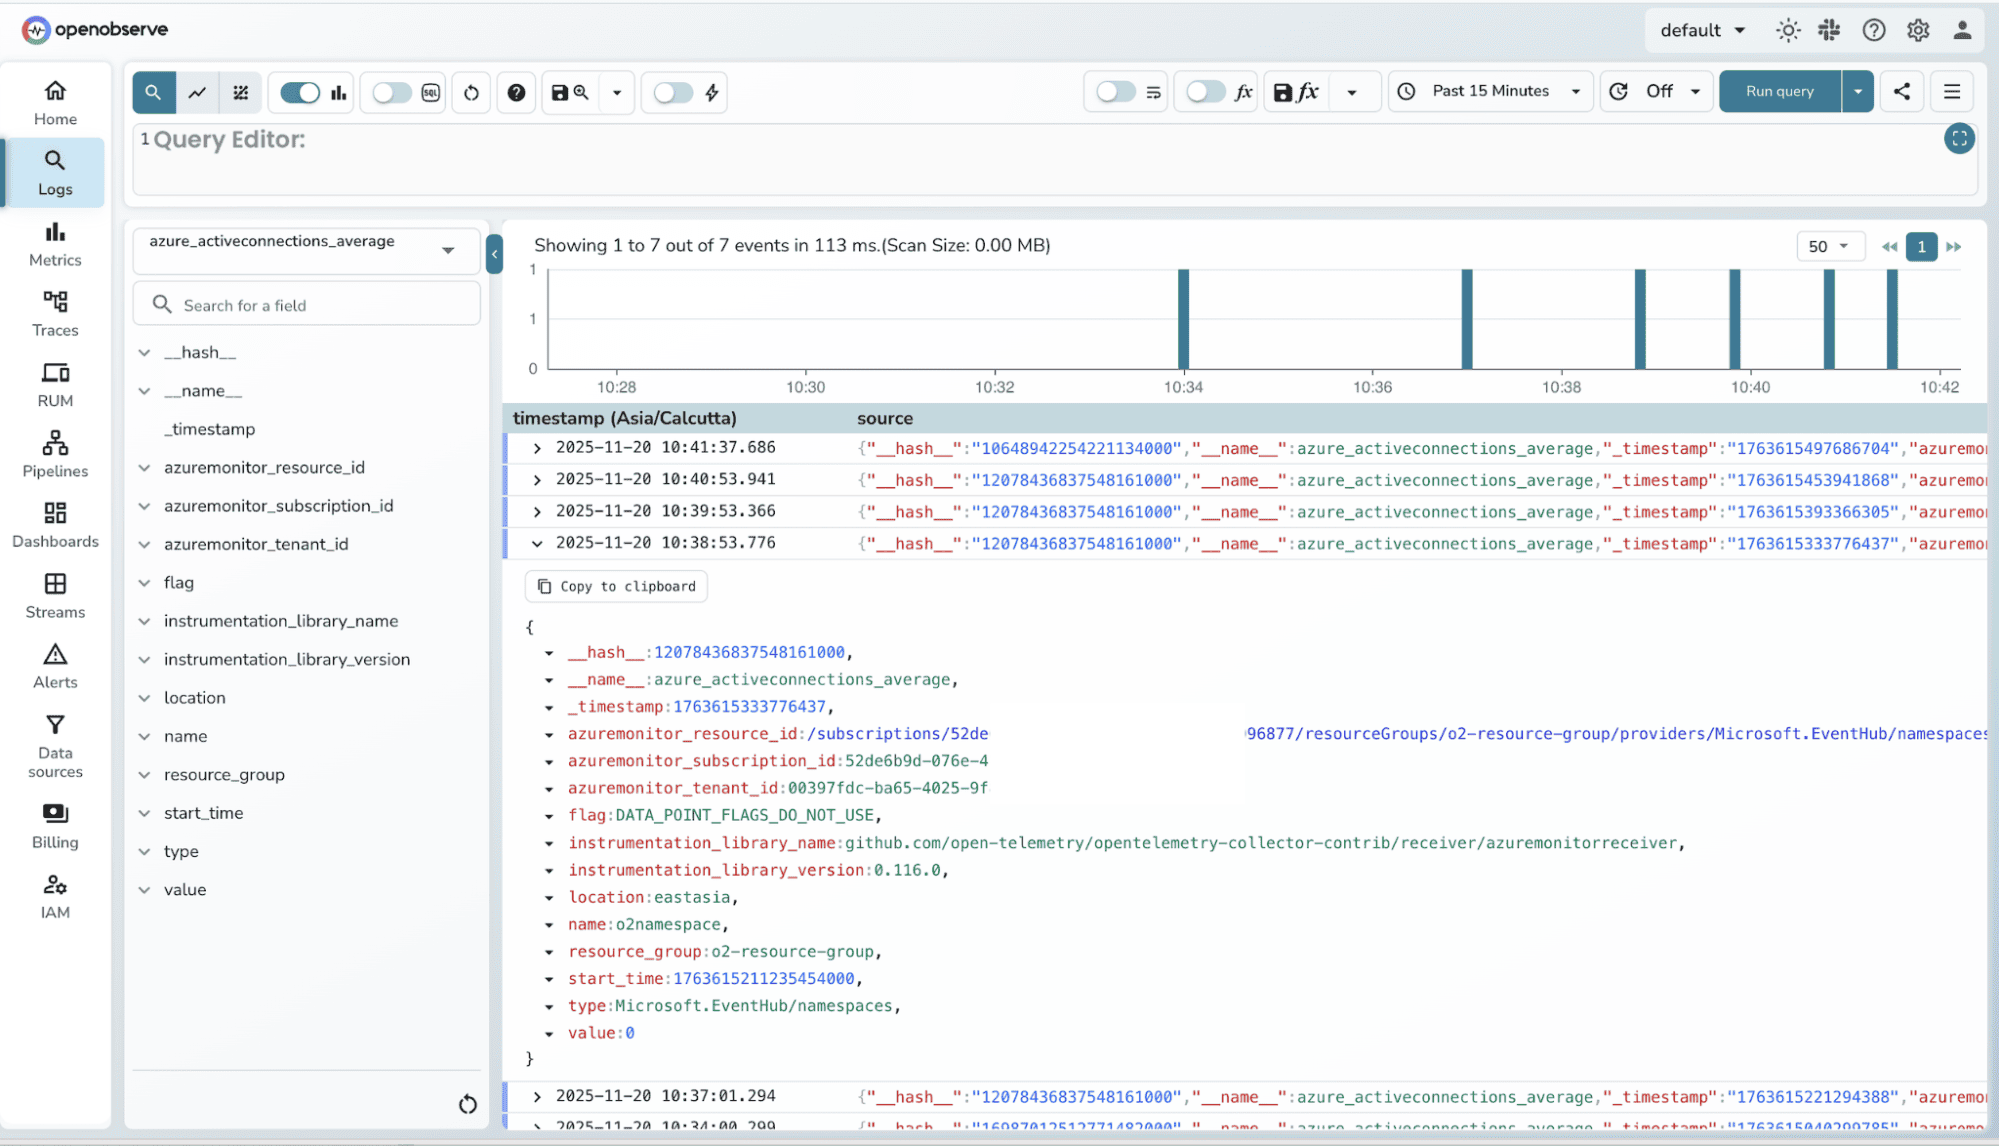
Click on any metric to explore events recorded for that metric. You can see the timestamps, values, and any associated metadata or tags.
Once verified, you can create visualizations for individual metrics. Use the Query Editorr to filter, aggregate, or transform metrics.
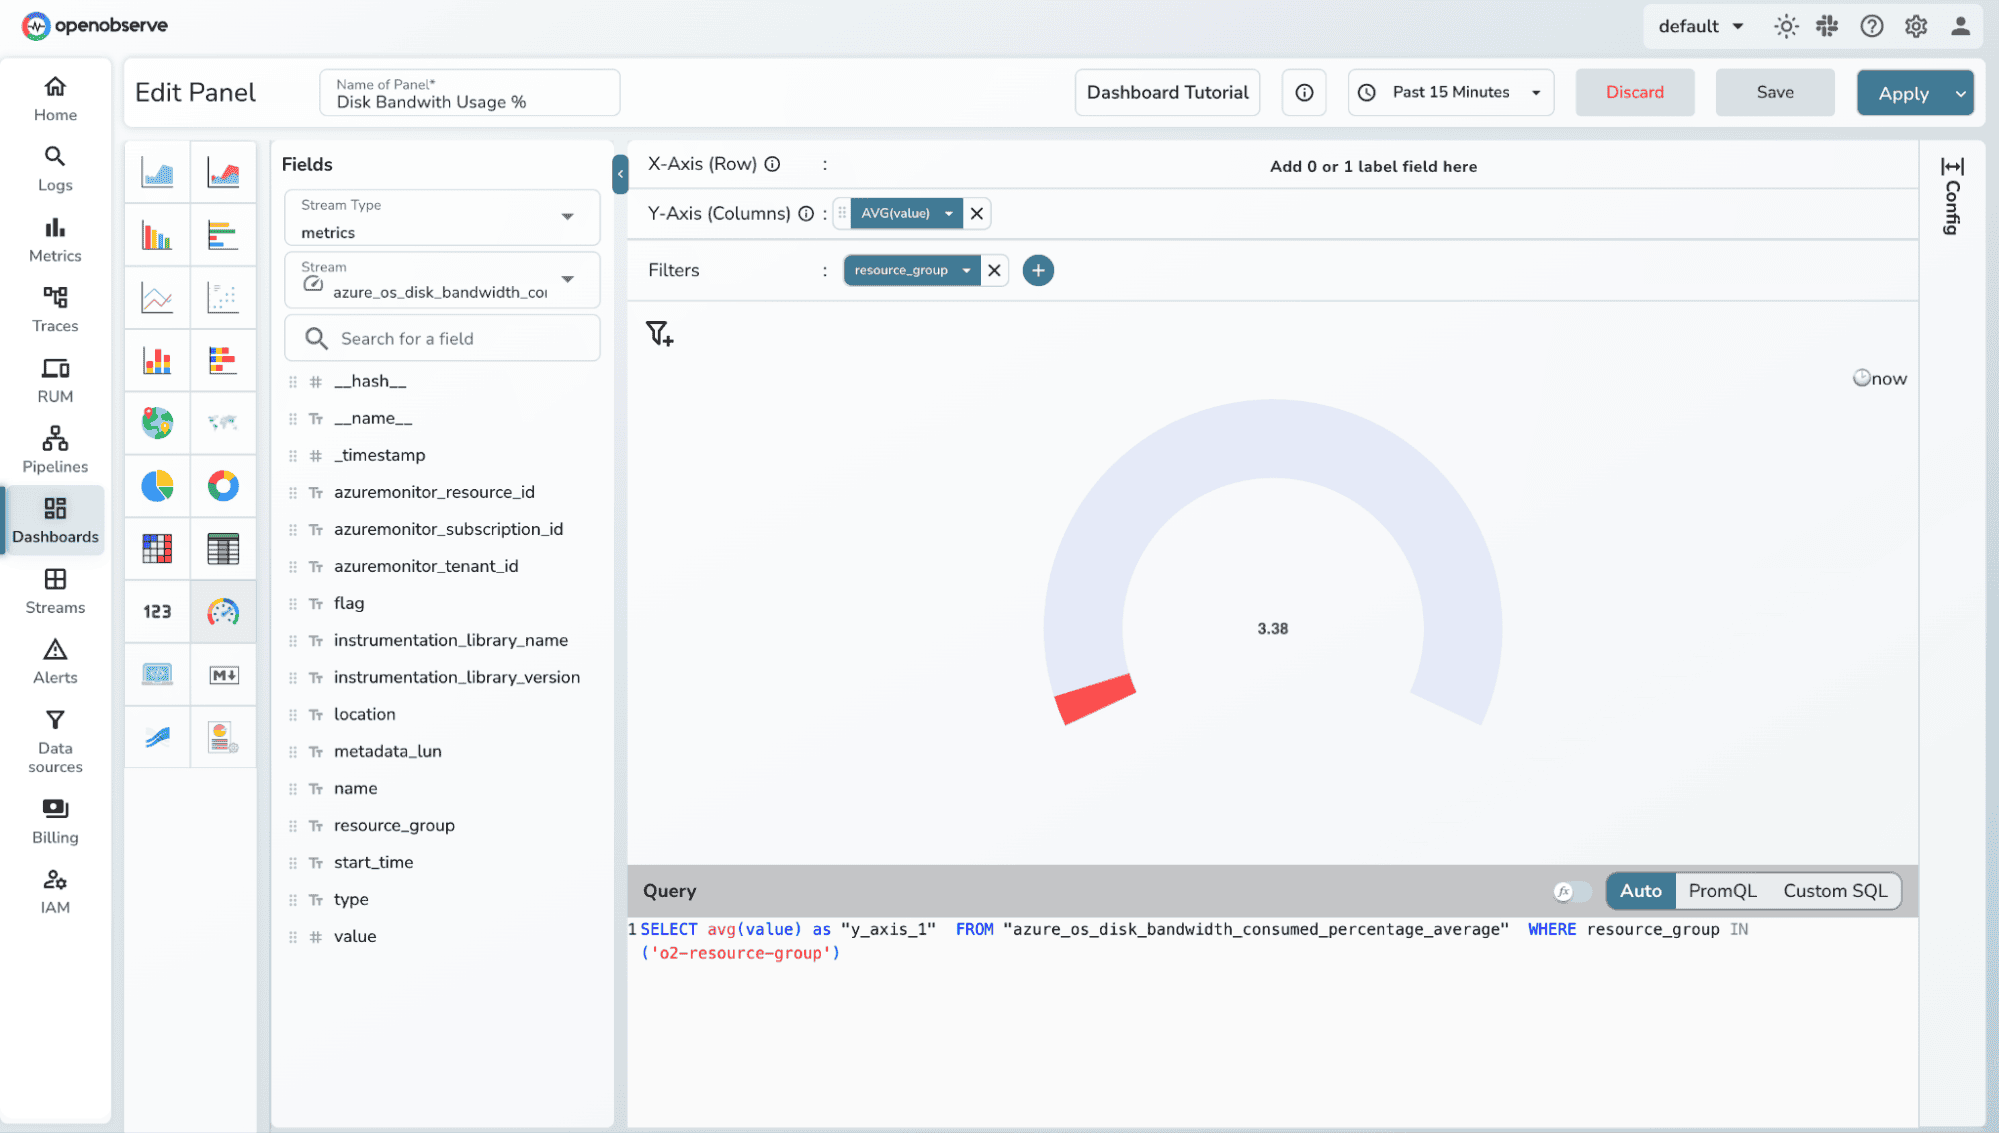
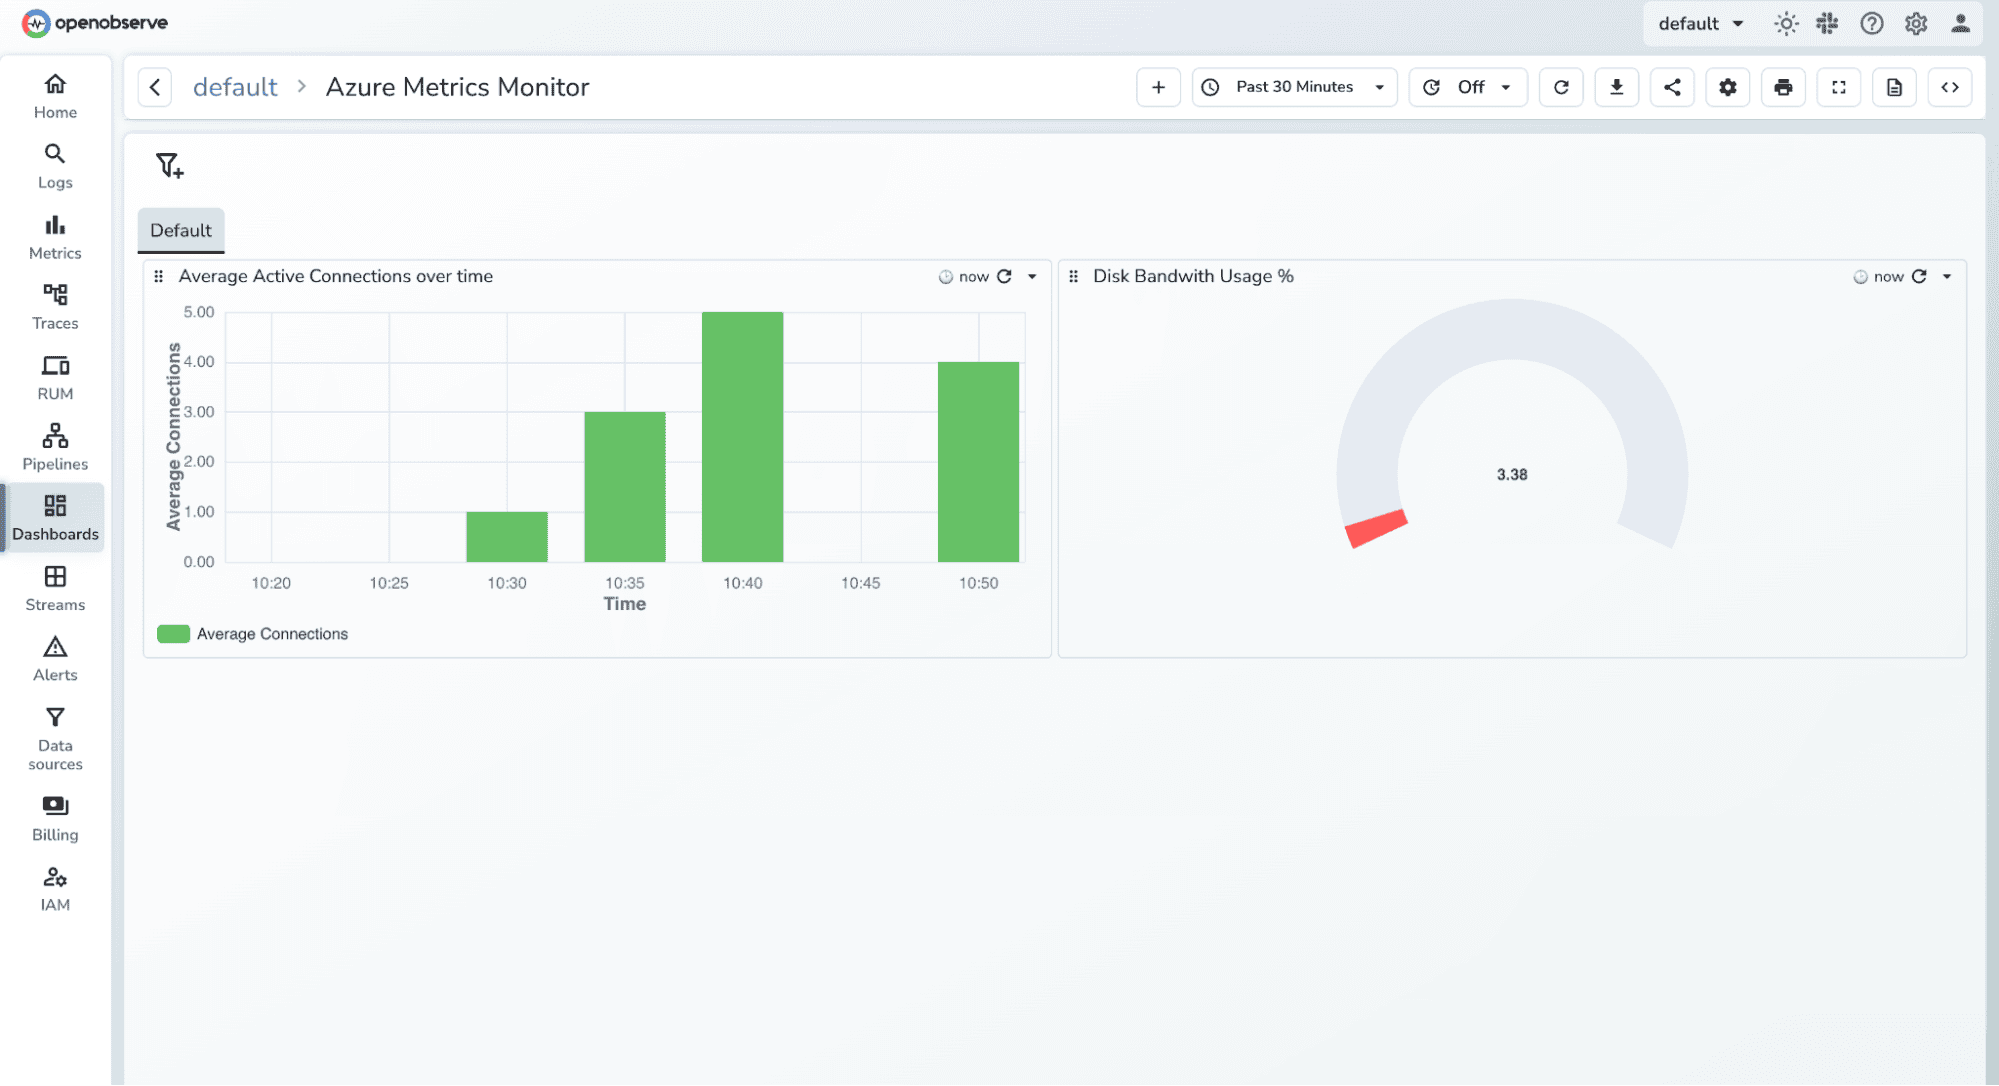
Add charts or panels to dashboards for monitoring CPU usage, memory, network throughput, and other metrics.
In this guide, we demonstrated how to export Azure Monitor metrics into OpenObserve using the OpenTelemetry Collector. By connecting Azure Monitor to OpenObserve, you can:
This integration empowers SREs, DevOps, and cloud engineers to have a single, vendor-neutral observability platform for end-to-end monitoring
Passionate about observability, AI systems, and cloud-native tools. All in on DevOps and improving the developer experience.


