Best Log Visualization Tools in 2026

Manas Sharma
March 16, 2026
11 min read
Don’t forget to share!
Try OpenObserve Cloud today for more efficient and performant observability.
Quick answer: The best log visualization tools in 2026 are OpenObserve, Kibana (Elastic Stack), Grafana + Loki, Datadog Logs, and Splunk. OpenObserve stands out by combining traditional dashboards with a built-in AI assistant (O2 Assistant) that lets you query, correlate, and visualize logs in plain English — no query language required.
Most log tools can search. The best ones let you understand.
There's a significant gap between tools that dump raw log lines into a text box and tools that give engineers a genuinely fast path from alert → root cause → fix. The features that separate them:
That last capability is no longer a differentiator reserved for premium enterprise tiers. In 2026, it's becoming table stakes — and it's the angle this guide focuses on.
| Tool | AI-Assisted Analysis | Open Source | Deployment | Best For |
|---|---|---|---|---|
| OpenObserve | O2 Assistant + MCP | ✅ | Self-hosted / Cloud | Full-stack observability with AI |
| Kibana (Elastic) | Partial (ML add-on) | ✅ | Self-hosted / Cloud | Full-text search, complex pipelines |
| Grafana + Loki | Partial (plugin) | ✅ | Self-hosted / Cloud | Prometheus-native teams |
| Datadog Logs | Watchdog AI | ❌ | SaaS | Managed, all-in-one observability |
| Splunk | Splunk AI | ❌ | Self-hosted / Cloud | Enterprise SIEM & security analytics |
OpenObserve is the only tool in this list where AI-assisted log analysis is native, not bolted on. Its O2 Assistant is deeply integrated into the platform — a full observability co-pilot that understands your data schema, your running queries, and your infrastructure topology.
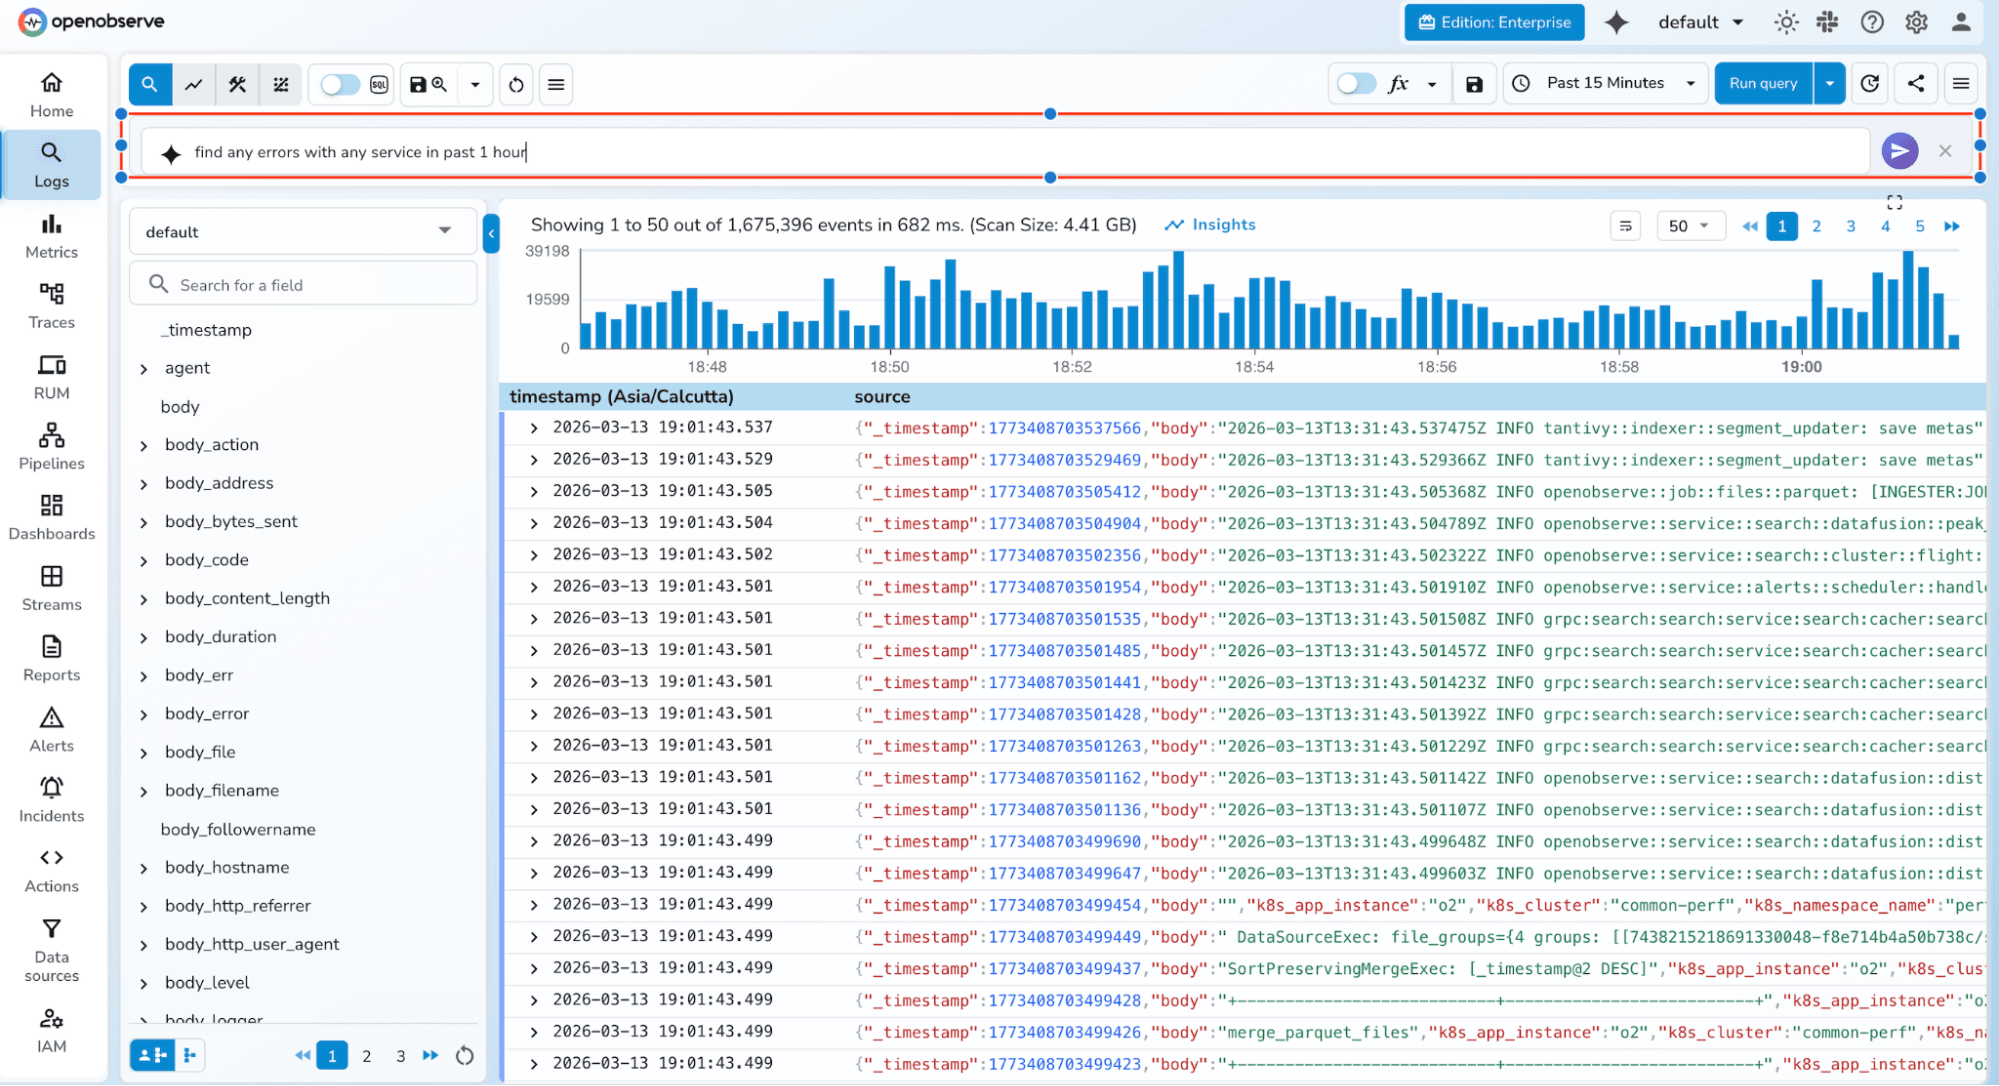
Traditional log visualization requires you to already know what to look for. You open a dashboard, adjust time ranges, write a query, and hope the chart reveals something. With O2 Assistant, the workflow inverts:
You describe the problem. The tool finds the evidence.
"Show me error rate spikes in the payment service over the last 6 hours,
 correlated with any upstream database latency."
O2 Assistant translates that into SQL, PromQL, or a VRL transformation — whichever is appropriate — executes it, and returns results you can immediately drill into or save as a dashboard panel.
Natural language to query translation Describe what you want in plain English. O2 Assistant generates SQL queries, PromQL expressions, or VRL transformation scripts. No learning curve for new team members. No copy-pasting from documentation during an incident.
Cross-telemetry correlation in one thread Logs, metrics, and traces are all queryable in the same conversation. Ask about a log anomaly, then immediately ask what the corresponding CPU metrics looked like — the assistant maintains context across the entire incident thread.
Create dashboards and alerts from a prompt Using OpenObserve's MCP (Model Context Protocol) server, you can generate complete dashboards, panels, and alert conditions from a single natural language prompt. No clicking through a form wizard.
"Create a dashboard showing 5xx error rate, p99 latency, and
 active pod count for the checkout service."
The dashboard is created in seconds. The MCP tooling handles the entire API interaction.
Ad-hoc incident investigation without a dashboard This is the most underappreciated capability. During a 2 AM incident, you don't want to hunt for the right pre-built dashboard. You want to ask questions. O2 Assistant turns any log stream into an interactive investigation — no pre-configured panels required.
Beyond the AI layer, OpenObserve's dashboard UI is production-grade:
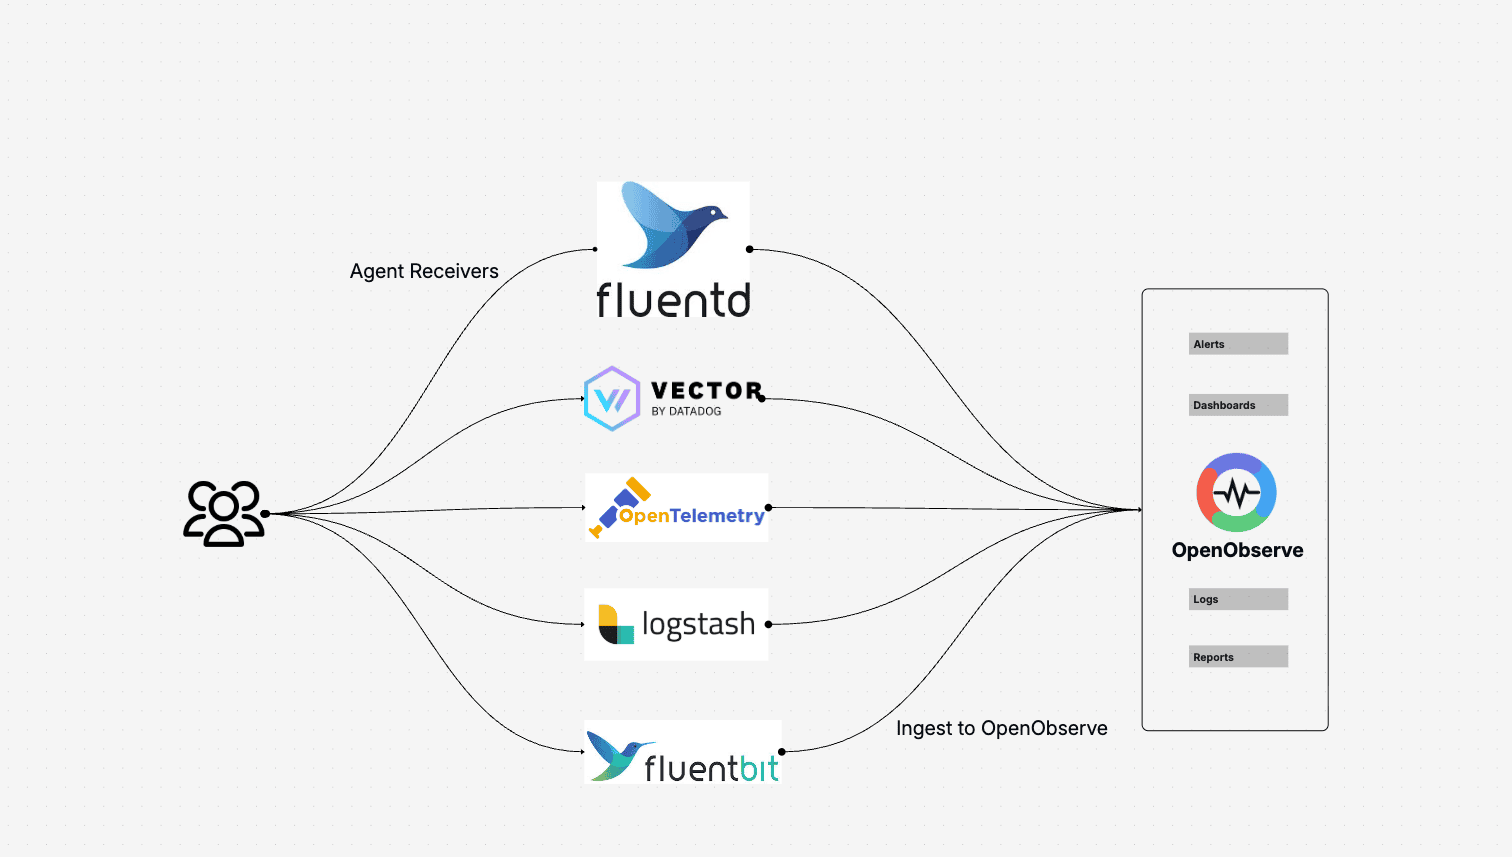
One of the most practical things about OpenObserve is that you don't have to change your existing logging pipeline. It supports all the heavy hitters — Fluent Bit, Vector, Logstash, Filebeat, and OpenTelemetry collectors — so you can repoint your existing log shippers and be ingesting into OpenObserve in minutes.
Beyond ingestion, OpenObserve ships a built-in visual pipeline editor with over 100 VRL (Vector Remap Language) functions. You can parse, enrich, redact sensitive fields, and reshape log structures on the fly — before data ever hits storage — all without writing a separate pipeline config file or deploying an additional service.
OpenObserve is also built on open standards: OTLP for ingestion, SQL and PromQL for queries, S3-compatible object storage for the backend. You're not locked into a proprietary format at any layer. Deploy it yourself and own your data entirely, or use OpenObserve Cloud if you'd rather skip the infrastructure work. Your data, your infrastructure, your choice.
OpenObserve Cloud — Sign up for a 14-day free trial, no credit card required. You'll have a fully functioning observability stack — logs, metrics, traces, dashboards, and O2 Assistant — ready the moment you sign up.
Self-hosted — Download a single binary and run it. No cluster to provision, no dependencies to install. For teams running Kubernetes, production-grade HA deployment is available via the official Helm charts in under 10 minutes.
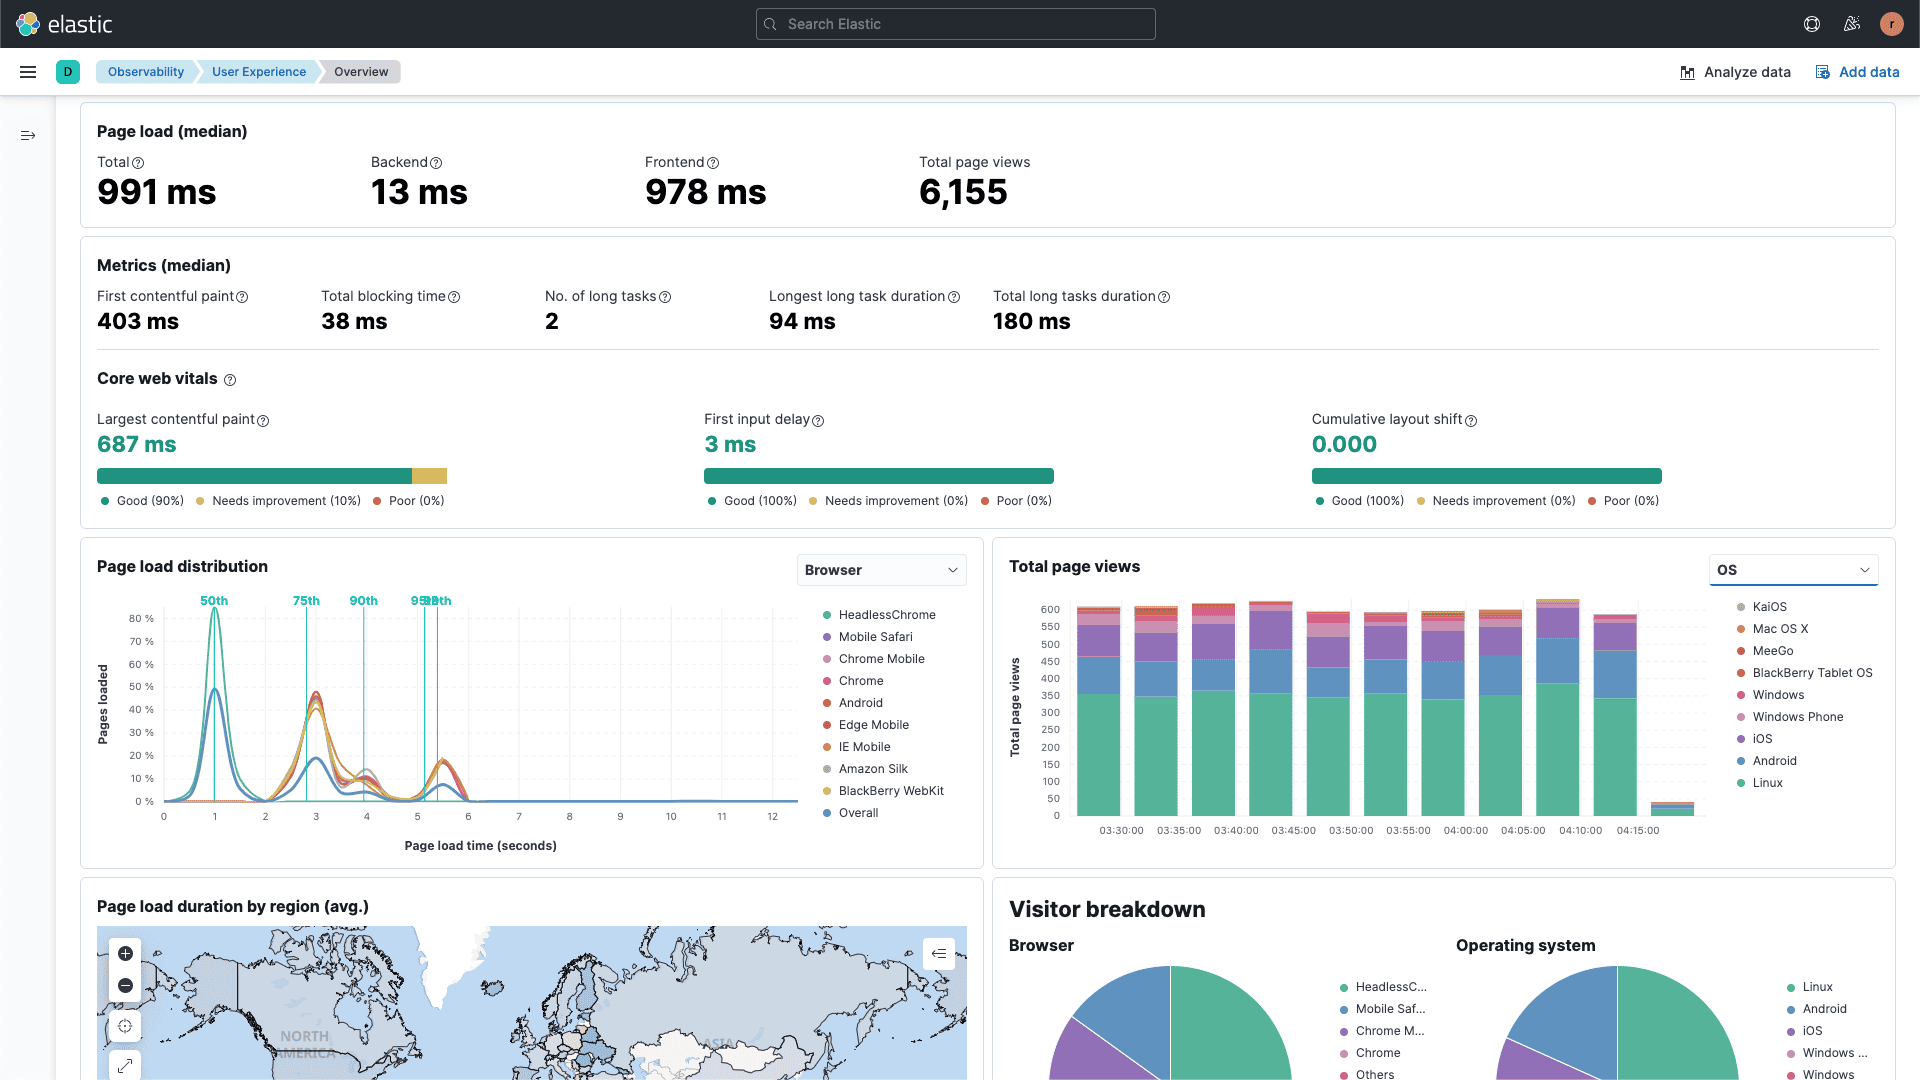 Kibana remains the reference implementation for log dashboards built on top of inverted-index search. Its Lens visualization engine, Discover view for raw log exploration, and deep integration with Elasticsearch's ML features make it the strongest choice when your primary requirement is flexible full-text search across unstructured log content.
Strengths for visualization:
Where it falls short in 2026: Kibana's AI features are available but require the Elastic ML add-on and significant configuration. There's no conversational interface for incident investigation. Drill-down from dashboard to logs works, but the path from "I see an anomaly" to "I understand why" still requires you to write KQL (Kibana Query Language).
Resource cost is also a real consideration: Elasticsearch clusters are RAM-hungry at scale, and operational complexity is high compared to newer tools.
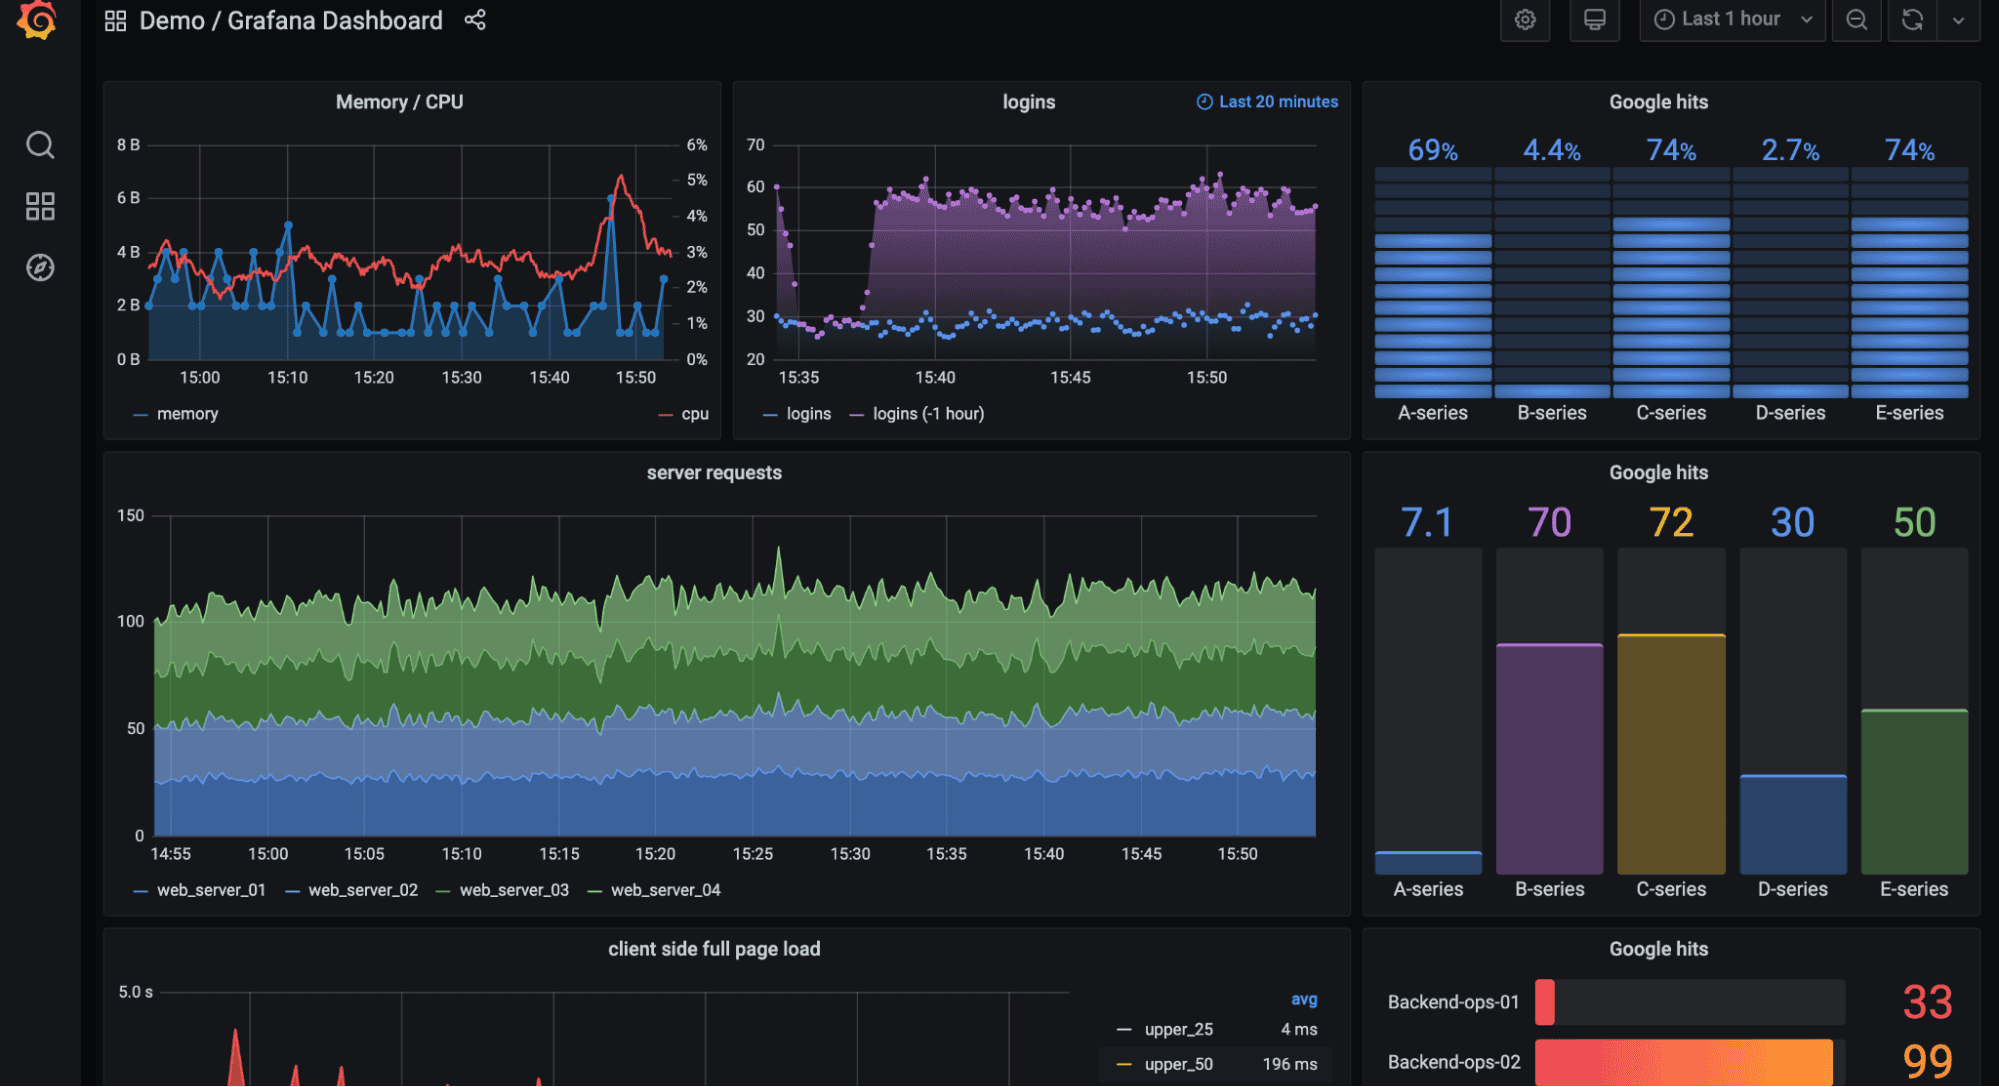
Grafana is arguably the most widely deployed dashboard platform in the world for infrastructure metrics. With Loki as the log backend, teams already invested in Prometheus get a native log visualization layer that uses the same label model, the same alerting rules, and the same dashboard panels.
Strengths for visualization:
Where it falls short: Loki only indexes labels — not the full log content. Ad-hoc full-text search over unstructured logs is slow and expensive. Grafana's AI features (via the Grafana Assistant plugin) are improving but not yet integrated at the depth of OpenObserve's O2 Assistant. You also need to manage Loki and Grafana as separate services.
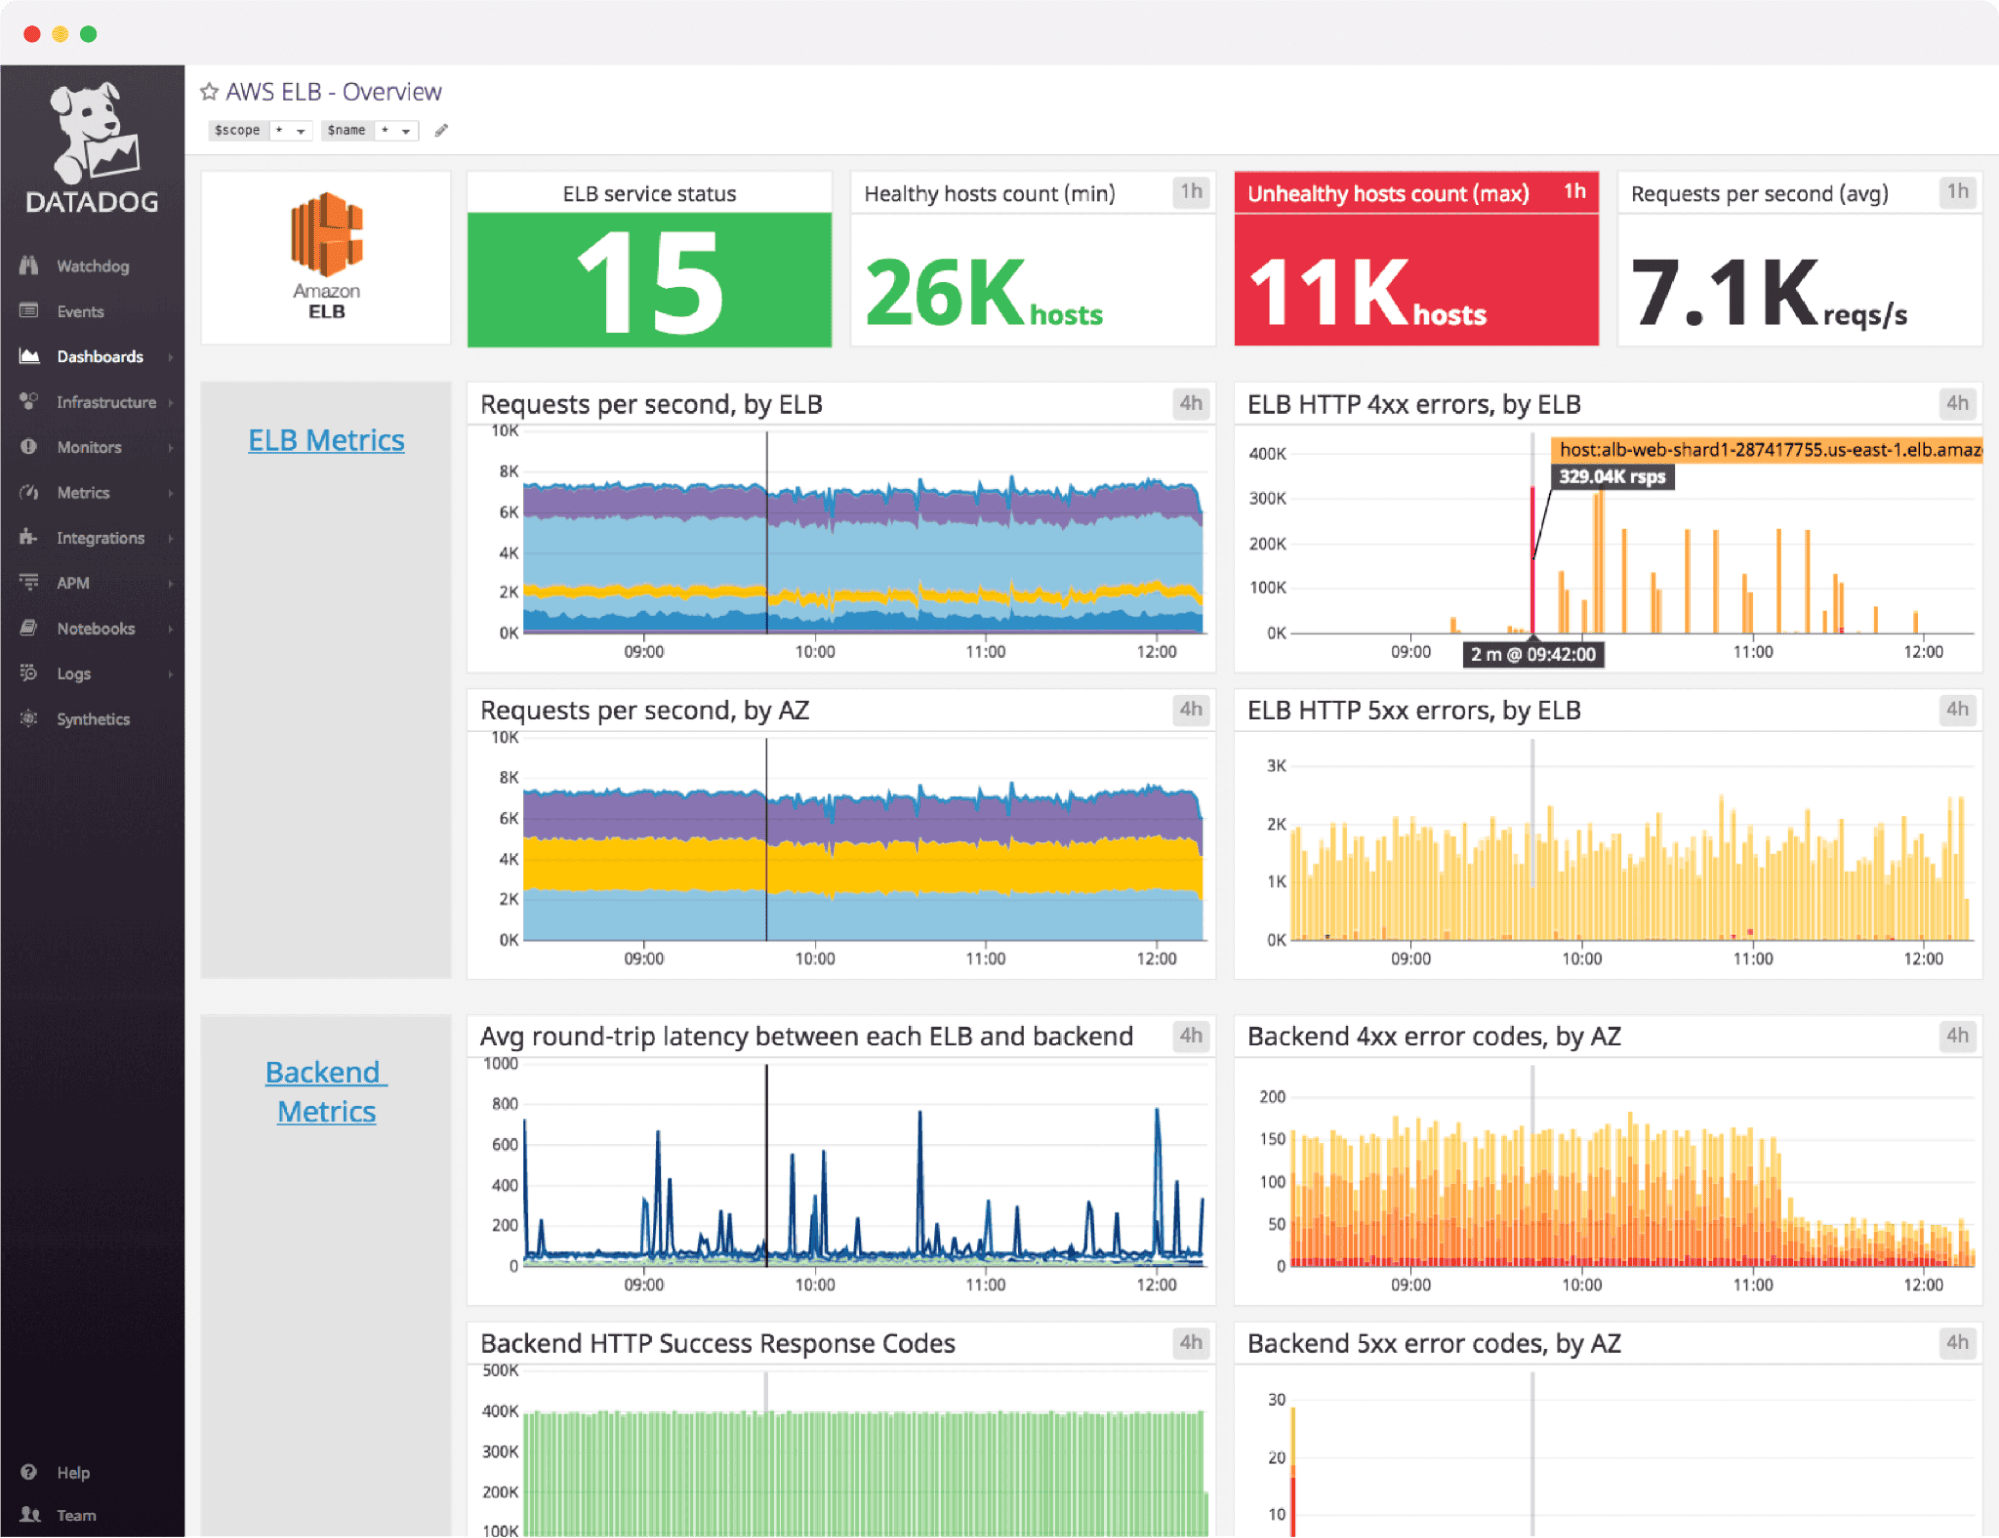
Datadog's log visualization is polished, deeply integrated with its APM and infrastructure monitoring, and requires zero operational overhead. The Log Explorer supports pattern clustering, live tail, and one-click correlation between a log line and its associated distributed trace — capabilities that took years to mature and still lead the SaaS category.
Watchdog, Datadog's ML engine, surfaces anomalies automatically in dashboards without manual threshold configuration. For teams that want AI-assisted alerting without managing any infrastructure, it's the benchmark.
The tradeoff: Cost scales aggressively. At high log volumes, Datadog's pricing model becomes the primary engineering constraint — teams regularly reduce logging verbosity or implement aggressive sampling just to control bills. There's no self-hosted option.
Splunk's visualization layer — built on SPL (Search Processing Language) and a mature dashboard framework — is powerful for security operations teams that need complex analytical queries, compliance reporting, and forensic investigation capabilities. Its AI features (Splunk AI) are increasingly integrated into the investigation workflow.
For pure log visualization in an application observability context, Splunk is overengineered and overpriced. For enterprise SIEM workloads where log visualization is part of a broader security analytics platform, it remains the established standard.
The traditional log visualization workflow assumes you already know what to look at. You build dashboards in advance, configure alerts for known failure modes, and use saved queries for recurring investigations. This works well in stable environments where you've seen every failure mode before.
It breaks down during novel incidents — the kind where you don't know what you're looking for, where the problem spans multiple services and telemetry types, and where the fastest path to resolution is exploratory rather than structured.
AI-assisted log analysis changes this fundamentally. When you can describe a symptom in plain English and receive a structured query, a correlated view across logs and metrics, and a draft alert condition — all without leaving a chat interface — the speed of incident investigation changes by an order of magnitude.
This is why OpenObserve's O2 Assistant and MCP integration represent a meaningfully different category, not just a feature check-box. The ability to generate dashboards, panels, and alerts from a prompt during an active incident — rather than after the postmortem — is a new kind of capability.
The best log visualization tool depends on your requirements. OpenObserve leads for teams that want AI-assisted log analysis, low storage costs, and a full observability stack (logs, metrics, traces) in a single open-source platform. Datadog leads for fully managed, cost-is-not-a-constraint deployments. Grafana + Loki leads for Prometheus-native Kubernetes teams.
AI-assisted log analysis lets engineers query log data using natural language instead of a specialized query language. Instead of writing SQL or KQL to find error patterns, you describe the problem in plain English. Tools like OpenObserve's O2 Assistant translate the description into the correct query, execute it, and return structured results — significantly reducing investigation time during incidents.
Yes, with OpenObserve's MCP (Model Context Protocol) server, you can generate complete dashboards, panels, and alert conditions from a single natural language prompt. Other tools like Datadog and Splunk have AI-assisted dashboard creation in early stages, but OpenObserve's MCP integration is currently the most complete implementation for open-source deployments.
OpenObserve has the lowest storage cost among full-featured log visualization tools — approximately 140× lower storage cost than ELK deployments due to its S3-native architecture. Grafana Loki is also low-cost for well-structured, labeled log streams but is slower for full-text search. Among SaaS tools, New Relic offers the most generous free tier (100GB/month).
Yes. OpenObserve is OpenTelemetry-native. It accepts logs, metrics, and traces via the OTLP protocol and also supports Fluent Bit, Vector, Filebeat, and direct HTTP ingestion. The O2 Assistant can query all three telemetry types in a single conversation thread.
Log management covers collection, ingestion, storage, indexing, retention, and alerting. Log visualization refers specifically to the dashboard and query interface layer — how you explore and understand log data visually. Most modern tools (OpenObserve, Datadog, Splunk) cover both. Grafana is a pure visualization layer typically paired with Loki or another backend for storage.
Manas is a passionate Dev and Cloud Advocate with a strong focus on cloud-native technologies, including observability, cloud, kubernetes, and opensource. building bridges between tech and community.


