From Elasticsearch (ELK) to OpenObserve Streamlining Log Management


Try OpenObserve Cloud today for more efficient and performant observability.

Managing ELK's index-based architecture can become increasingly difficult as log volumes grow, leading to scalability challenges. OpenObserve, with its stream-based architecture, offers a more efficient solution by handling high ingestion rates with less overhead.
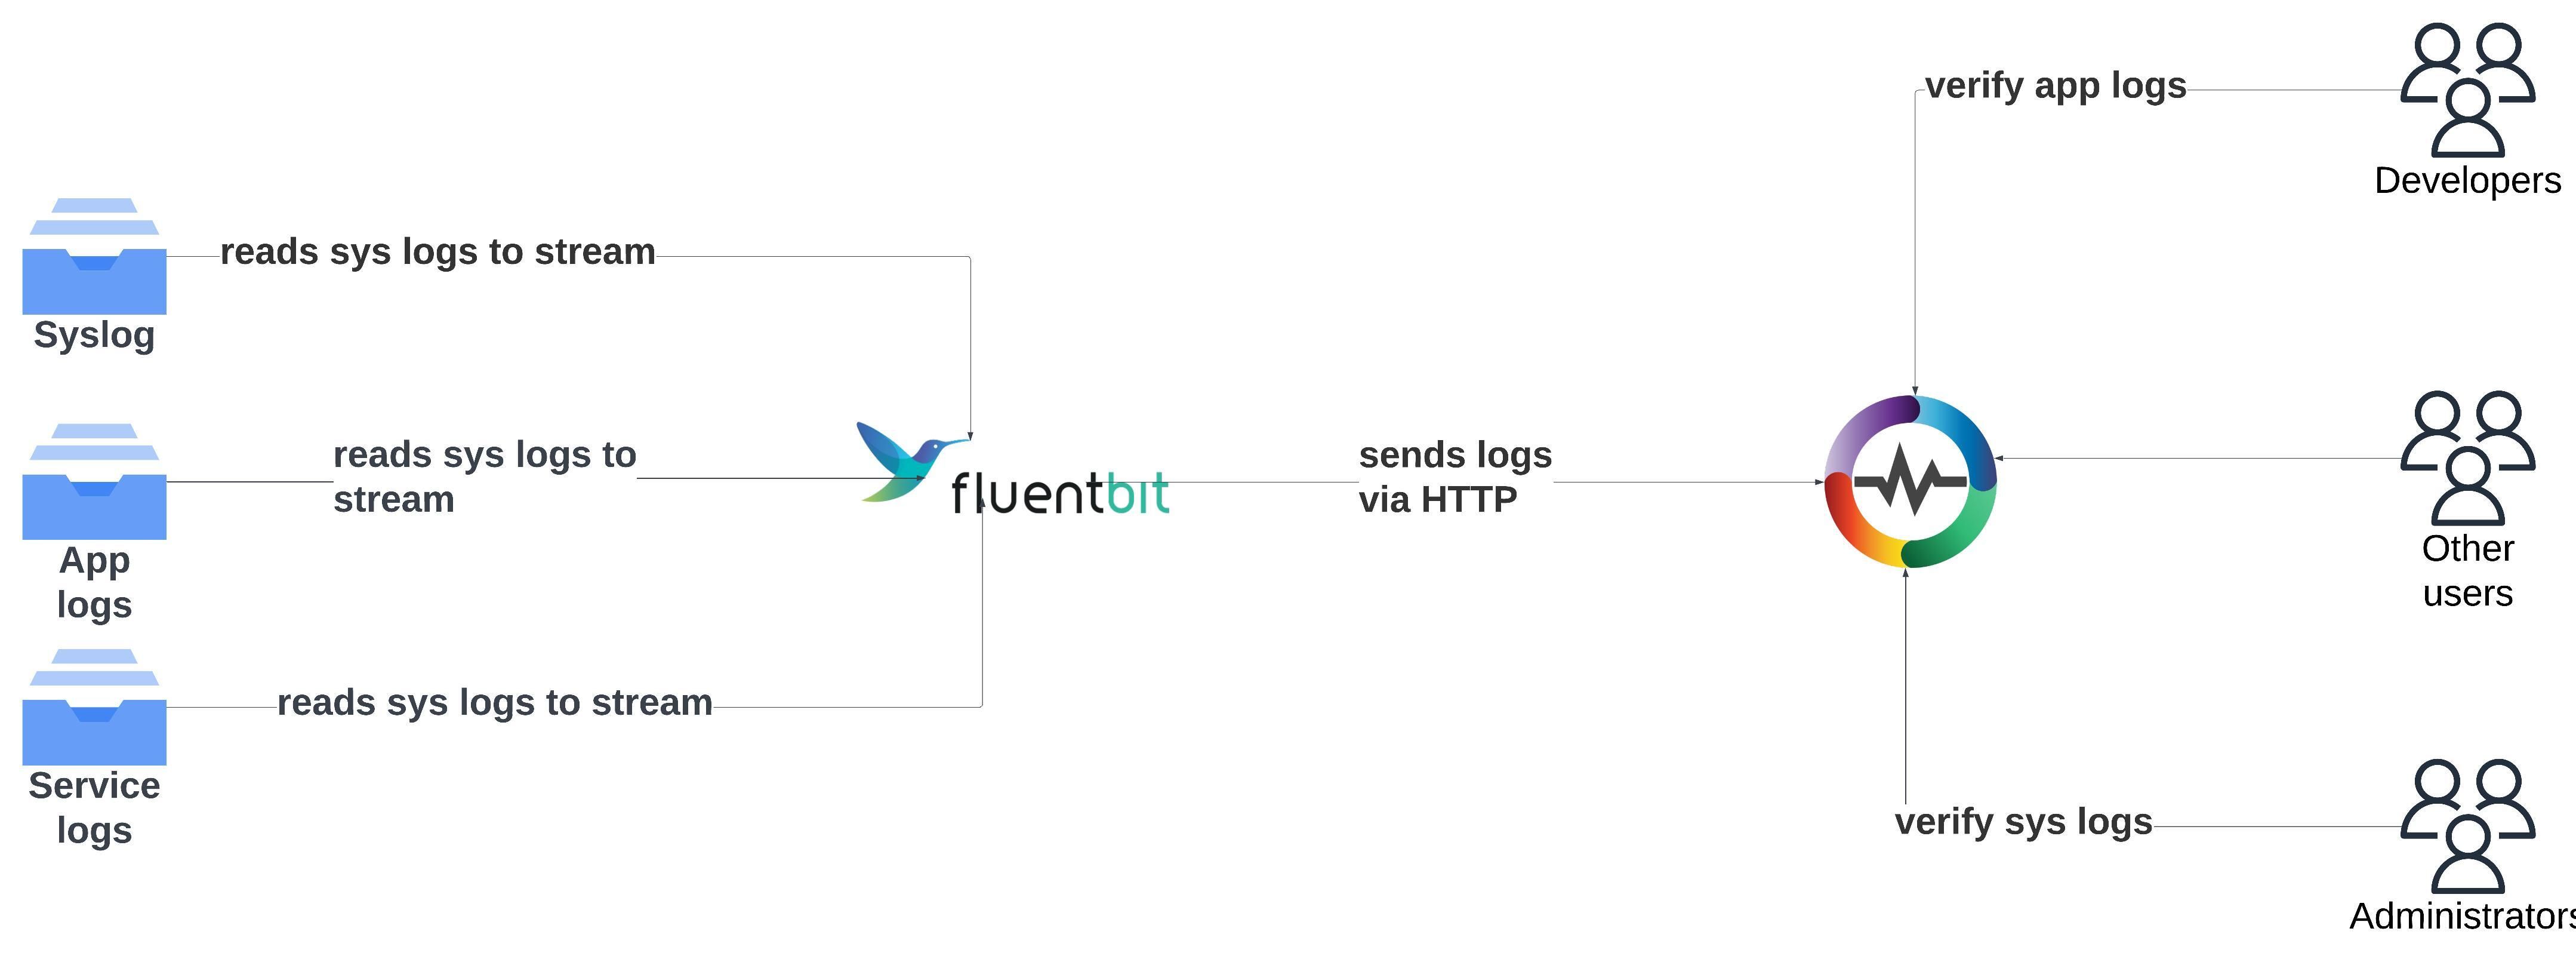
Migration from ELK stack to OpenObserve will involve setting up a different log forwarder like vector, fluent bit, or otel-collector. You would not migrate your existing log data from Elasticsearch to OpenObserve as log data has a retention period (anything from 1 day to typically 30 days). The following is what you would do at high level:
To migrate seamlessly, configure Fluent Bit (or other forwarders https://openobserve.ai/docs/ingestion/) to ingest logs directly into OpenObserve from the start. This approach allows you to view logs instantly in OpenObserve without needing Elasticsearch, benefiting from faster searches, simpler management, and lower infrastructure costs compared to ELK.

Let's set up ELK locally using Docker. We’ll use Docker Compose to bring up Elasticsearch, Logstash, and Kibana. Follow these steps:
Copy the below file as it has been tested thoroughly.
version: '3'
services:
  elasticsearch:
    image: docker.elastic.co/elasticsearch/elasticsearch:8.9.0
    container_name: elasticsearch
    environment:
      - discovery.type=single-node
      - "ES_JAVA_OPTS=-Xms512m -Xmx512m"
      - xpack.security.enabled=false
    ports:
      - "9200:9200"
    networks:
      - elk

  logstash:
    image: docker.elastic.co/logstash/logstash:8.9.0
    container_name: logstash
    ports:
      - "5044:5044"
    environment:
      LS_JAVA_OPTS: "-Xms256m -Xmx256m"
    volumes:
      - ./logstash.conf:/usr/share/logstash/pipeline/logstash.conf
      - /tmp/test.log:/var/log/system.log:ro
    networks:
      - elk

  kibana:
    image: docker.elastic.co/kibana/kibana:8.9.0
    container_name: kibana
    ports:
      - "5601:5601"
    environment:
      ELASTICSEARCH_HOSTS: "http://elasticsearch:9200"
    networks:
      - elk

networks:
  elk:
    driver: bridge
The logs here will only be read and an index would be created if you have ingested demo logs to /tmp/test.log in the above step.
input {
  file {
    path => "/var/log/system.log"
    start_position => "beginning"
    sincedb_path => "/dev/null"  # Avoids tracking file read position
  }
}

output {
  elasticsearch {
    hosts => ["http://elasticsearch:9200"]
    index => "system-logs"
    data_stream => "false"
  }
  stdout { codec => rubydebug }
}
Let's start the containers up.
docker compose up -d
In a few minutes, you can check that an index has been created in elasticsearch, run the below command
curl http://localhost:9200/_cat/indices?v
Kibana can be accessed at http://localhost:5601/ and to be able to view the indices, you need to first enter the enrollment token from elasticsearch using the below command.
docker exec -it elasticsearch bin/elasticsearch-create-enrollment-token --scope kibana
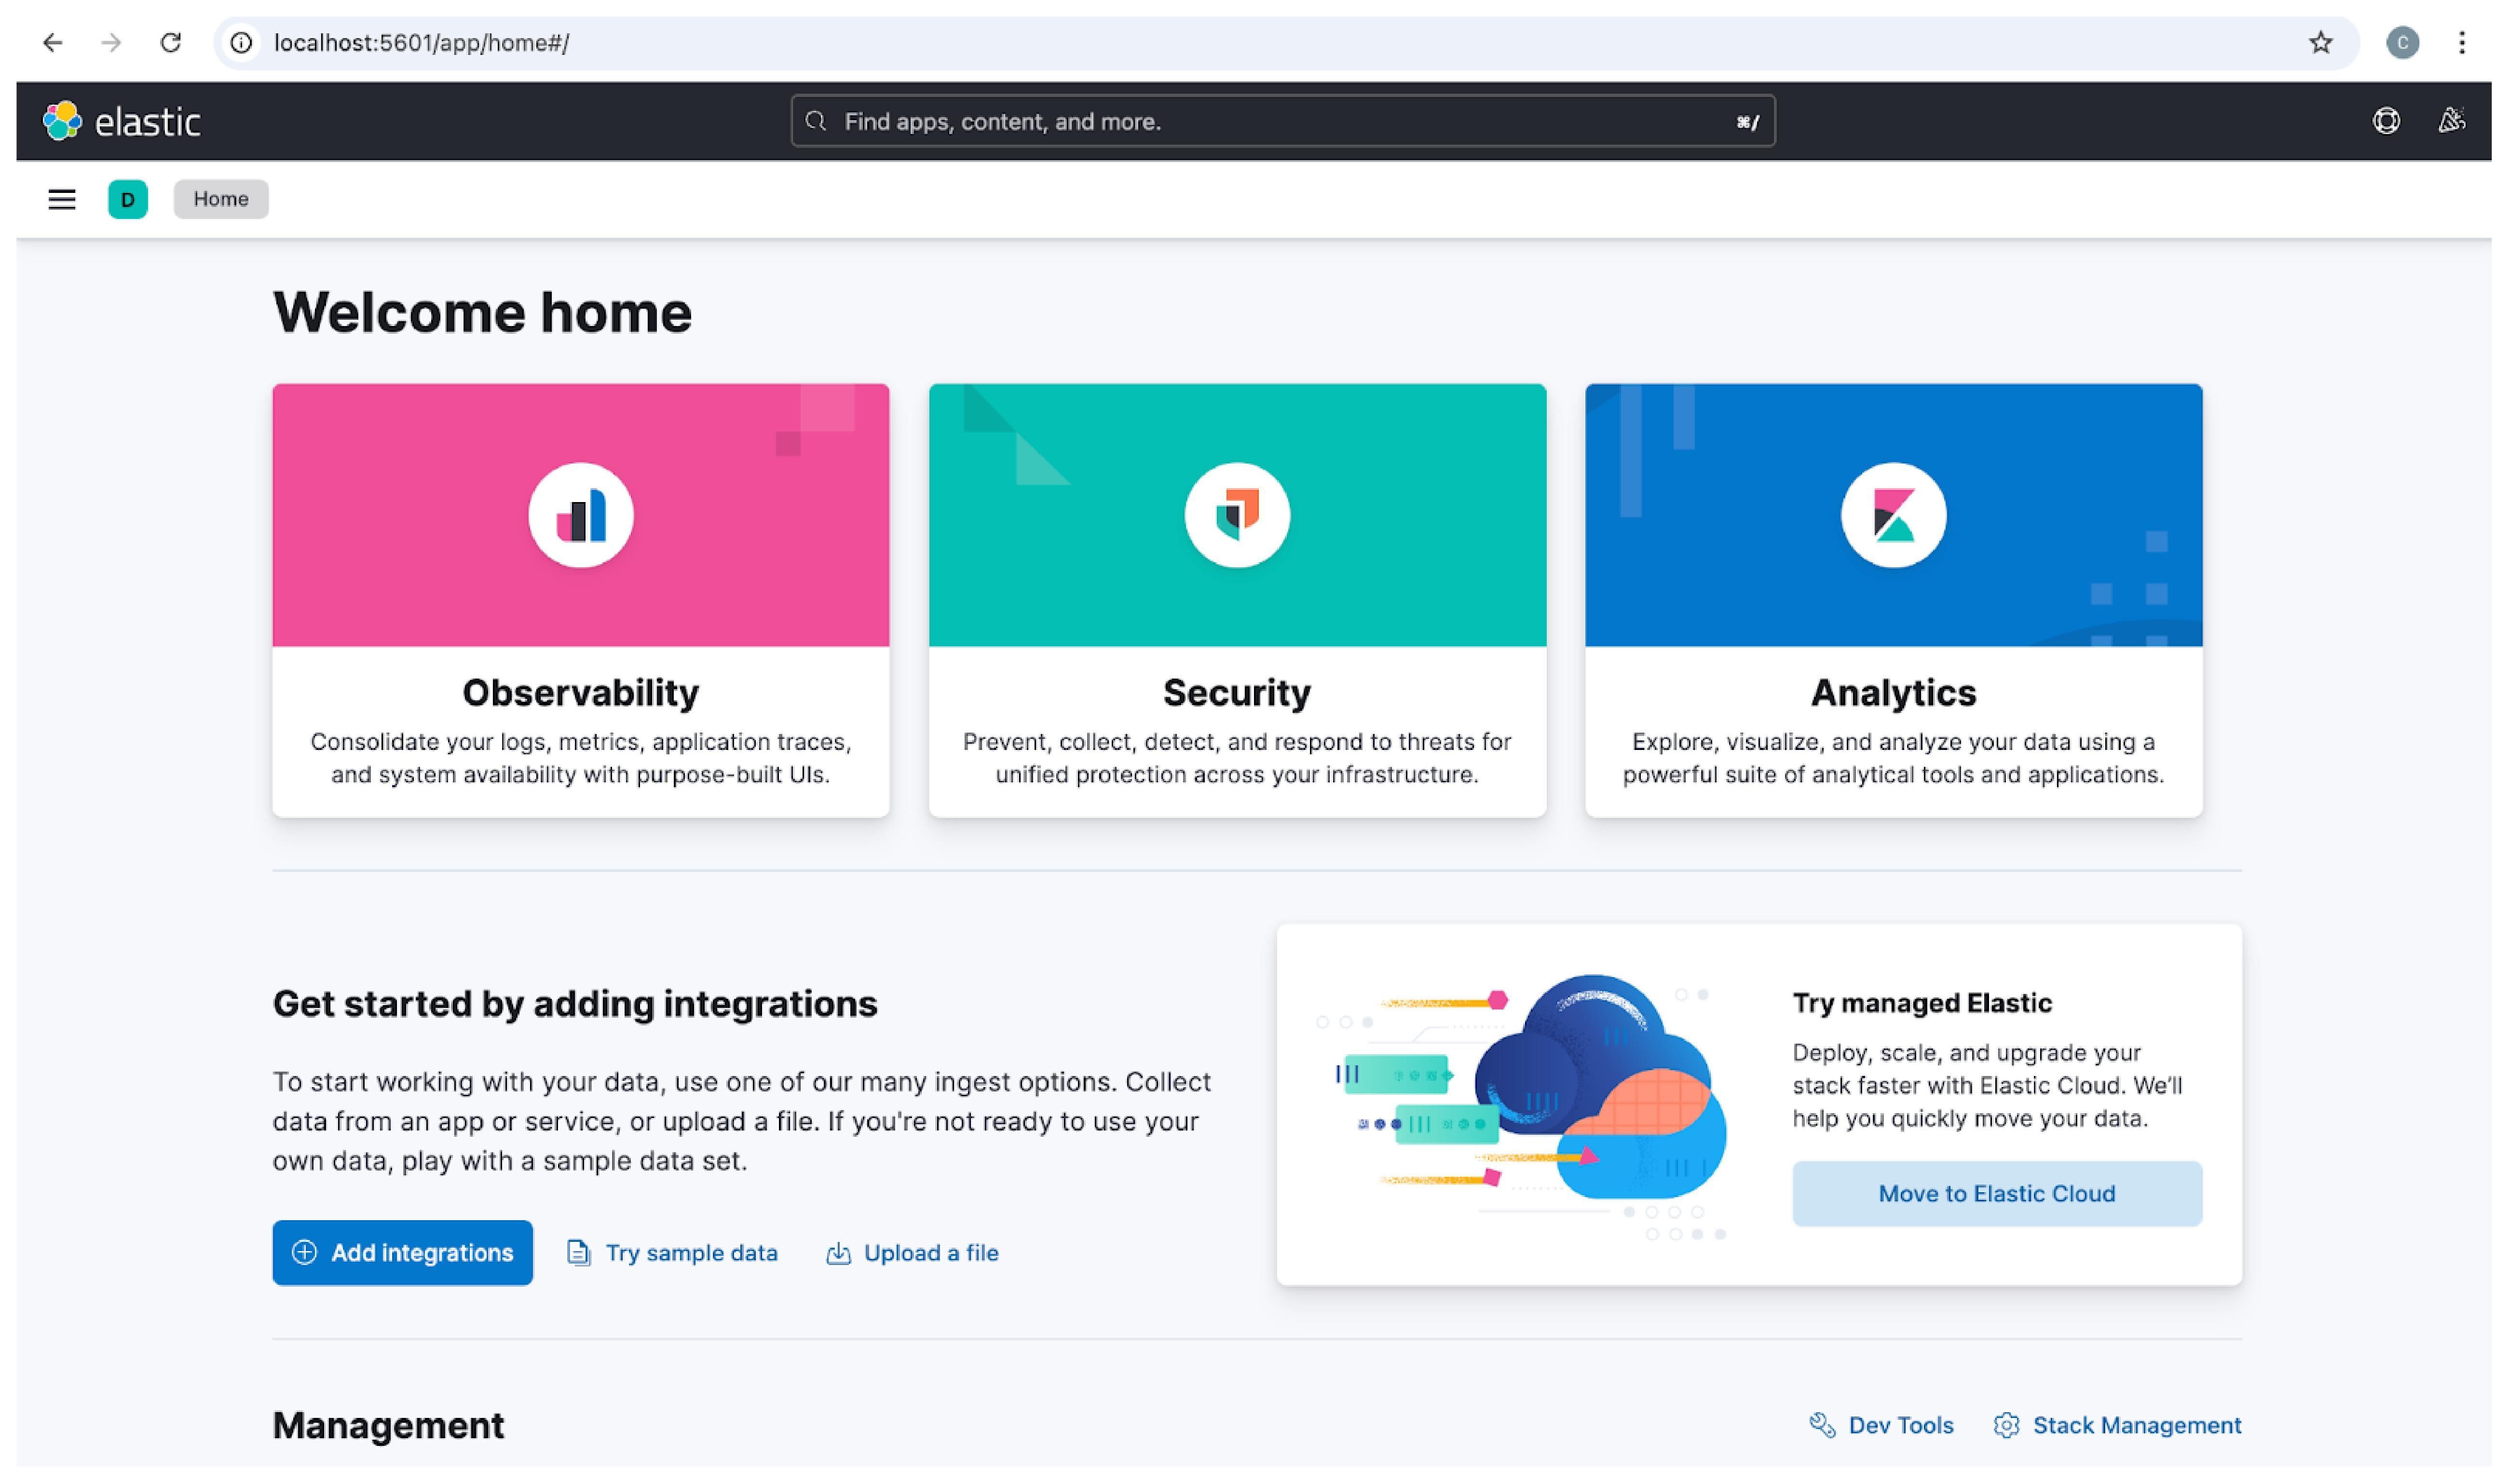
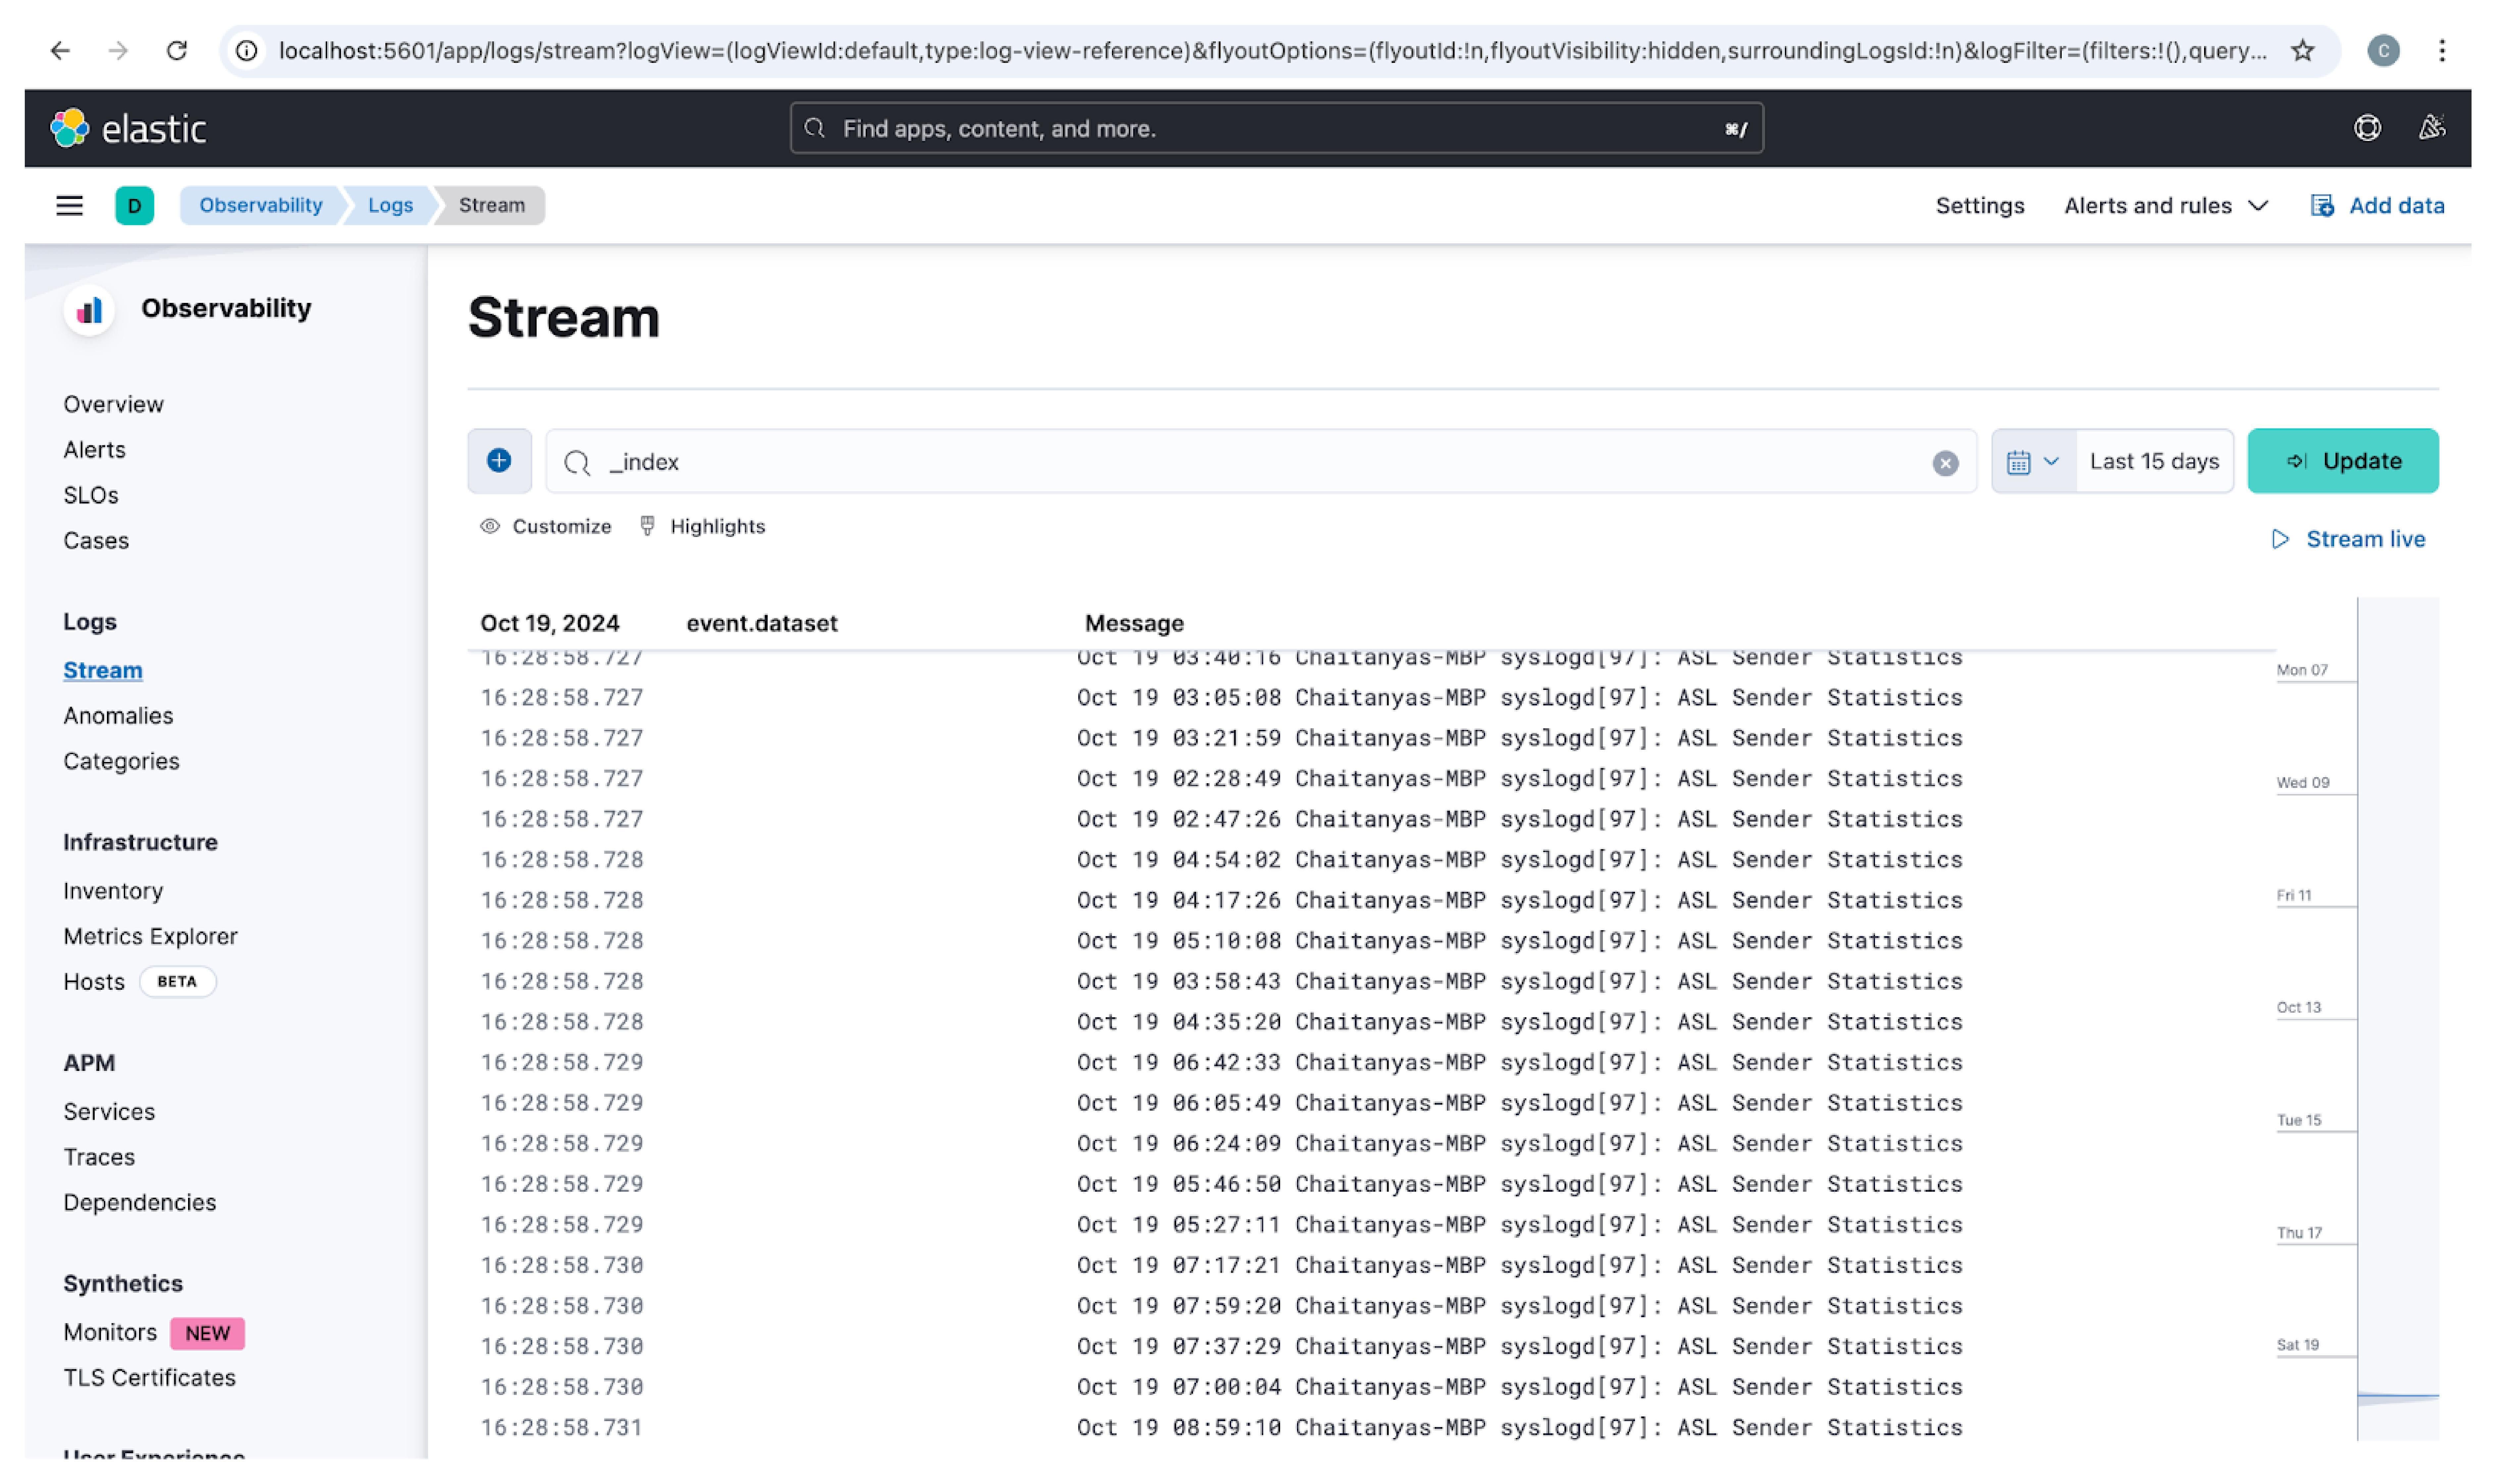
To set up OpenObserve locally, copy the below file and run it locally to visit openobserve url at http://localhost:5080
https://github.com/openobserve/rum-demo/blob/main/openobserve-setup/setup_openobserve.sh
Install fluent-bit on your macbook by running the following
brew install fluent-bit
Configure the fluent-bit with the below file fluent-bit.conf
[SERVICE]
    Flush        5
    Daemon       Off
    Log_Level    info
[INPUT]
    Name tail
    Path tmp/test.log
    Parser json
    Tag system-log
    Mem_Buf_Limit 5MB
    Skip_Long_Lines On
    Read_From_Head  true
[OUTPUT]
    Name http
    Match *
    URI /api/default/system-log/_json
    Host localhost
    Port 5080
    tls Off
    Format json
    Json_date_key    _timestamp
    Json_date_format iso8601
    HTTP_User test@example.com
    HTTP_Passwd <your_http_passwprd>
    compress gzip
Start fluent-bit agent by running the below command
fluent-bit -c fluent-bit.conf
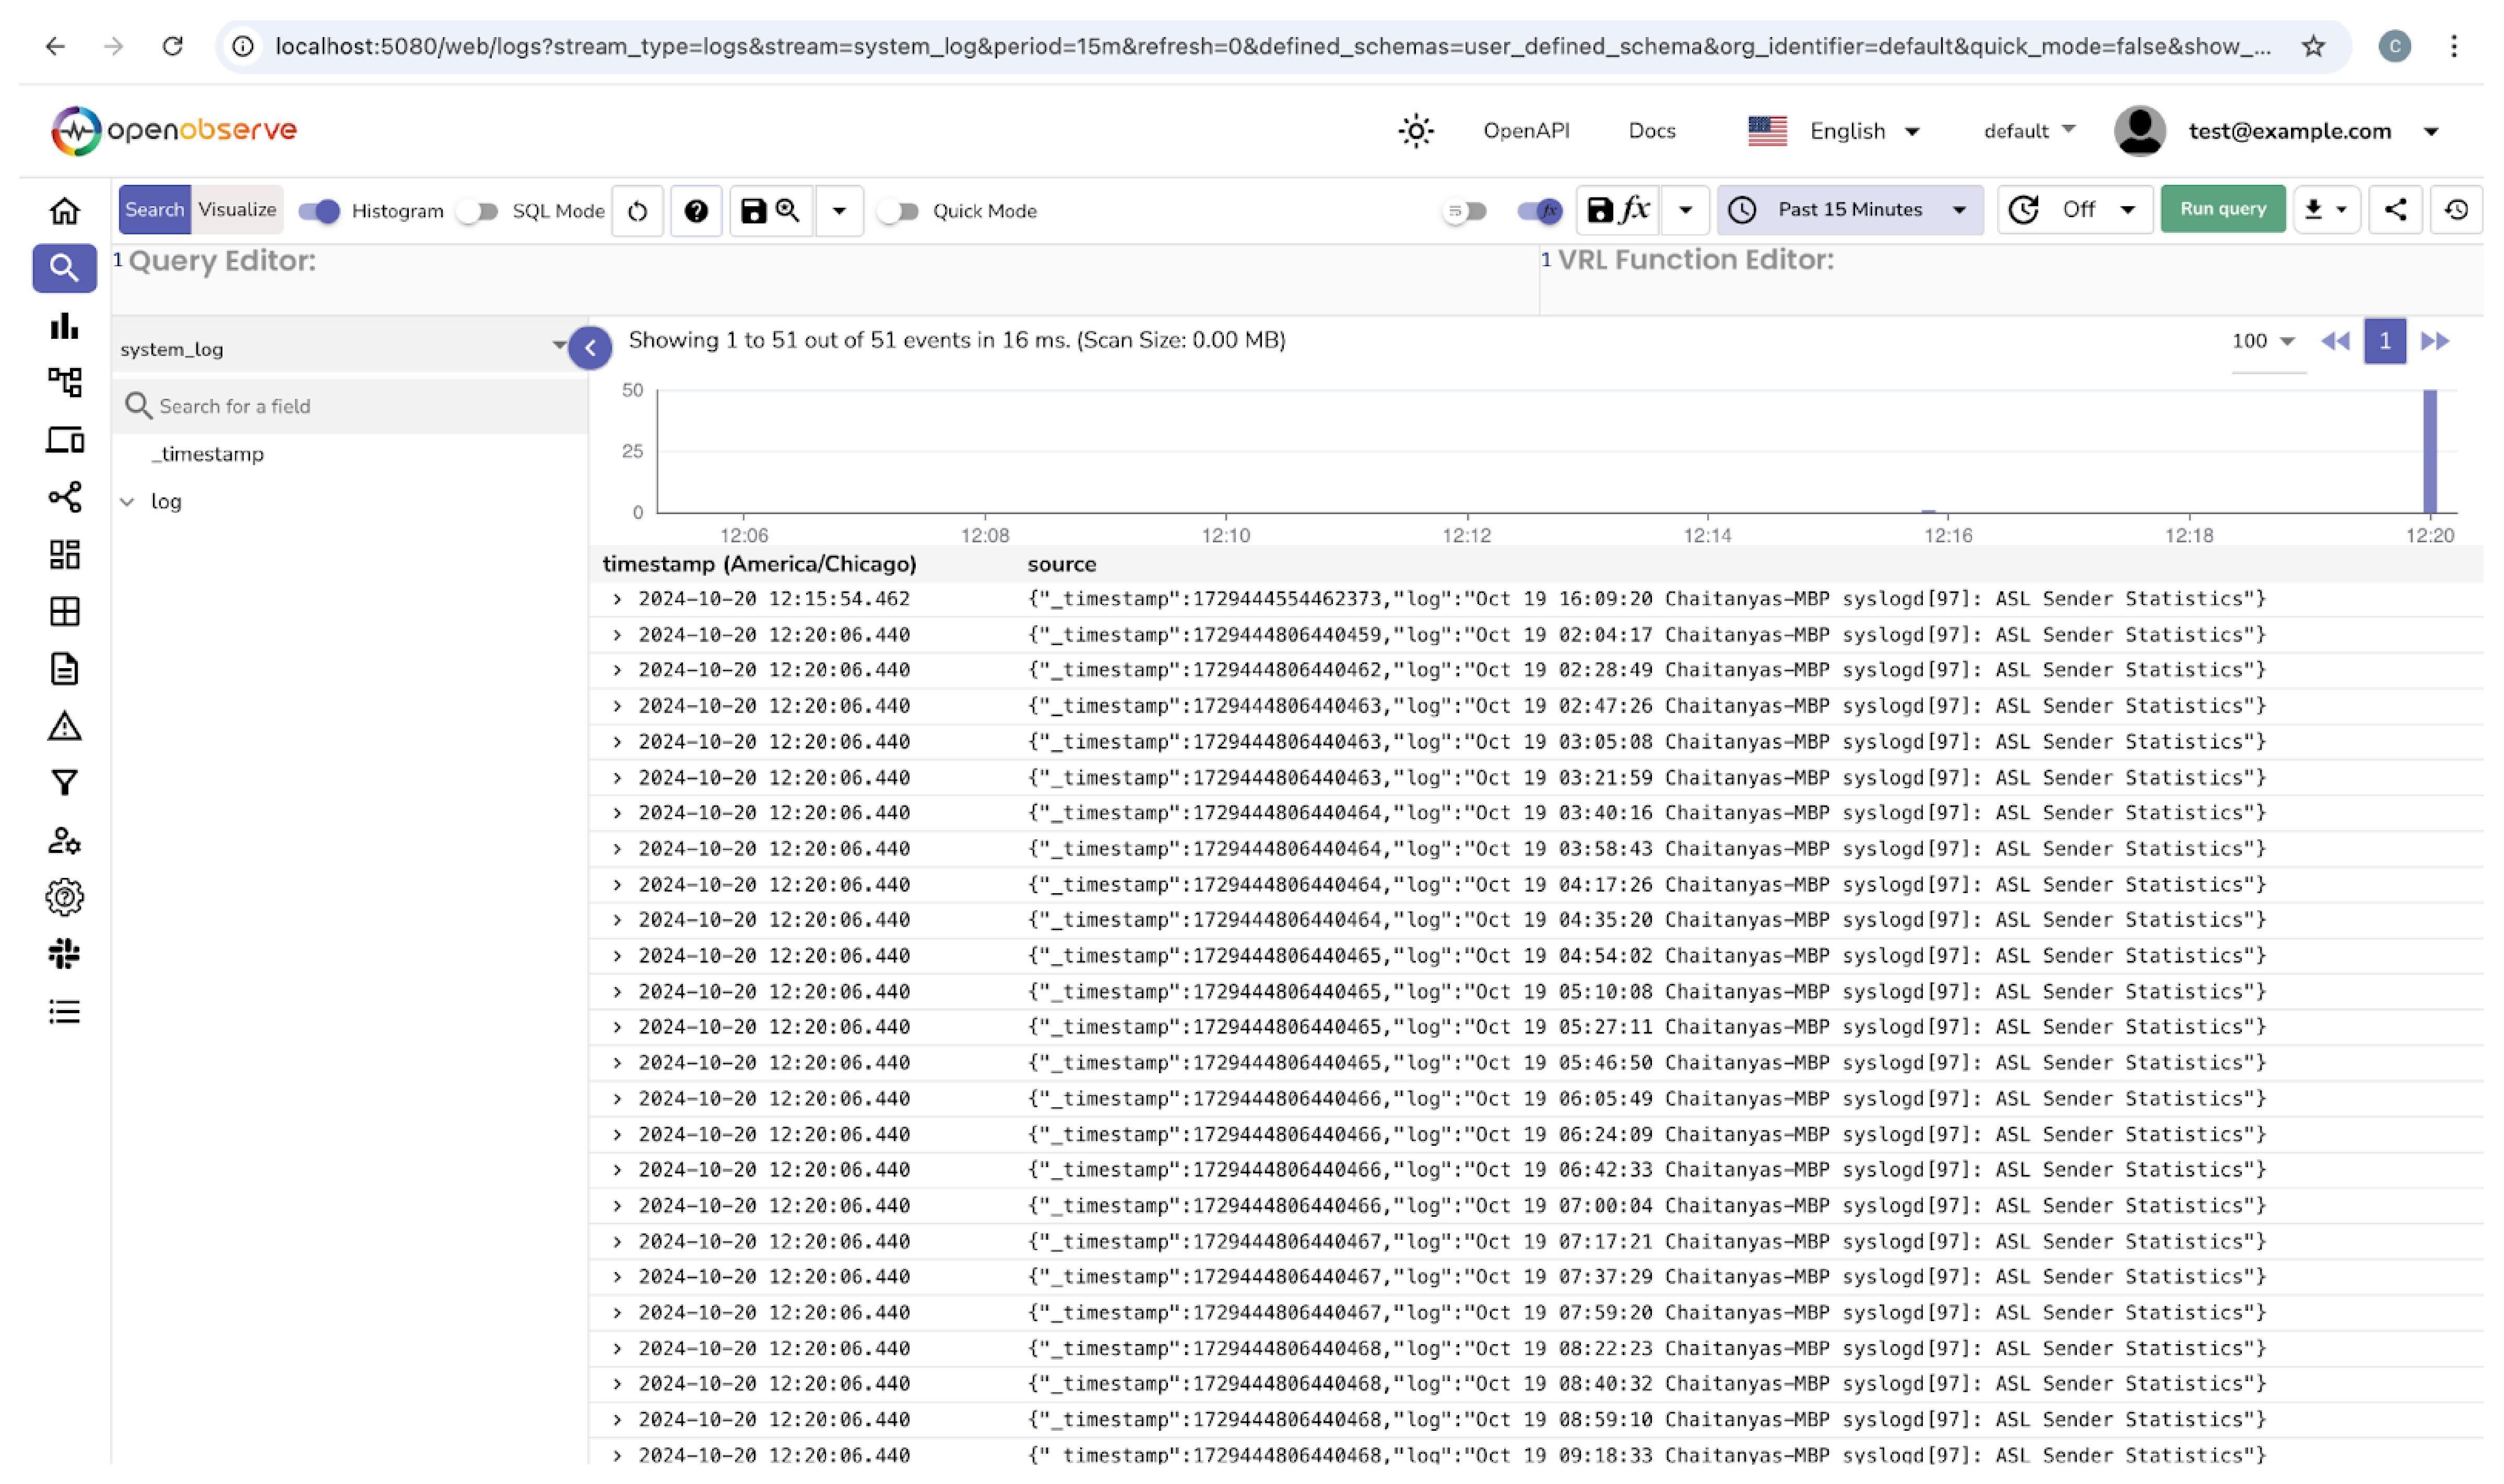
You can now view logs in OpenObserve
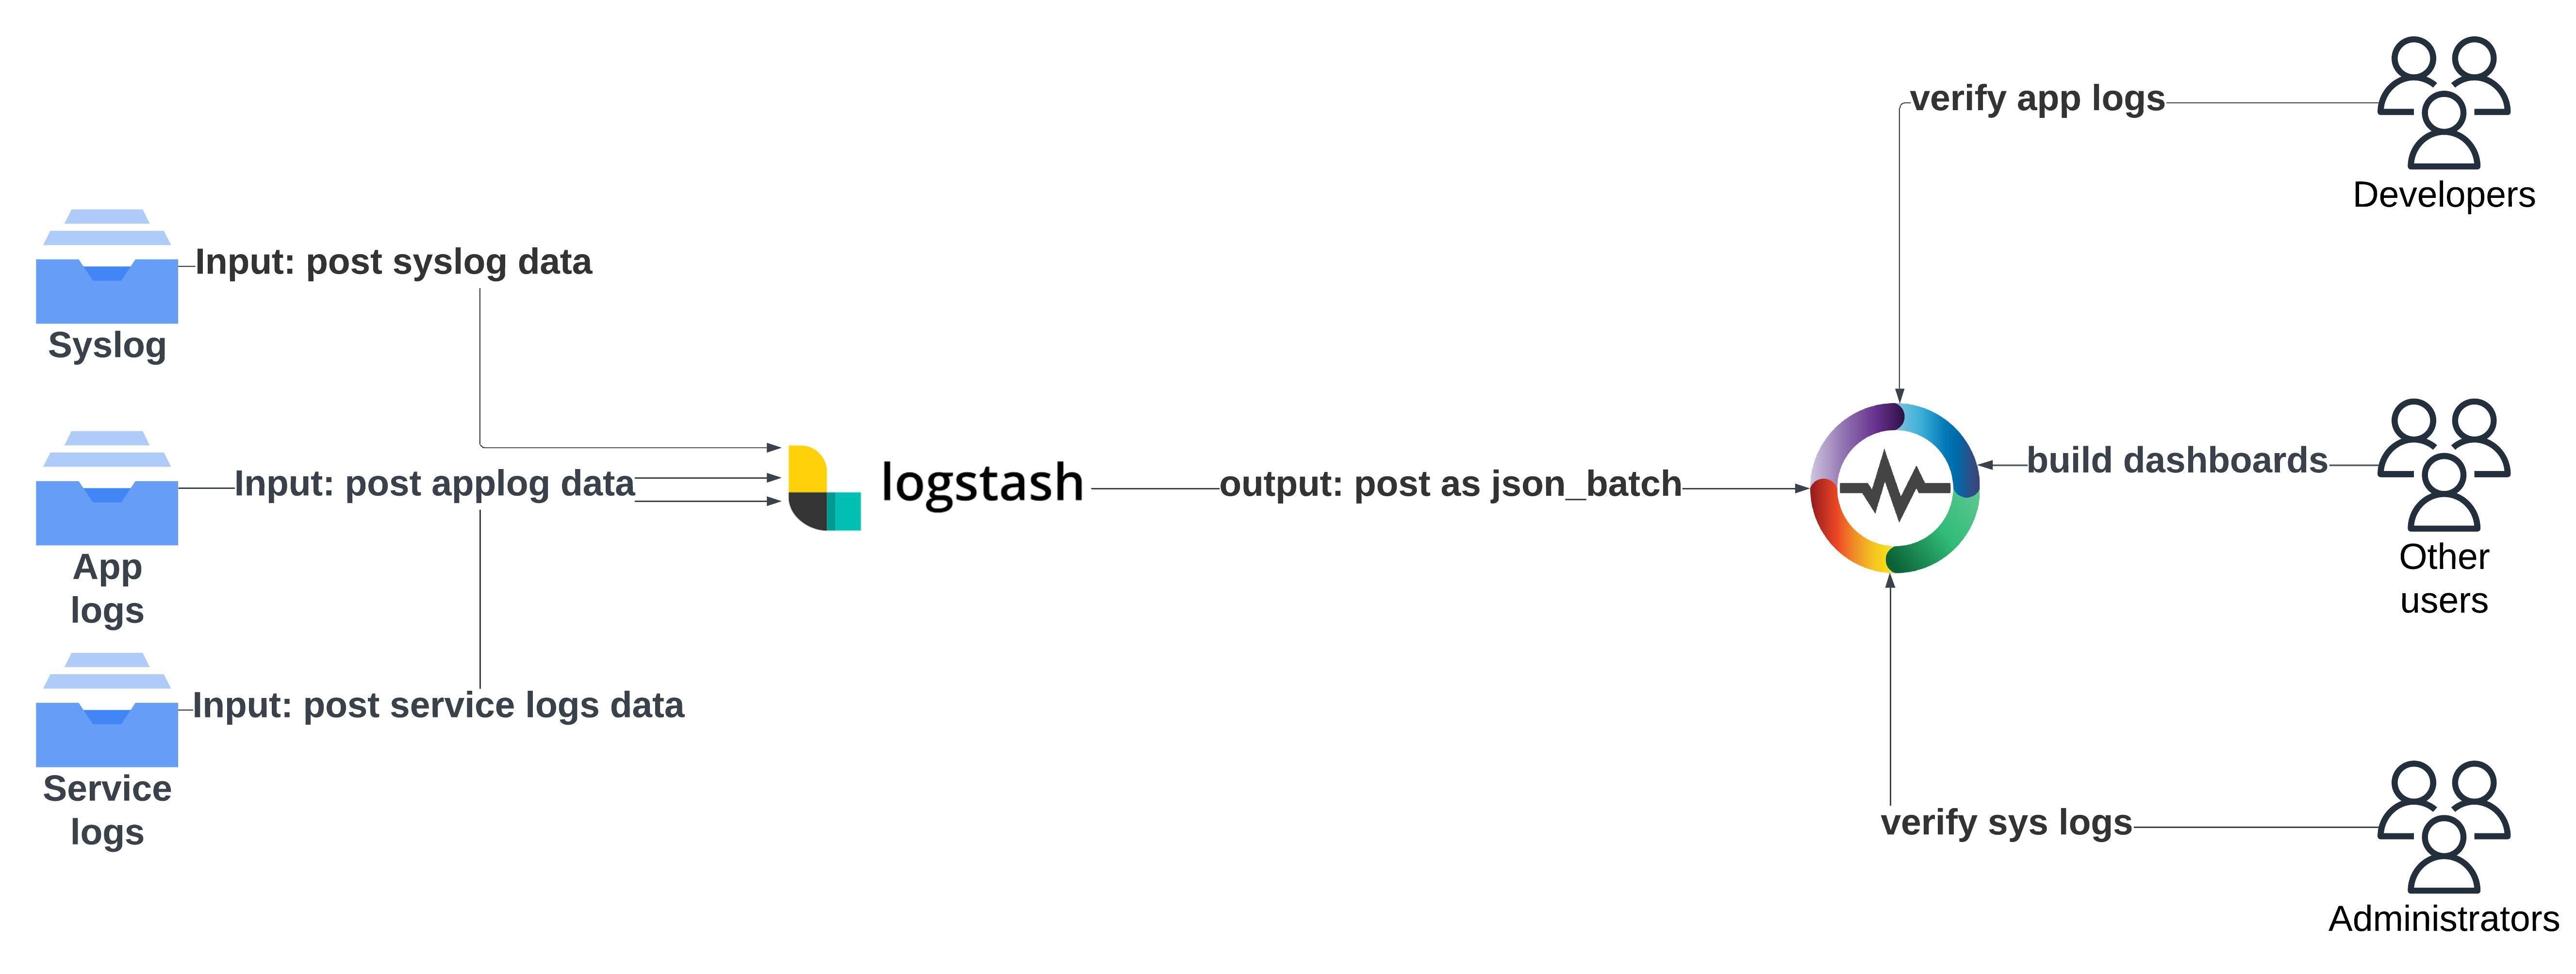
Yes, you can use Logstash to ingest data into OpenObserve since it allows you to collect, parse, and transform data before sending it to various outputs. By integrating it with OpenObserve, you can ensure a seamless transition from your existing ELK stack to OpenObserve without disrupting your current workflow.
If you’re migrating from ELK to OpenObserve, reusing your existing Logstash configuration can significantly reduce complexity. Logstash's flexibility allows it to send data to OpenObserve without requiring major changes in your pipeline.
To start sending data from Logstash to OpenObserve, simply use the following output configuration in your Logstash pipeline:
output {
  http {
    url => "<openobserve_ingestion_endpoint>"
    http_method => "post"
    format => "json_batch"
    headers => {
      "Authorization" => "Basic <openobserve_token>"
      "Content-Type" => "application/json"
    }
  }
}
| Feature | OpenObserve Streams | ELK Indices |
|---|---|---|
| Data Structure | Supports schema evolution without reindexing. | Requires reindexing for schema changes. |
| Storage | Stores data in Parquet format for better compression. | Can rapidly grow in size, increasing storage costs. |
| Ingestion Speed | Handles high ingestion rates with stream-based ingesters. | May slow down under heavy ingestion loads. |
| Query Speed | Uses columnar storage for faster queries. | Relies on row-based indices, which can add latency. |
| Scalability | Seamless horizontal scaling. | Scaling requires managing shards and nodes. |
Migrating from ELK to OpenObserve is not only more efficient but also surprisingly easy to set up. By simply configuring Fluent Bit to point logs directly to OpenObserve, you can streamline the transition without complex reconfigurations. OpenObserve’s user-friendly setup, combined with instant log visibility, makes it an accessible and straightforward upgrade for those familiar with ELK.

Chaitanya Sistla is a Principal Solutions Architect with 17X certifications across Cloud, Data, DevOps, and Cybersecurity. Leveraging extensive startup experience and a focus on MLOps, Chaitanya excels at designing scalable, innovative solutions that drive operational excellence and business transformation.