Head-Based vs. Tail-Based Sampling: Which Should You Use and When?

Simran Kumari
March 17, 2026
8 min read
Don’t forget to share!
Try OpenObserve Cloud today for more efficient and performant observability.
Imagine it's 2 a.m. Your on-call SRE gets paged: checkout is failing for 3% of users. They open the traces dashboard. Nothing. The sampling rate was set to 5%, and every single one of those failing requests was in the 95% that got discarded.
This isn't a hypothetical. It's the most common and most painful failure mode in observability setups: you have tracing, but you're not tracing the right things.
At low traffic volumes, sampling feels like a non-issue. Sample 10%, store it cheaply, query it later ; fine. But once your system is handling tens of thousands of requests per second, the sampling strategy you chose on day one becomes the ceiling on your ability to debug production. Miss a rare but critical failure path, and no amount of dashboards or alerting will compensate.
This article breaks down the two dominant sampling strategies , head-based and tail-based , what they get right, where they fail, and what production teams actually use.
Related: If you're new to distributed tracing concepts, start with A Comprehensive Guide to Distributed Tracing: From Basics to Beyond before diving in here.
When a request flows through a distributed system, every instrumented service emits spans, timestamped records of each unit of work. Together, those spans form a trace: the complete story of a single request as it moved through your stack.
At scale, storing every trace from every request is economically untenable. A system processing 50,000 requests per second with an average of 20 spans per trace generates 1 million spans per second. That's before you factor in storage, indexing, and query costs.
Sampling is the strategy for deciding which traces to keep and which to discard. The goal is to retain a representative subset of traces , enough to understand system behavior , without storing everything.
The catch: how you decide what to keep fundamentally shapes what you can debug later.
Related: See how OpenObserve handles high-volume trace ingestion with efficient columnar storage in the OpenObserve Distributed Tracing overview.
Head-based sampling makes the sampling decision at the very start of a trace, before a single span has been processed. When the root service receives a request, it flips a coin , keep or discard , and encodes that decision in the trace context headers (e.g., traceparent in W3C format). Every downstream service reads the flag and obeys it: either all services record their spans, or none do.
Common implementations: a fixed probability sampler (sample 10% of all requests), a rate-limited sampler (max 100 traces/second), or a rule-based sampler on specific routes.
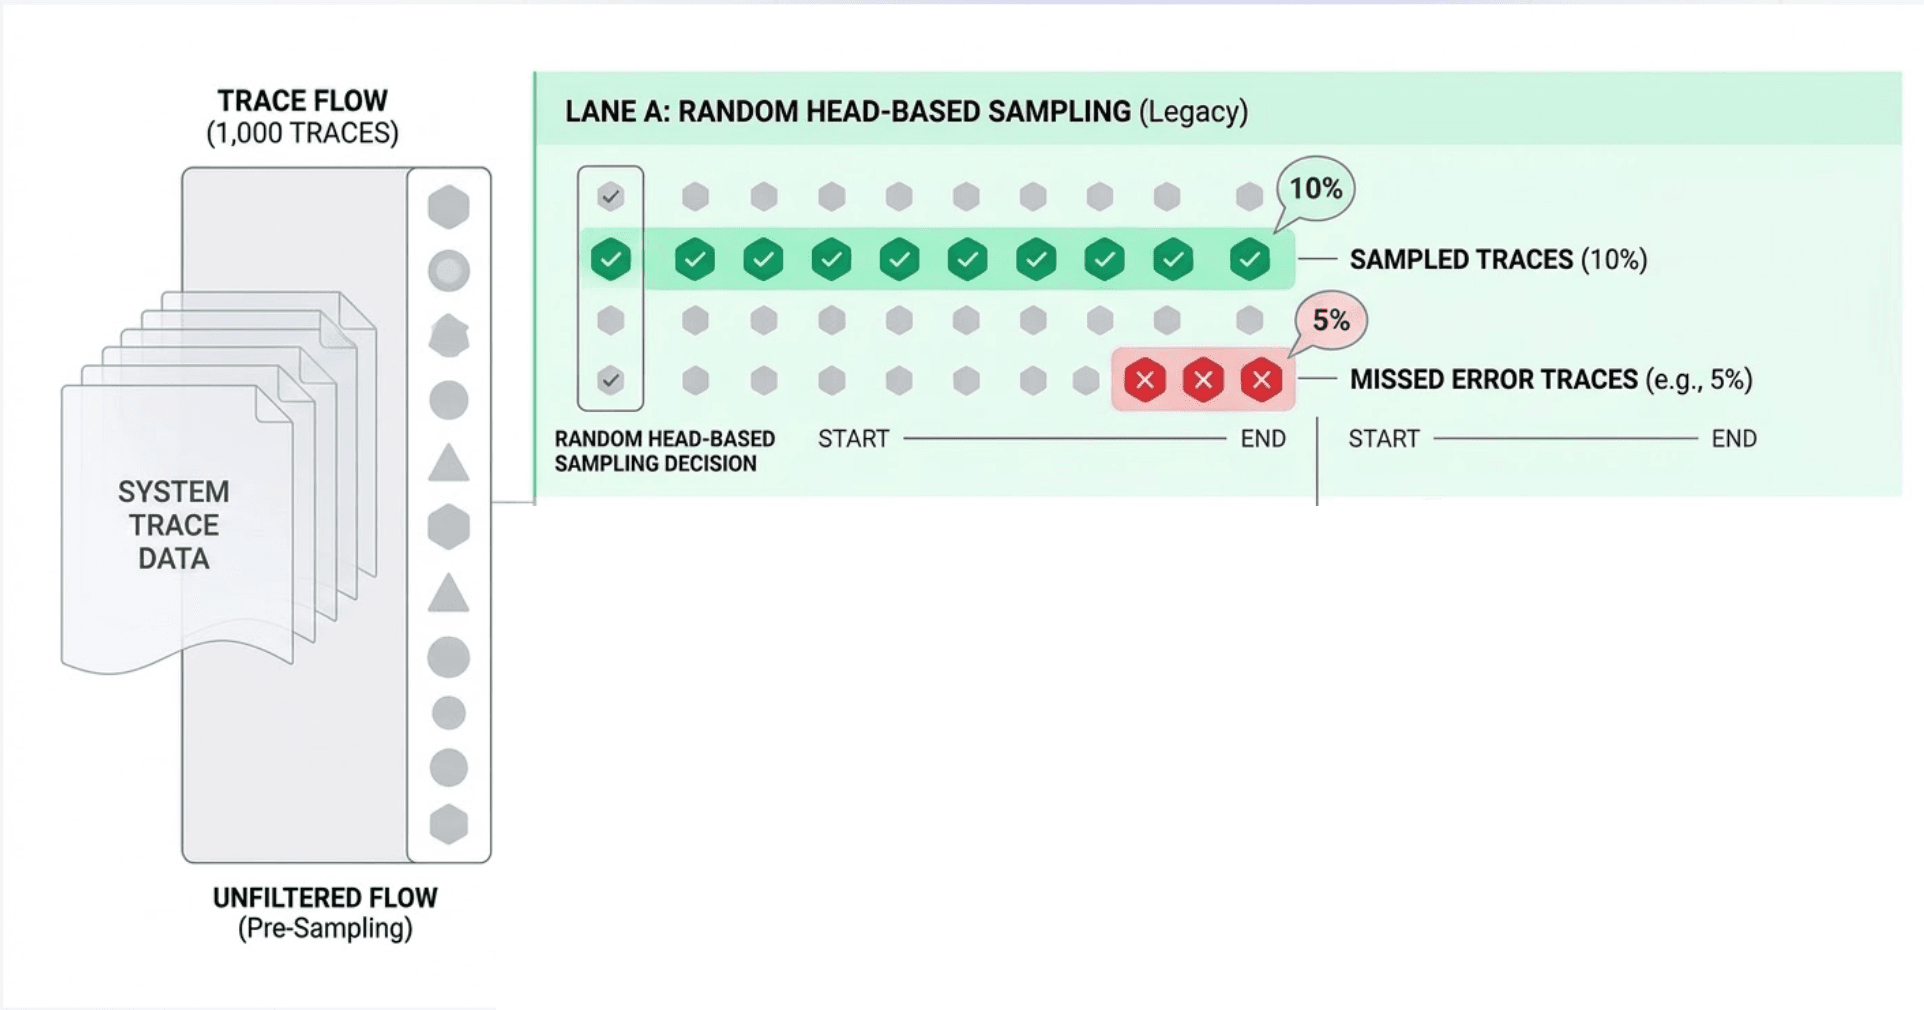
This is the critical flaw: head-based sampling is blind to outcomes.
The decision is made before the request executes. You have no idea if it will:
So statistically, errors , which are already rare , get sampled at the same rate as every boring 200 OK. If errors represent 0.1% of traffic and your sampling rate is 5%, you are keeping only 0.005% of your error traces. For a system processing 10,000 req/sec, that's roughly one error trace every 3 minutes , if you're lucky.
The deeper problem: head-based sampling optimizes for data volume, not data value. The traces you most need to keep are the anomalies, and anomalies are precisely what a probabilistic sampler is most likely to drop.
Tail-based sampling inverts the decision point entirely. Instead of deciding at the start, it decides after the trace is complete , once every span from every service has been collected and the full outcome is known.
A central component , the trace collector , buffers incoming spans, assembles complete traces by their trace ID, evaluates each trace against a policy, and then forwards or discards it.
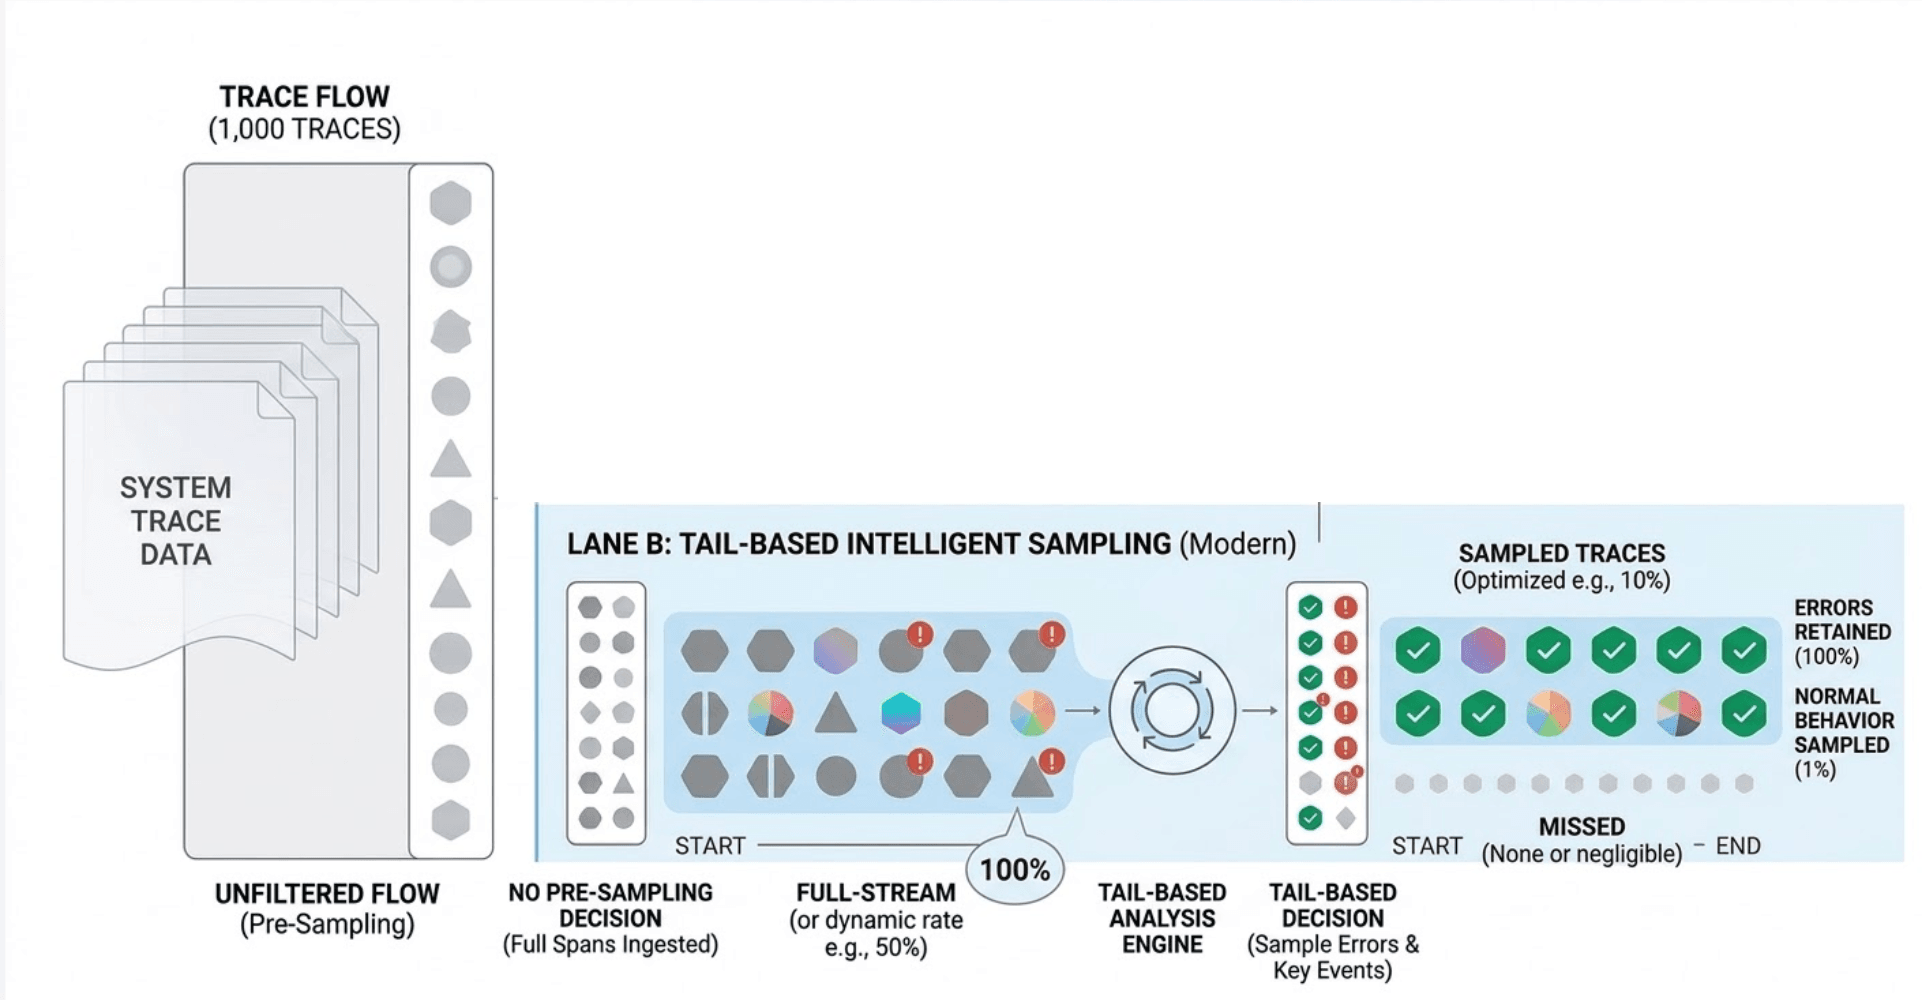
Example policy logic:
http.status_code >= 500 duration > 2000ms With tail-based sampling, your stored traces are no longer a random sample , they're a curated dataset biased toward the interesting cases. Every error. Every latency outlier. Every anomaly. The healthy fast traces are still sampled (just at a much lower rate), giving you the baseline.
This is the shift from data volume management to signal quality management.
Tail-based sampling is not free. The collector must:
At high throughput, this collector becomes a critical, resource-hungry component. If it crashes, you lose buffered traces , including the errors you explicitly wanted to keep. It needs to be highly available, horizontally scalable, and carefully tuned.
The OpenTelemetry Collector Contrib distribution provides a tailsamplingprocessor that handles this, but running it well in production requires meaningful operational investment.
For a deep dive into configuring the OpenTelemetry Collector Contrib with processors, see OpenTelemetry Collector Contrib: Complete Guide. The processors section covers sampling, filtering, and batching in detail.
| Head-Based | Tail-Based | |
|---|---|---|
| Decision point | Start of request | After trace completes |
| Knows the outcome? | ❌ No | ✅ Yes |
| Guarantees error capture? | ❌ No | ✅ Yes (if configured) |
| Complete traces? | ✅ Always | ✅ Yes (if collector works) |
| Memory/buffer overhead | ✅ Minimal | ❌ High |
| Infrastructure complexity | ✅ Low | ❌ High |
| Predictable data volume | ✅ Yes | ❌ Variable |
| Best for debugging prod? | ❌ Limited | ✅ Yes |
Pure tail-based sampling at massive scale is expensive. Pure head-based sampling misses the traces you need most. In practice, most mature teams converge on a layered approach:
Apply a head-based sampler first to reduce raw volume. Instead of collecting every span for every request, sample a modest baseline , say 20% , before spans reach the collector. This caps your collector's ingest burden and storage cost.
On top of that sampled 20%, the collector applies tail-based rules:
# OpenTelemetry Collector tail sampling config (simplified)
processors:
  tail_sampling:
    decision_wait: 10s
    policies:
      - name: errors-policy
        type: status_code
        status_code: { status_codes: [ERROR] }

      - name: slow-traces-policy
        type: latency
        latency: { threshold_ms: 1000 }

      - name: baseline-policy
        type: probabilistic
        probabilistic: { sampling_percentage: 5 }
This means:
Some teams add a third layer: always-on sampling for high-value routes. Payment endpoints, authentication flows, or SLO-bound APIs are head-sampled at 100% , every request traced, regardless of outcome. These are the paths where missing a single failure is unacceptable.
Instead of a random 10% slice of all traffic, you end up with:
For teams building on microservices, Microservices Observability: Leveraging Logs, Metrics, and Traces covers the broader observability strategy these sampling decisions feed into.
Sampling strategy is not a one-time decision , it's a dial you should keep adjusting as your system and your observability maturity grow. Start simple. Measure what you're missing (hint: look at your error rate vs. your error trace rate). And when those two numbers diverge significantly, it's time to move up the ladder.
The teams that debug fastest aren't the ones with the most data. They're the ones with the right data.
Want to try this in practice? Explore tracing, sampling, and analysis in OpenObserve.
For full OTLP configuration options and authentication details for OpenObserve, see the OpenTelemetry Collector ingestion docs. For viewing and querying the resulting traces , including correlating them with logs , see View and Configure Traces in OpenObserve.
Passionate about observability, AI systems, and cloud-native tools. All in on DevOps and improving the developer experience.


