How to Monitor AWS API Gateway Access Logs via Kinesis Data Firehose and Openobserve

Manas Sharma
August 12, 2025
7 min read
Don’t forget to share!
Try OpenObserve Cloud today for more efficient and performant observability.
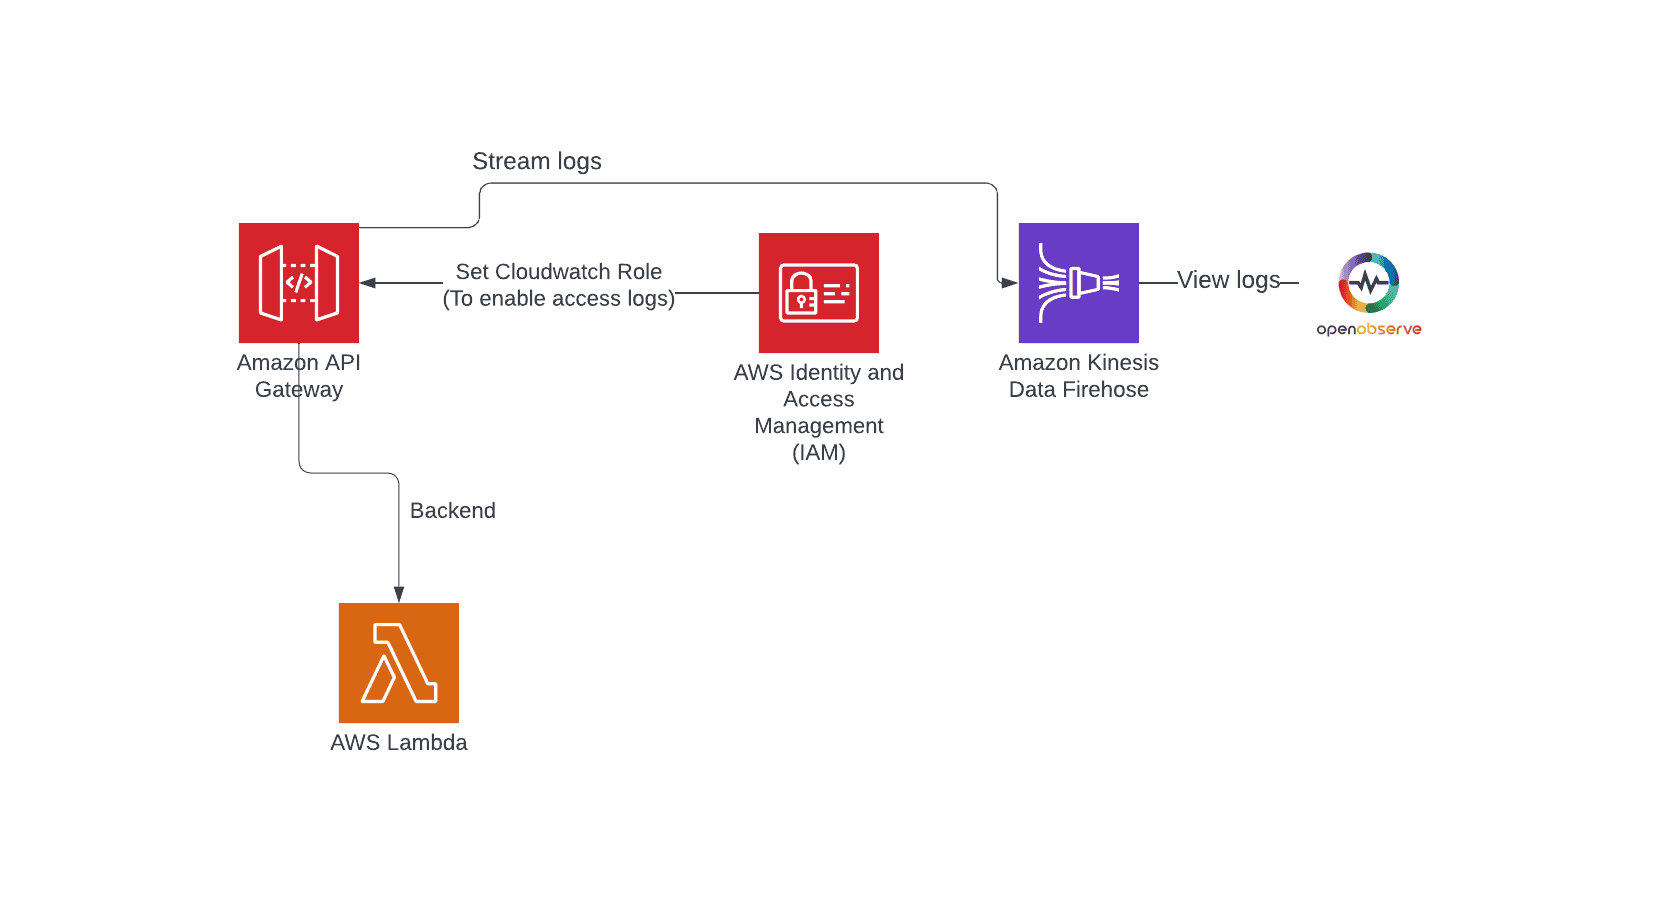
Monitoring AWS API Gateway access logs is super important for keeping an eye on how your APIs are performing, spotting issues, and making sure you're using resources efficiently. By connecting AWS API Gateway directly to Amazon Kinesis Data Firehose, you can easily stream your access logs straight to OpenObserve. This setup not only makes it simple to analyze your logs but also helps you uncover trends and detect any anomalies, so you can make informed decisions to boost your API’s reliability and performance.
Amazon Kinesis Data Firehose is a fantastic, fully managed service that lets you load real-time data streams into AWS storage services like Amazon S3, Amazon Redshift, or Amazon Elasticsearch. With Firehose, capturing and streaming your log data is a breeze—no complicated setup required! This means you can focus on monitoring and improving your APIs without getting bogged down in the technical details.
So, let’s dive in and get started!
Before we start, ensure you have the following:
We will be creating a sample lambda function that will accept HTTP request events from API gateway and process them.
ApiLogFunctionPython 3.x (or your preferred language).In the Lambda function's code editor, implement a demo function that will serve as the backend for our REST API
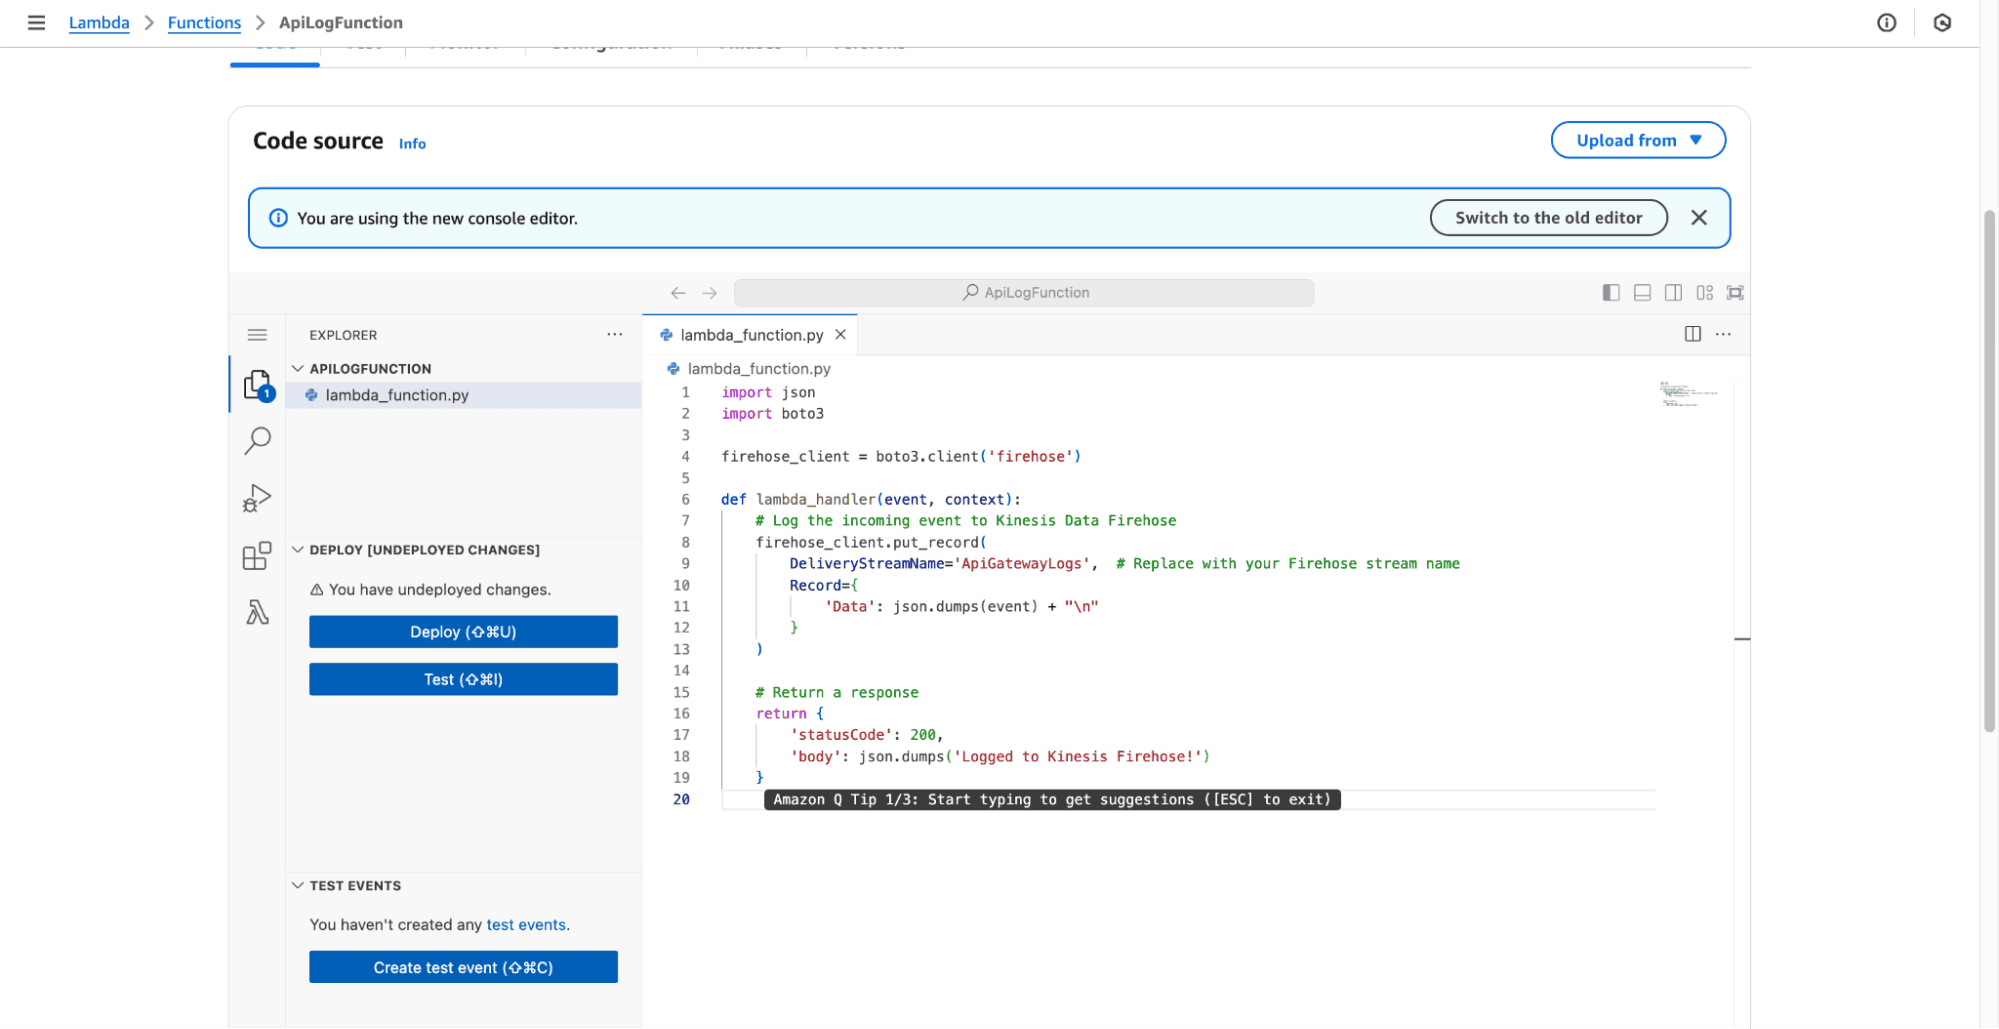
import json

def lambda_handler(event, context):

     return {
            'statusCode': 200,
            'body': json.dumps({'message': 'Logged to Kinesis Firehose!'})
        }
Ensure the Lambda function has permissions to log to CloudWatch. Attach the
AWSLambdaBasicExecutionRolepolicy.
accesslogsdemoapi.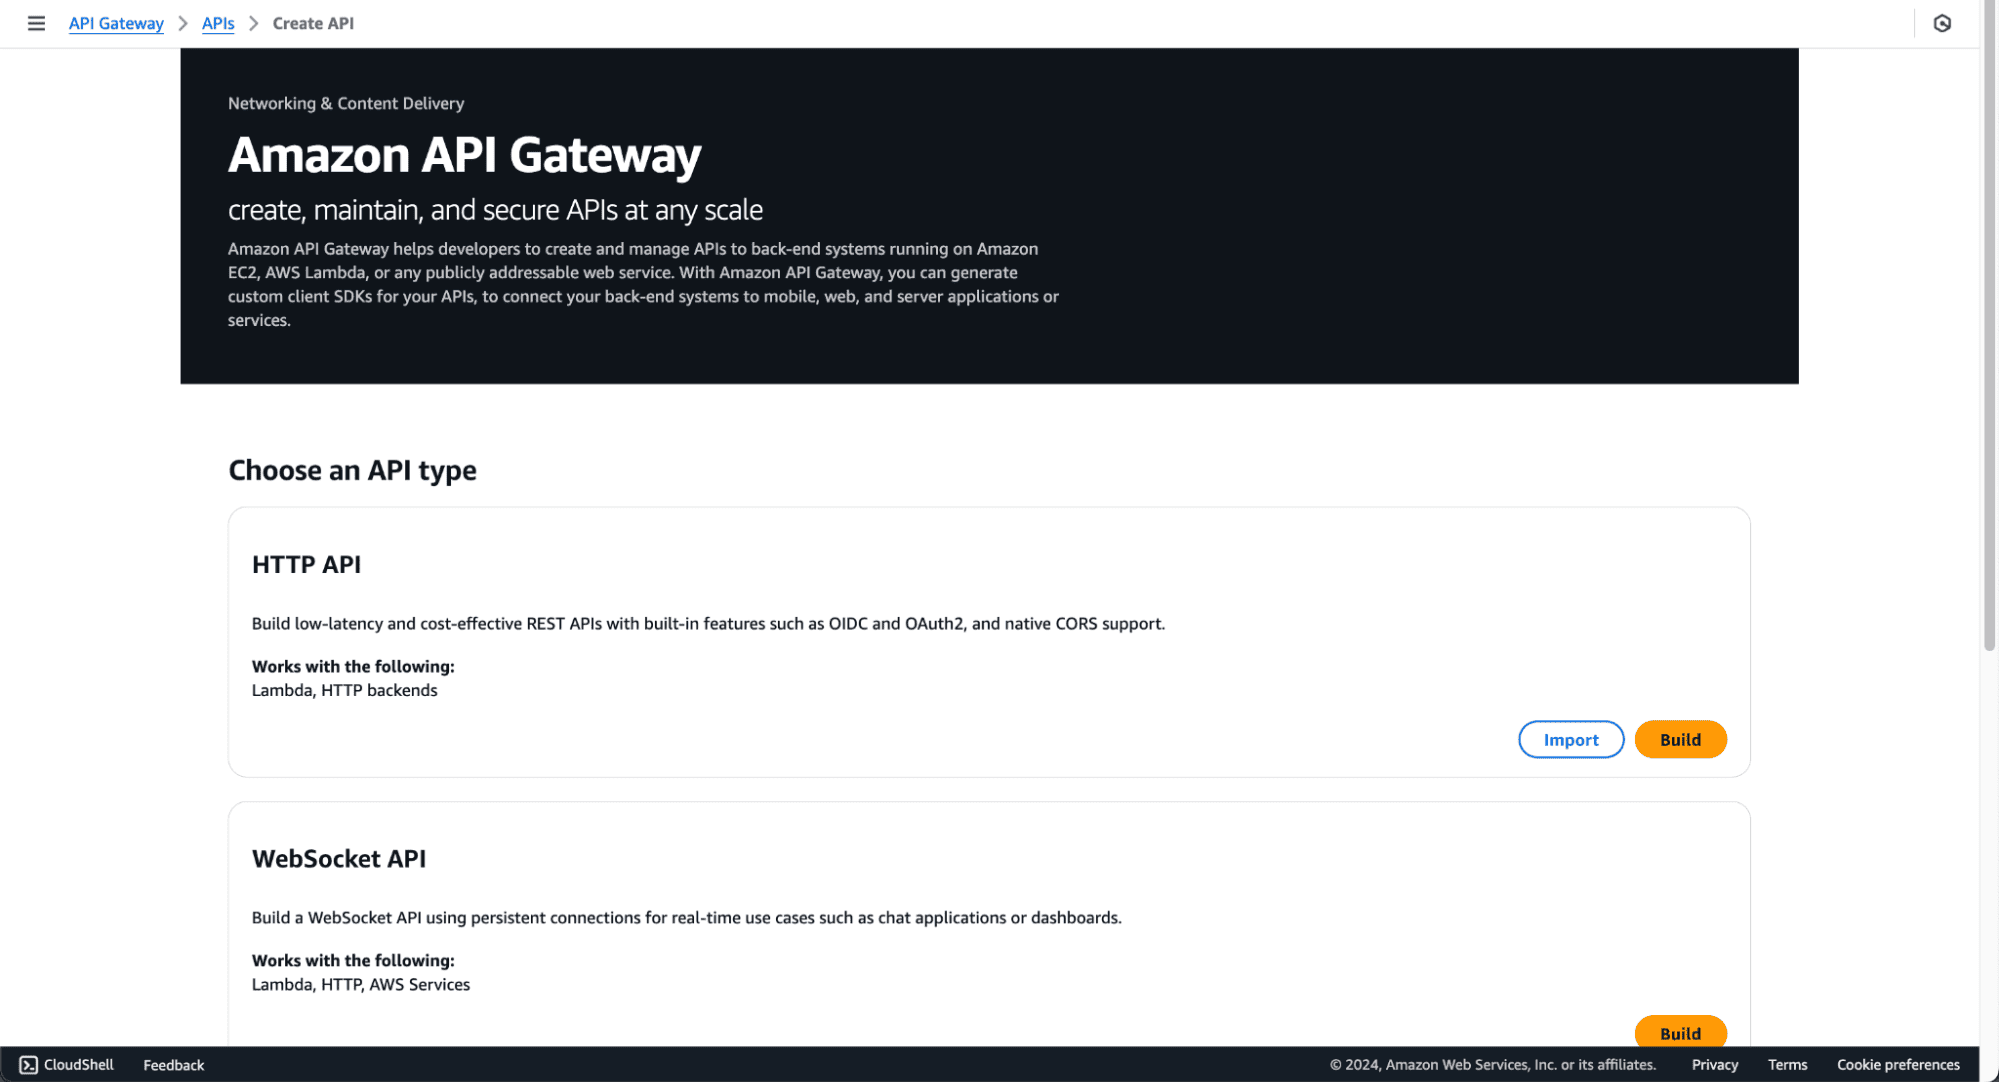
log./log resource.GET and click the checkmark.ApiLogFunction).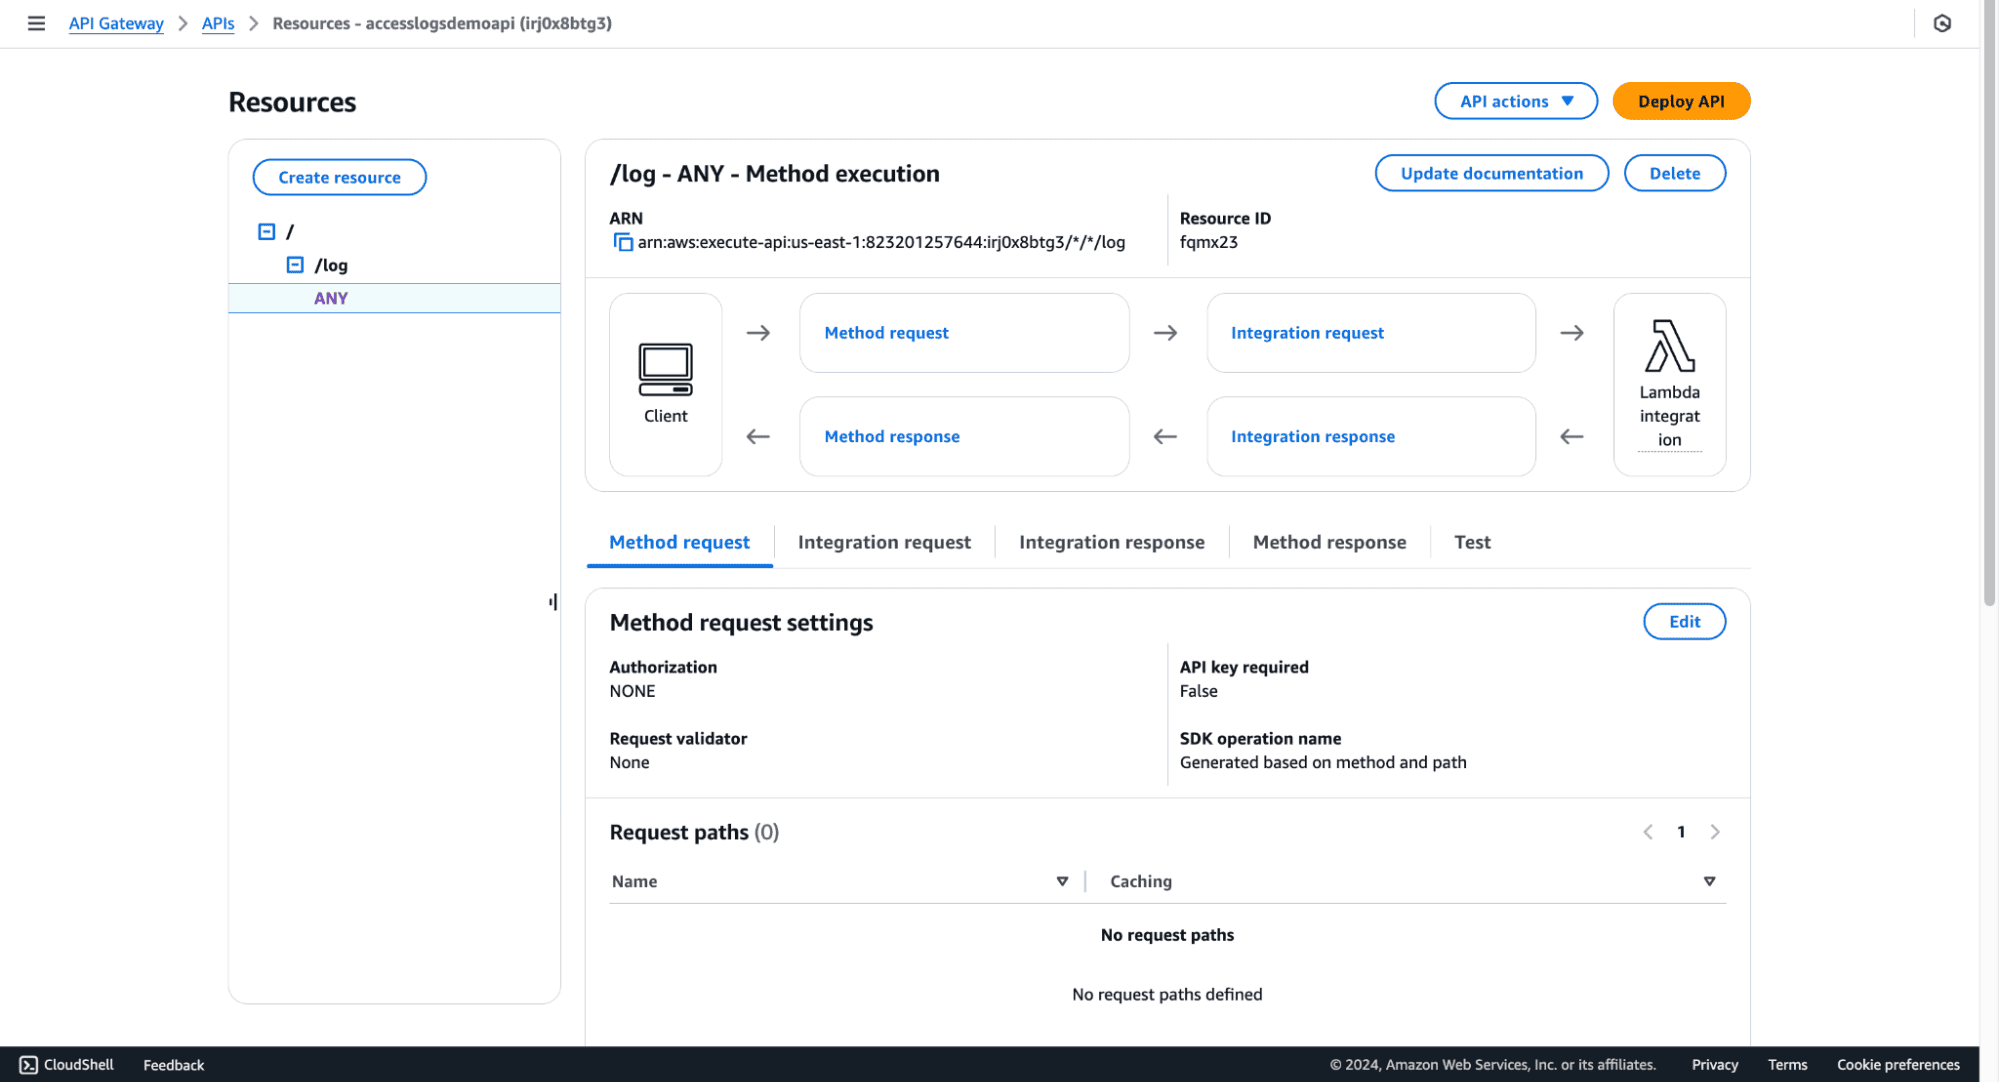
lambda-firehose-backup).
AWSLambdaBasicExecutionRole policy.APIGatewayCloudWatchLogsRole.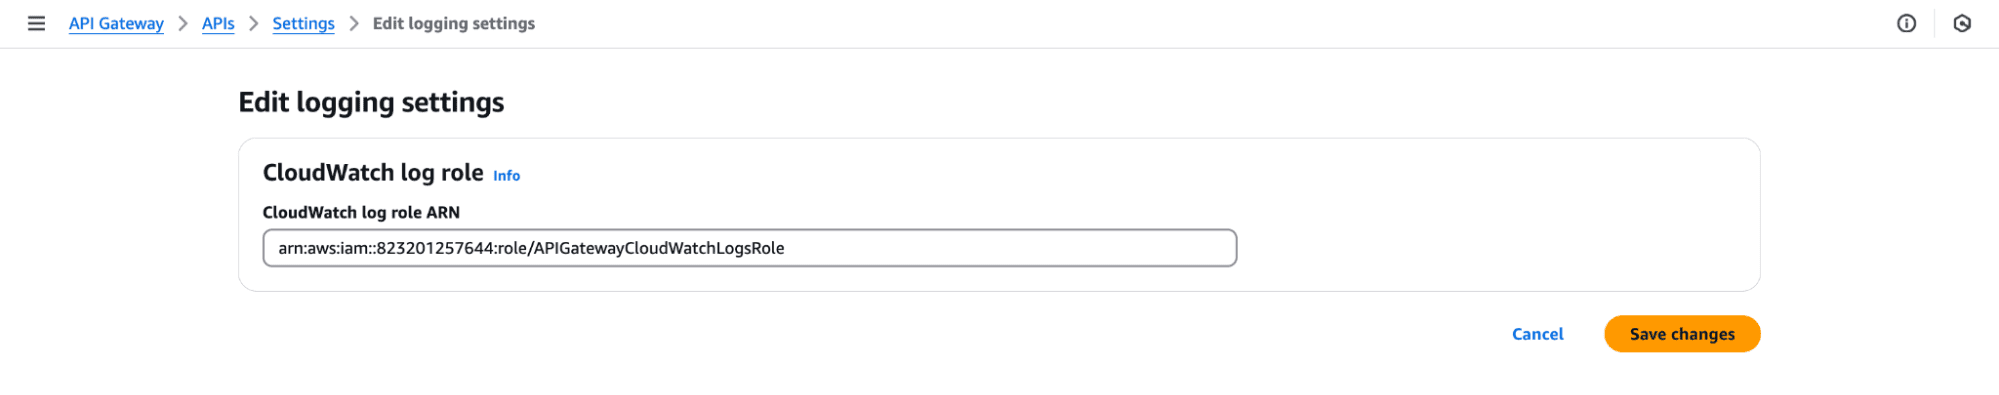
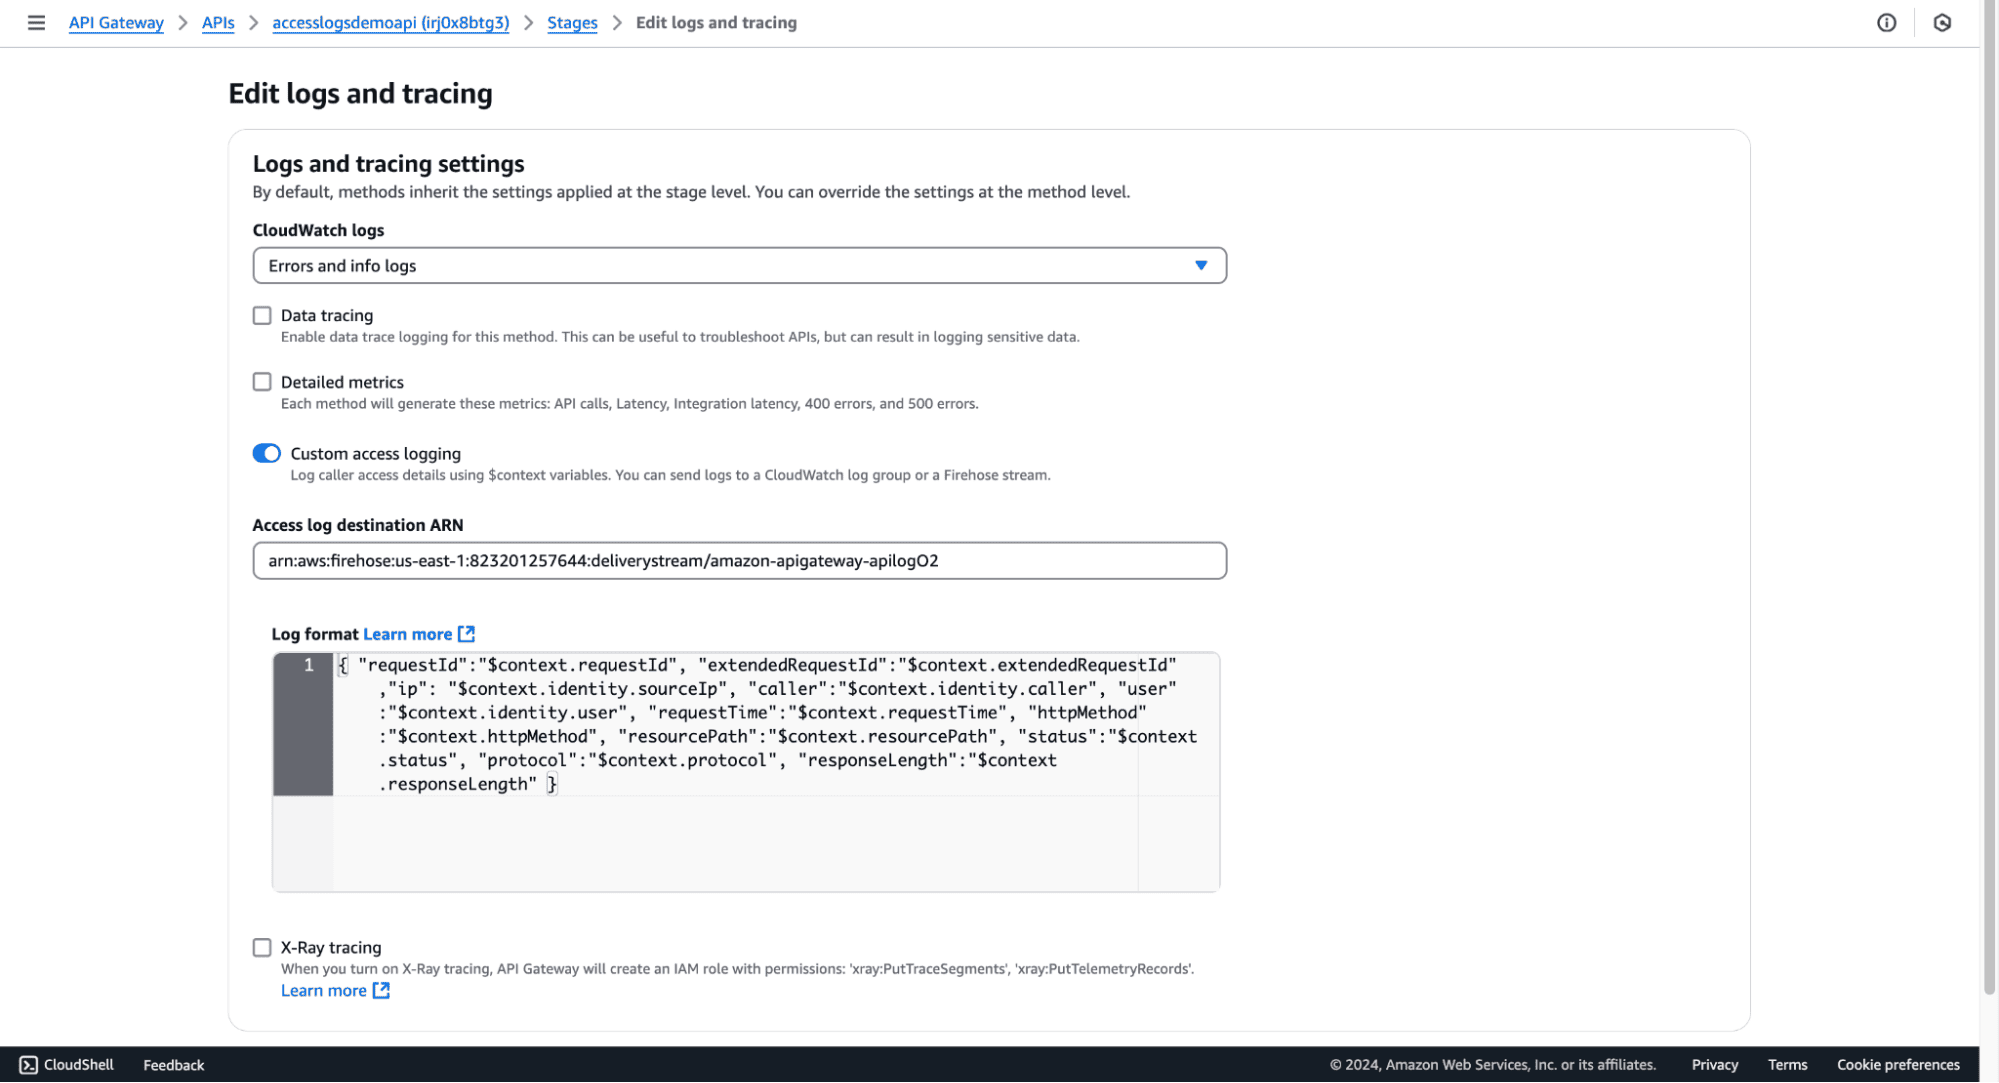
Specify the log format, e.g.:
RequestId: $context.requestId, SourceIP: $context.identity.sourceIp, Method: $context.httpMethod, ResourcePath: $context.resourcePath, StatusCode: $context.status, ResponseLength: $context.responseLength, RequestTime: $context.requestTim
Save your chnages.
Ensure OpenObserve is set up and running. Refer to the Quickstart documentation for installation and configuration.
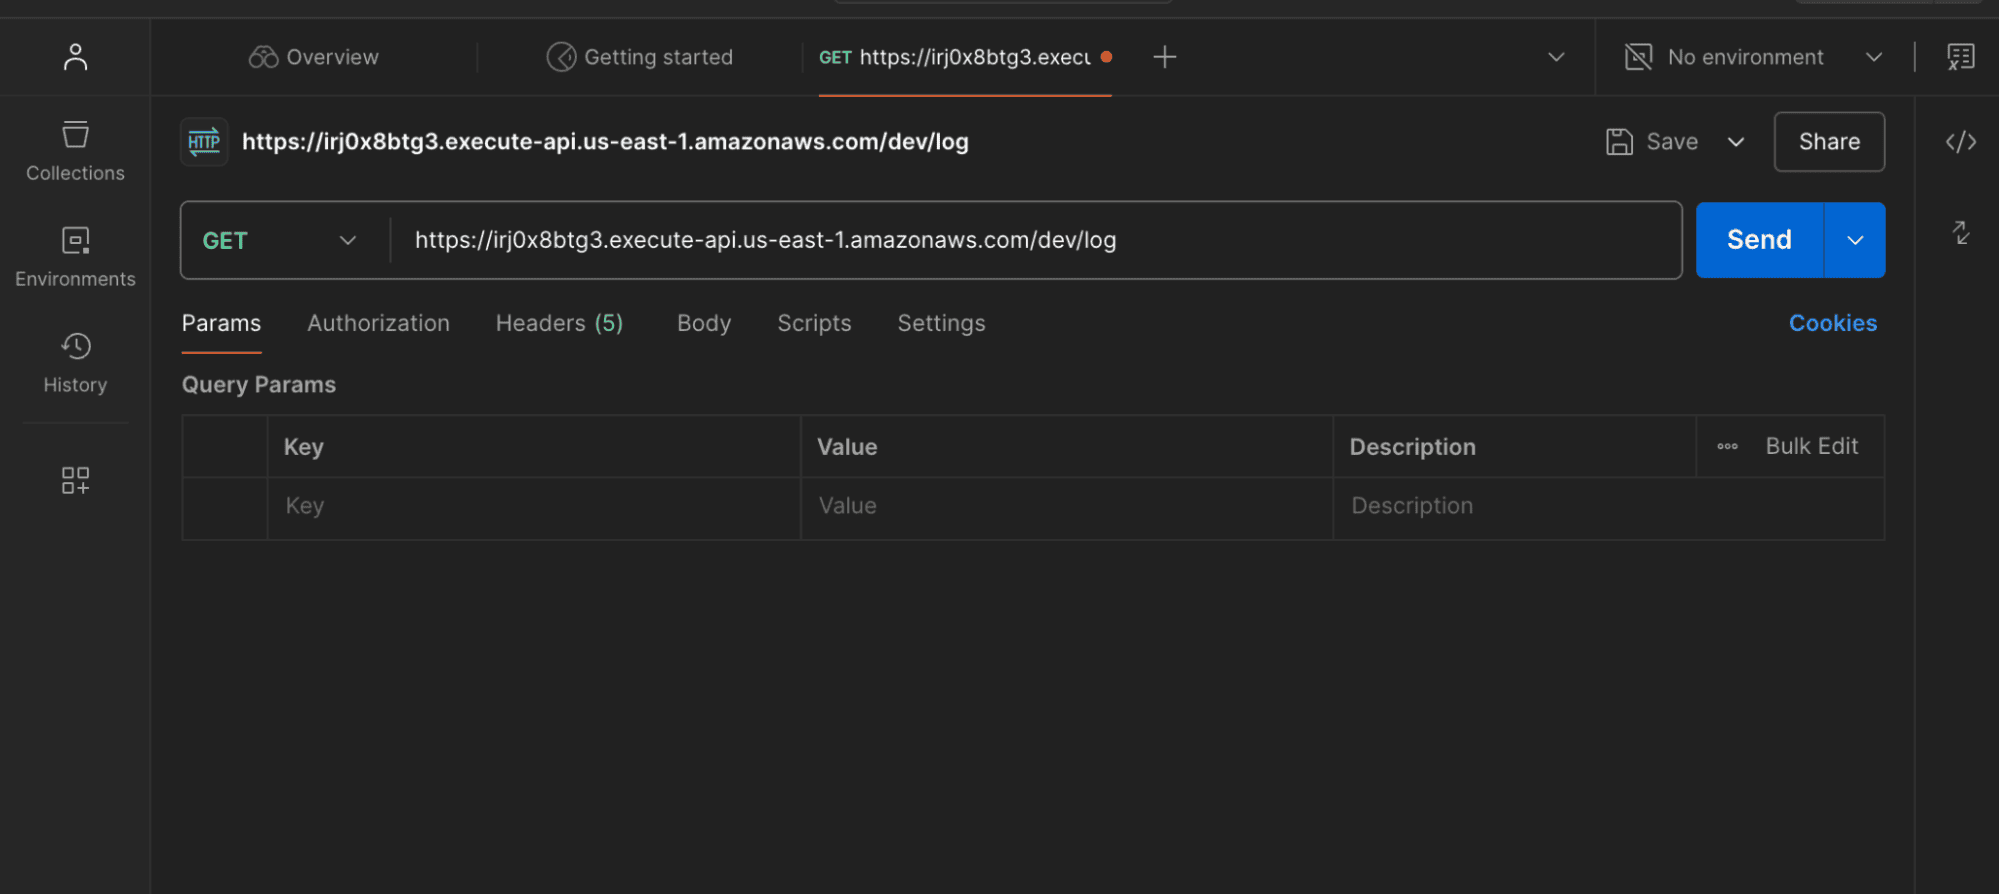
Use a tool like Postman or curl to make a GET request to your API endpoint:
curl -X GET https://irj0x8btg3.execute-api.us-east-1.amazonaws.com/dev/log
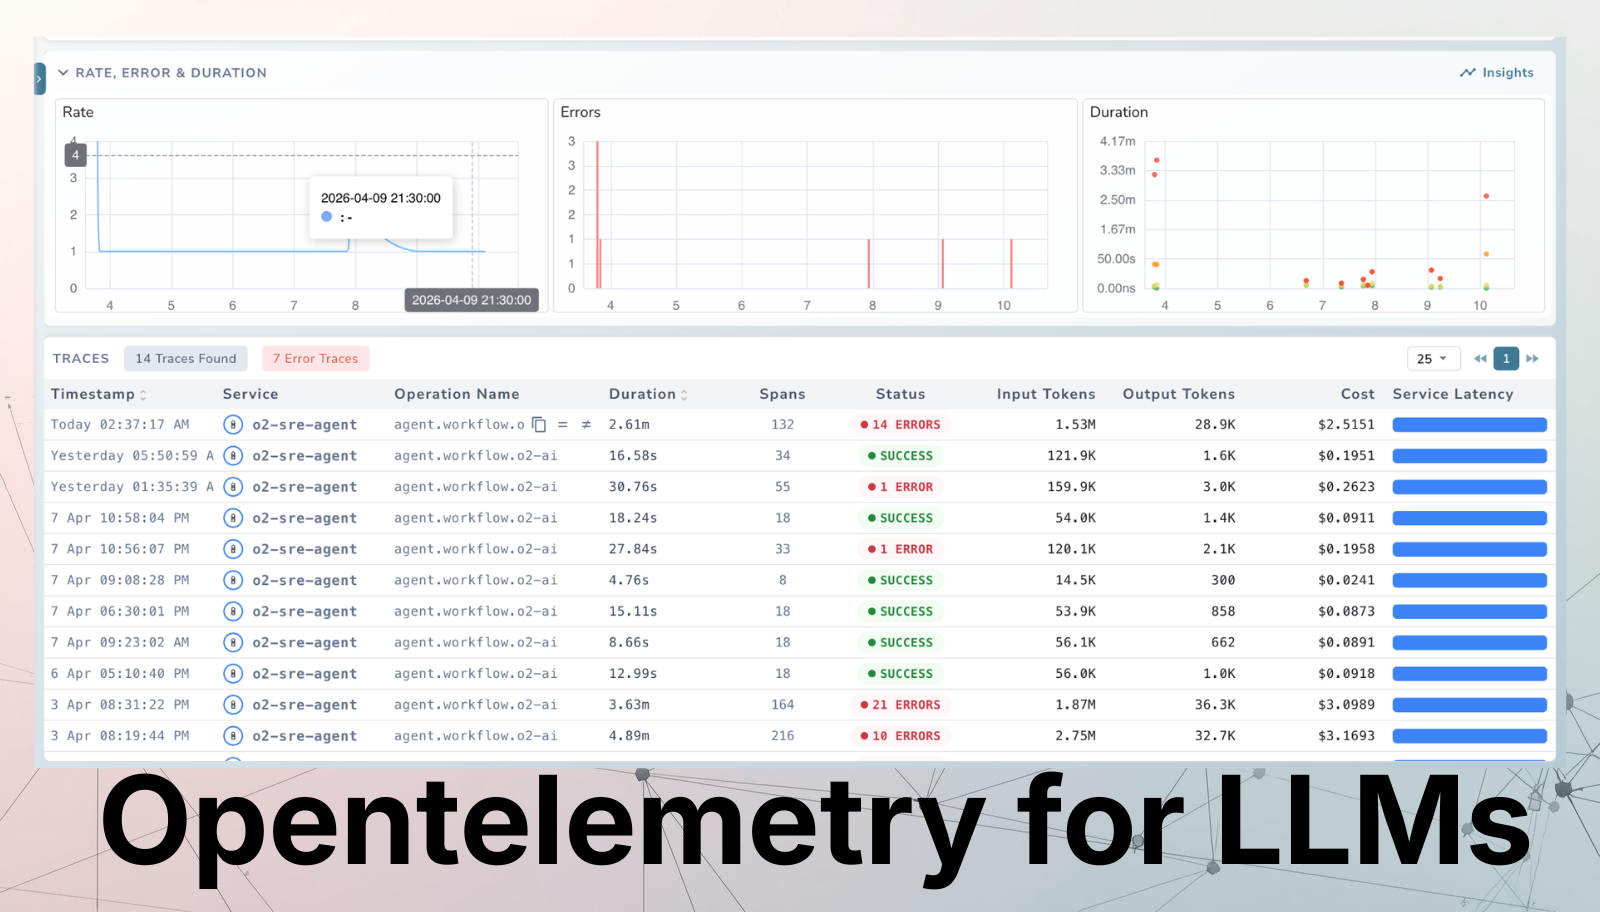
 Once you've invoked your API a few times with different test cases, you should be able to see meaningful logs within OpenObserve:
Once the above steps are completed, logs are ingested into OpenObserve, you can visualize and analyze them using dashboards. You can download the dashboards here.
level=error).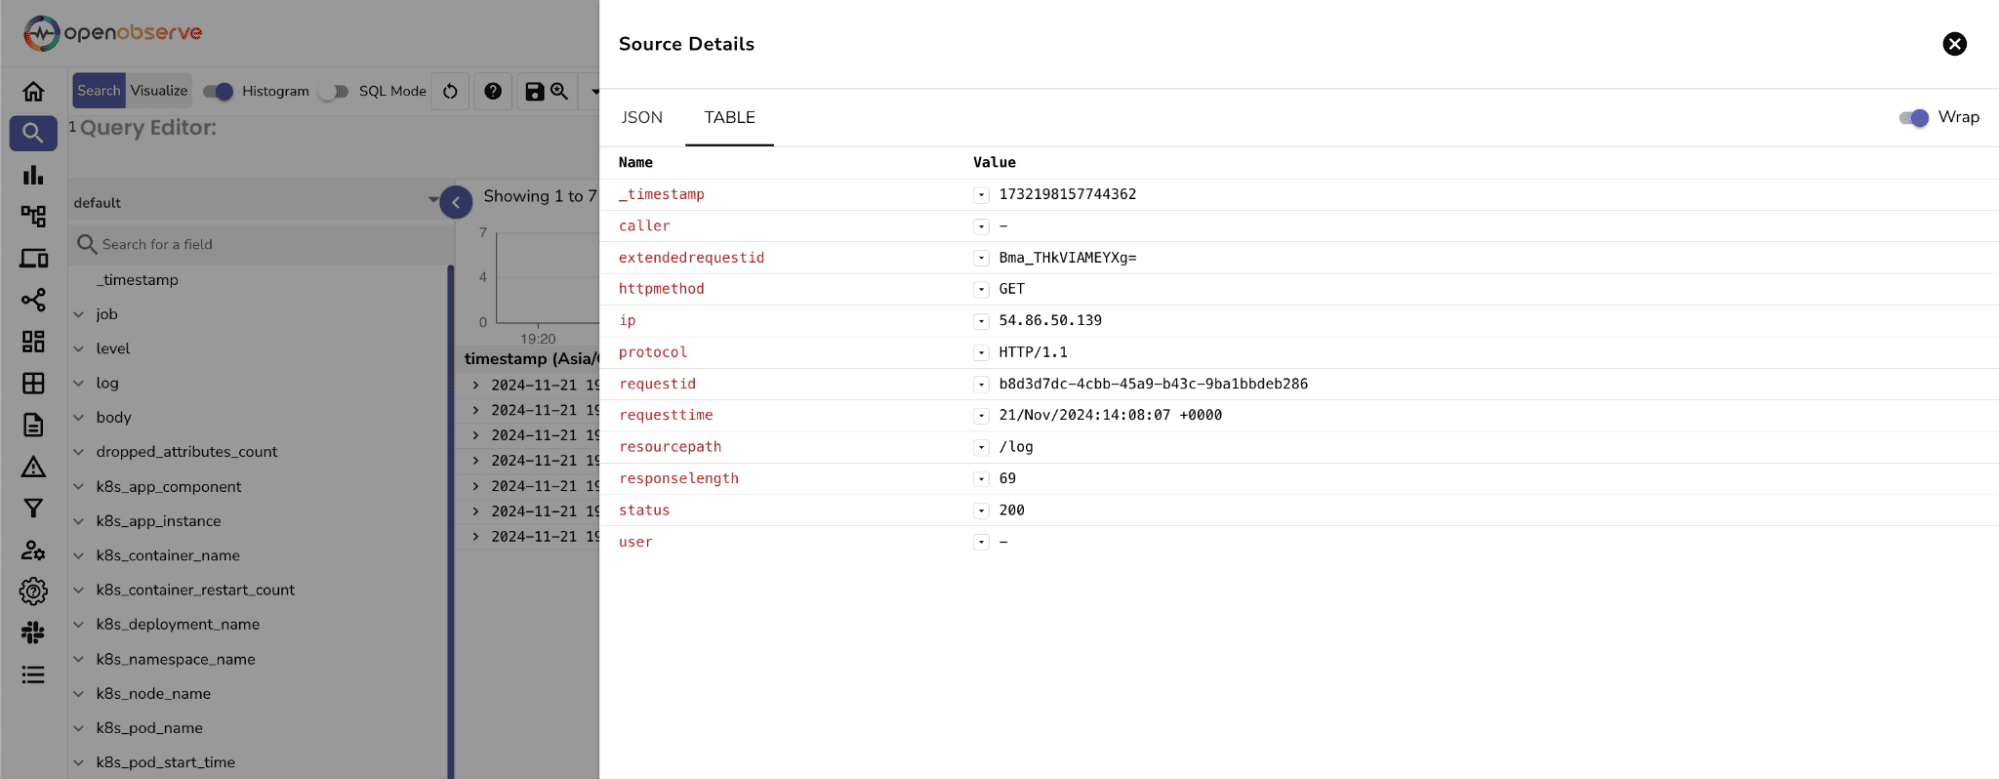
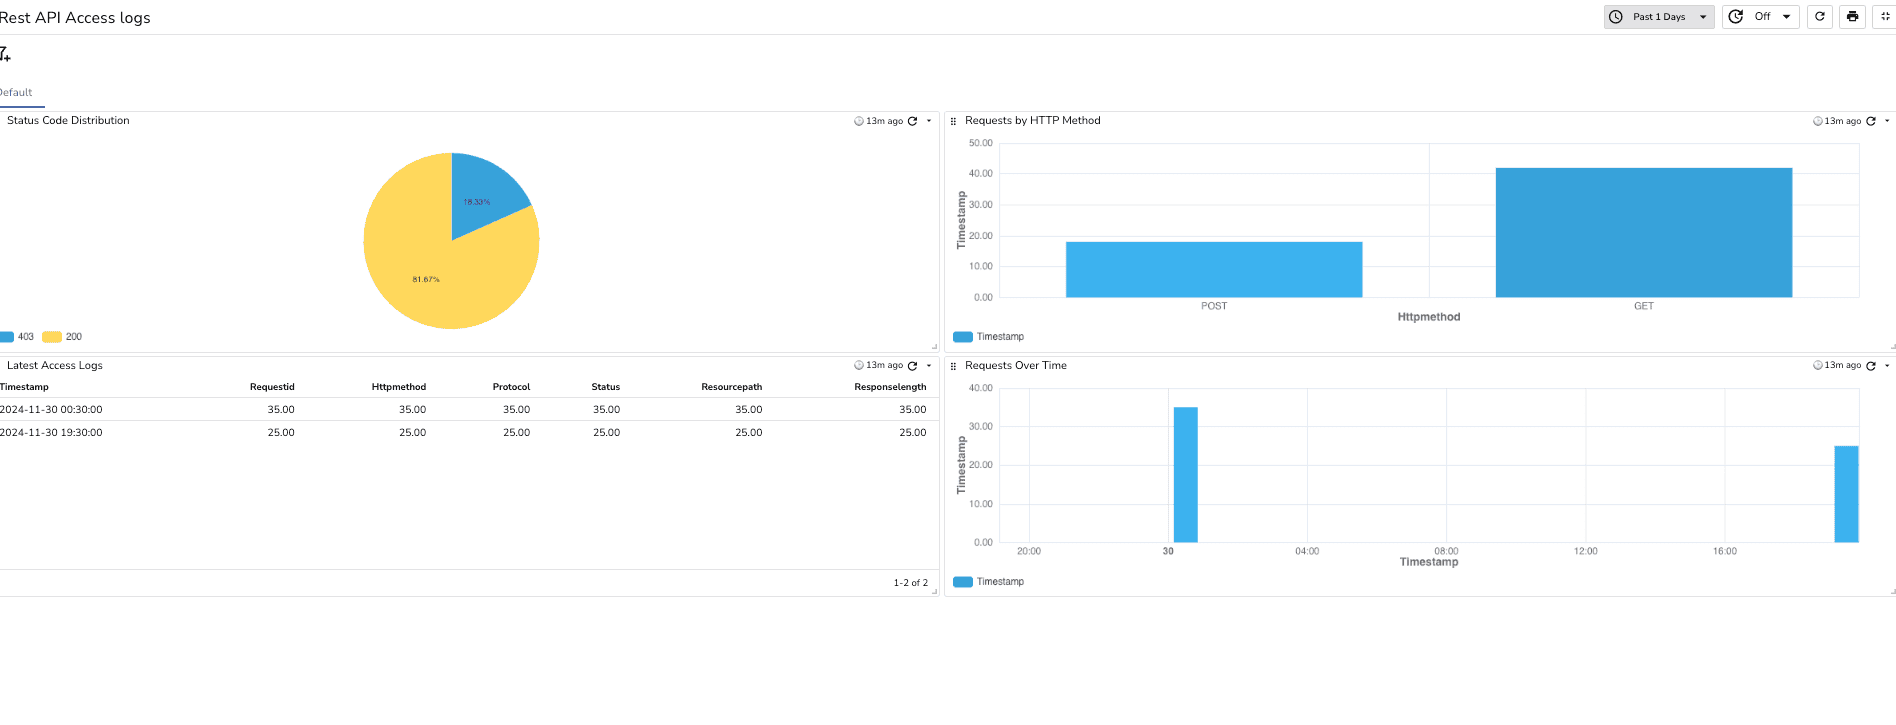
Status Code Distribution:
Requests by HTTP Method:
Latest Access Logs Table:
Requests Over Time:
You can now run queries on these logs and dashboard for further analysis and continuous monitoring. You've successfully created a robust and scalable system to monitor logs for your REST API!
If you encounter issues with your setup, pay attention to the following:
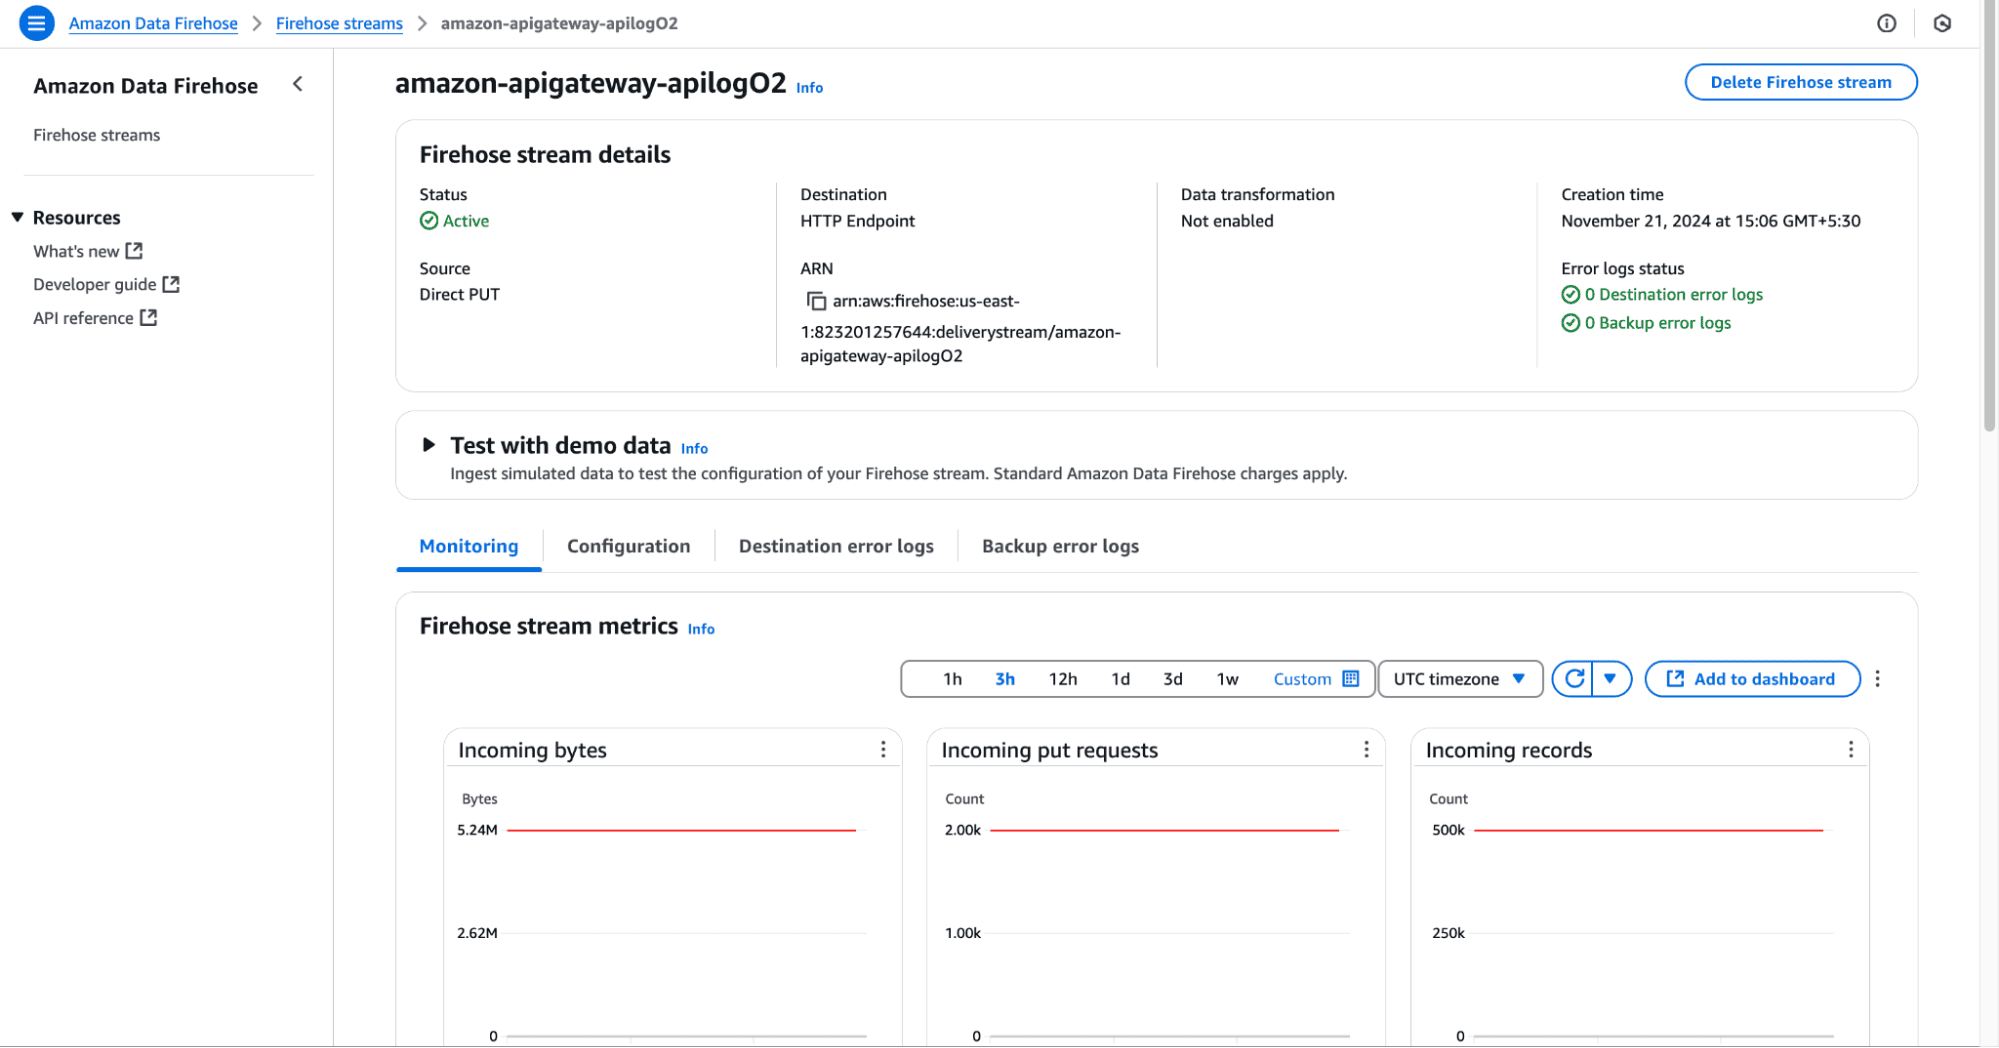
arn:aws:firehose:{region}:{account-id}:deliverystream/amazon-apigateway-{your-stream-name}
Note: The name of your Firehose stream must be amazon-apigateway-{your-stream-name}. This naming convention is crucial for the integration to work seamlessly.
If logs are not appearing in OpenObserve, double-check that your API Gateway is configured correctly to send logs to the specified Firehose stream. Ensure that the logging settings are enabled and that the API Gateway has the necessary permissions to write to Kinesis Firehose.
To ensure that your API Gateway can successfully log to Kinesis Firehose, it's important to set up appropriate permissions. You can follow the guidelines provided in the AWS documentation to configure the necessary IAM roles and policies. For detailed instructions, refer to the following link:
Setting Up Kinesis Access Logging Permissions.
To further enhance your monitoring capabilities, consider exploring additional features and best practices. The comprehensive guide on integrating AWS CloudWatch Logs with Amazon Kinesis Firehose provides valuable insights on improving your monitoring with OpenObserve. This guide will help you streamline your logging process and gain deeper insights into your API performance:
Manas is a passionate Dev and Cloud Advocate with a strong focus on cloud-native technologies, including observability, cloud, kubernetes, and opensource. building bridges between tech and community.