How to Monitor Nginx in Real-Time: Step-by-Step Guide for Tracking Logs, Metrics, and Performance Insights


Try OpenObserve Cloud today for more efficient and performant observability.
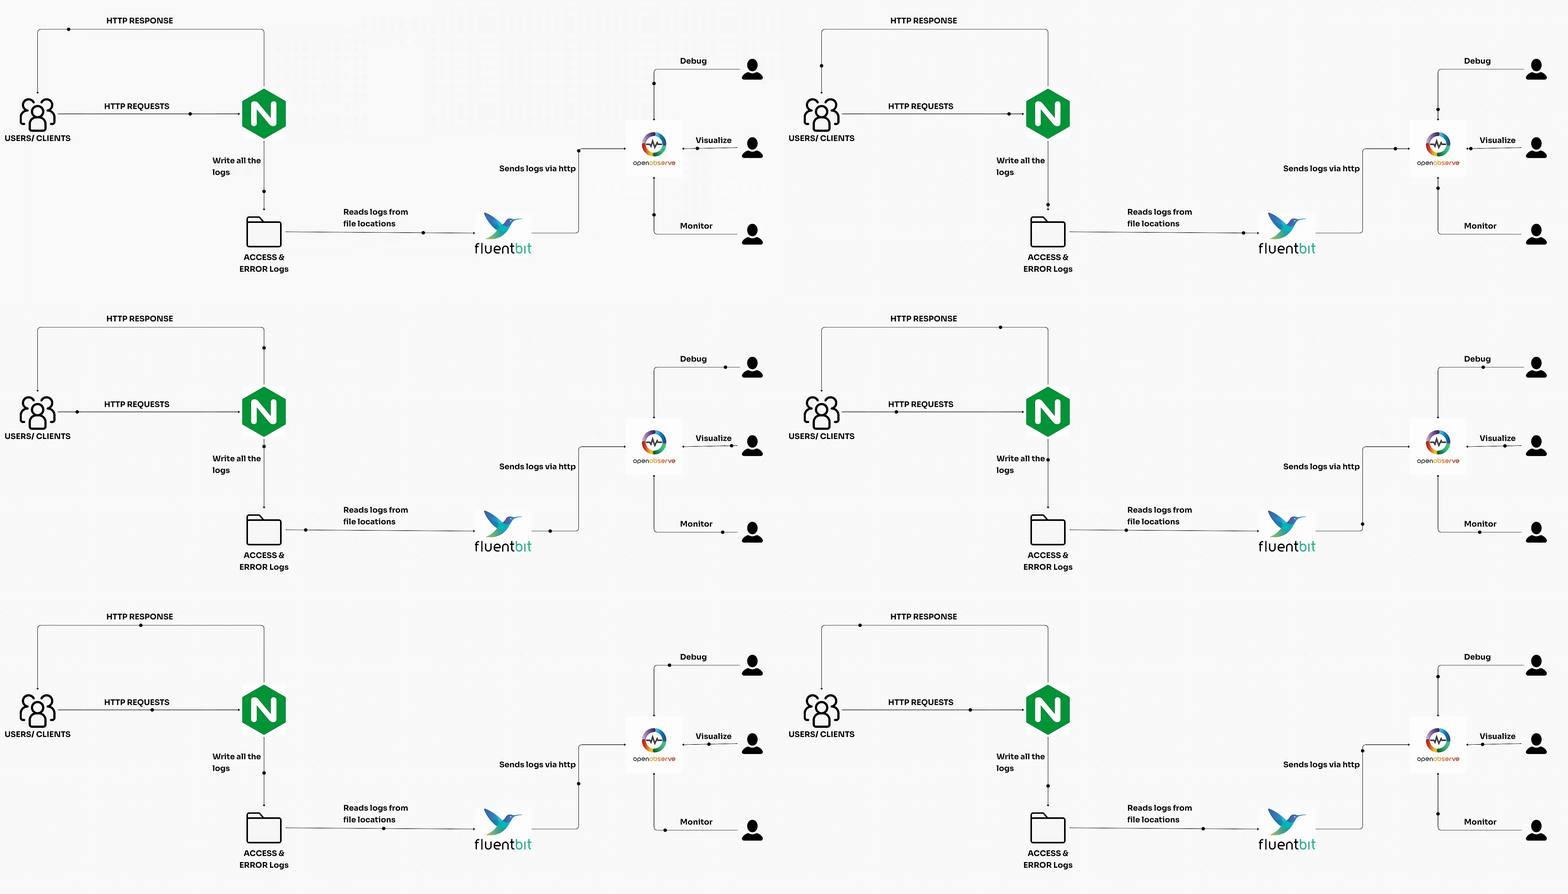
In this hands-on guide, we’ll explore how to set up monitoring for NGINX using OpenObserve, capturing real-time metrics, logs, and performance insights. This is crucial for system administrators and developers looking to track NGINX performance, diagnose issues, and maintain the reliability of their applications.
What do we cover?
So let’s get going!
Monitoring NGINX is essential for understanding how your web server is performing and identifying issues before they impact users. Real-time monitoring provides crucial insights into various aspects of your server's operation. Let's explore the key metrics and their importance:
| Metric | Importance |
|---|---|
| Request Rate | Indicates server load and traffic patterns |
| Response Time | Measures server performance and user experience |
| Error Rate | Highlights potential issues or misconfigurations |
| Bandwidth Usage | Helps in capacity planning and optimization |
| Active Connections | Shows concurrent users and server capacity |
By tracking these metrics, you can:
Real-time monitoring of these key metrics allows you to maintain a high-performing, reliable NGINX server that can handle your application's demands efficiently.
If you would like to explore Nginx observability with Vector and interested in applying VRL functions, you can always refer to this blog.
If NGINX is not already installed, use Homebrew to install it:
brew install nginx
Once installed, start NGINX using it by entering below command:
sudo nginx
You can verify that it’s running by accessing http://localhost:8080 in your browser.

To capture detailed logs for monitoring, we’ll configure NGINX to log requests in JSON format.
# use vi or nano or anything you prefer to edit
sudo vi /opt/homebrew/etc/nginx/nginx.conf
Below confirguration tell nginx to write logs in JSON format instead of it’s default format. Doing this makes log analysis a lot easy and you do not need to do anything more to parse the logs before analysis.
You should do this always whenever you setup nginx to make your life easier.
log_format json_combined escape=json '{"@timestamp":"$time_iso8601",'
'"remote_addr":"$remote_addr",'
'"request":"$request",'
'"status":"$status",'
'"body_bytes_sent":"$body_bytes_sent",'
'"http_referer":"$http_referer",'
'"http_user_agent":"$http_user_agent"}';

access_log /opt/homebrew/var/log/nginx/access.log json_combined;
sudo nginx -s reload
Let’s set up Fluent Bit to collect the NGINX logs and forward them to OpenObserve.
brew install fluent-bit
vi nginx-fluent-bit.conf
#Add the following configuration to read the NGINX access log and send to o2
[INPUT]
Name tail
Path /opt/homebrew/var/log/nginx/access.log
Parser json
Tag nginx-access
DB /var/log/fluent-bit-nginx-access.db
Mem_Buf_Limit 5MB
Skip_Long_Lines On
[OUTPUT]
Name http
Match *
URI /api/default/default/_json #/api/<org>/<stream>/_json
Host localhost
Port 5080
tls Off
Format json
Json_date_key _timestamp
Json_date_format iso8601
HTTP_User test@example.com
HTTP_Passwd <your password>
compress gzip
To obtain the fluent-bit configuration for ingestion, please go to Ingestion -> custom -> logs -> FluentBit
The password shown in the image is a local test password.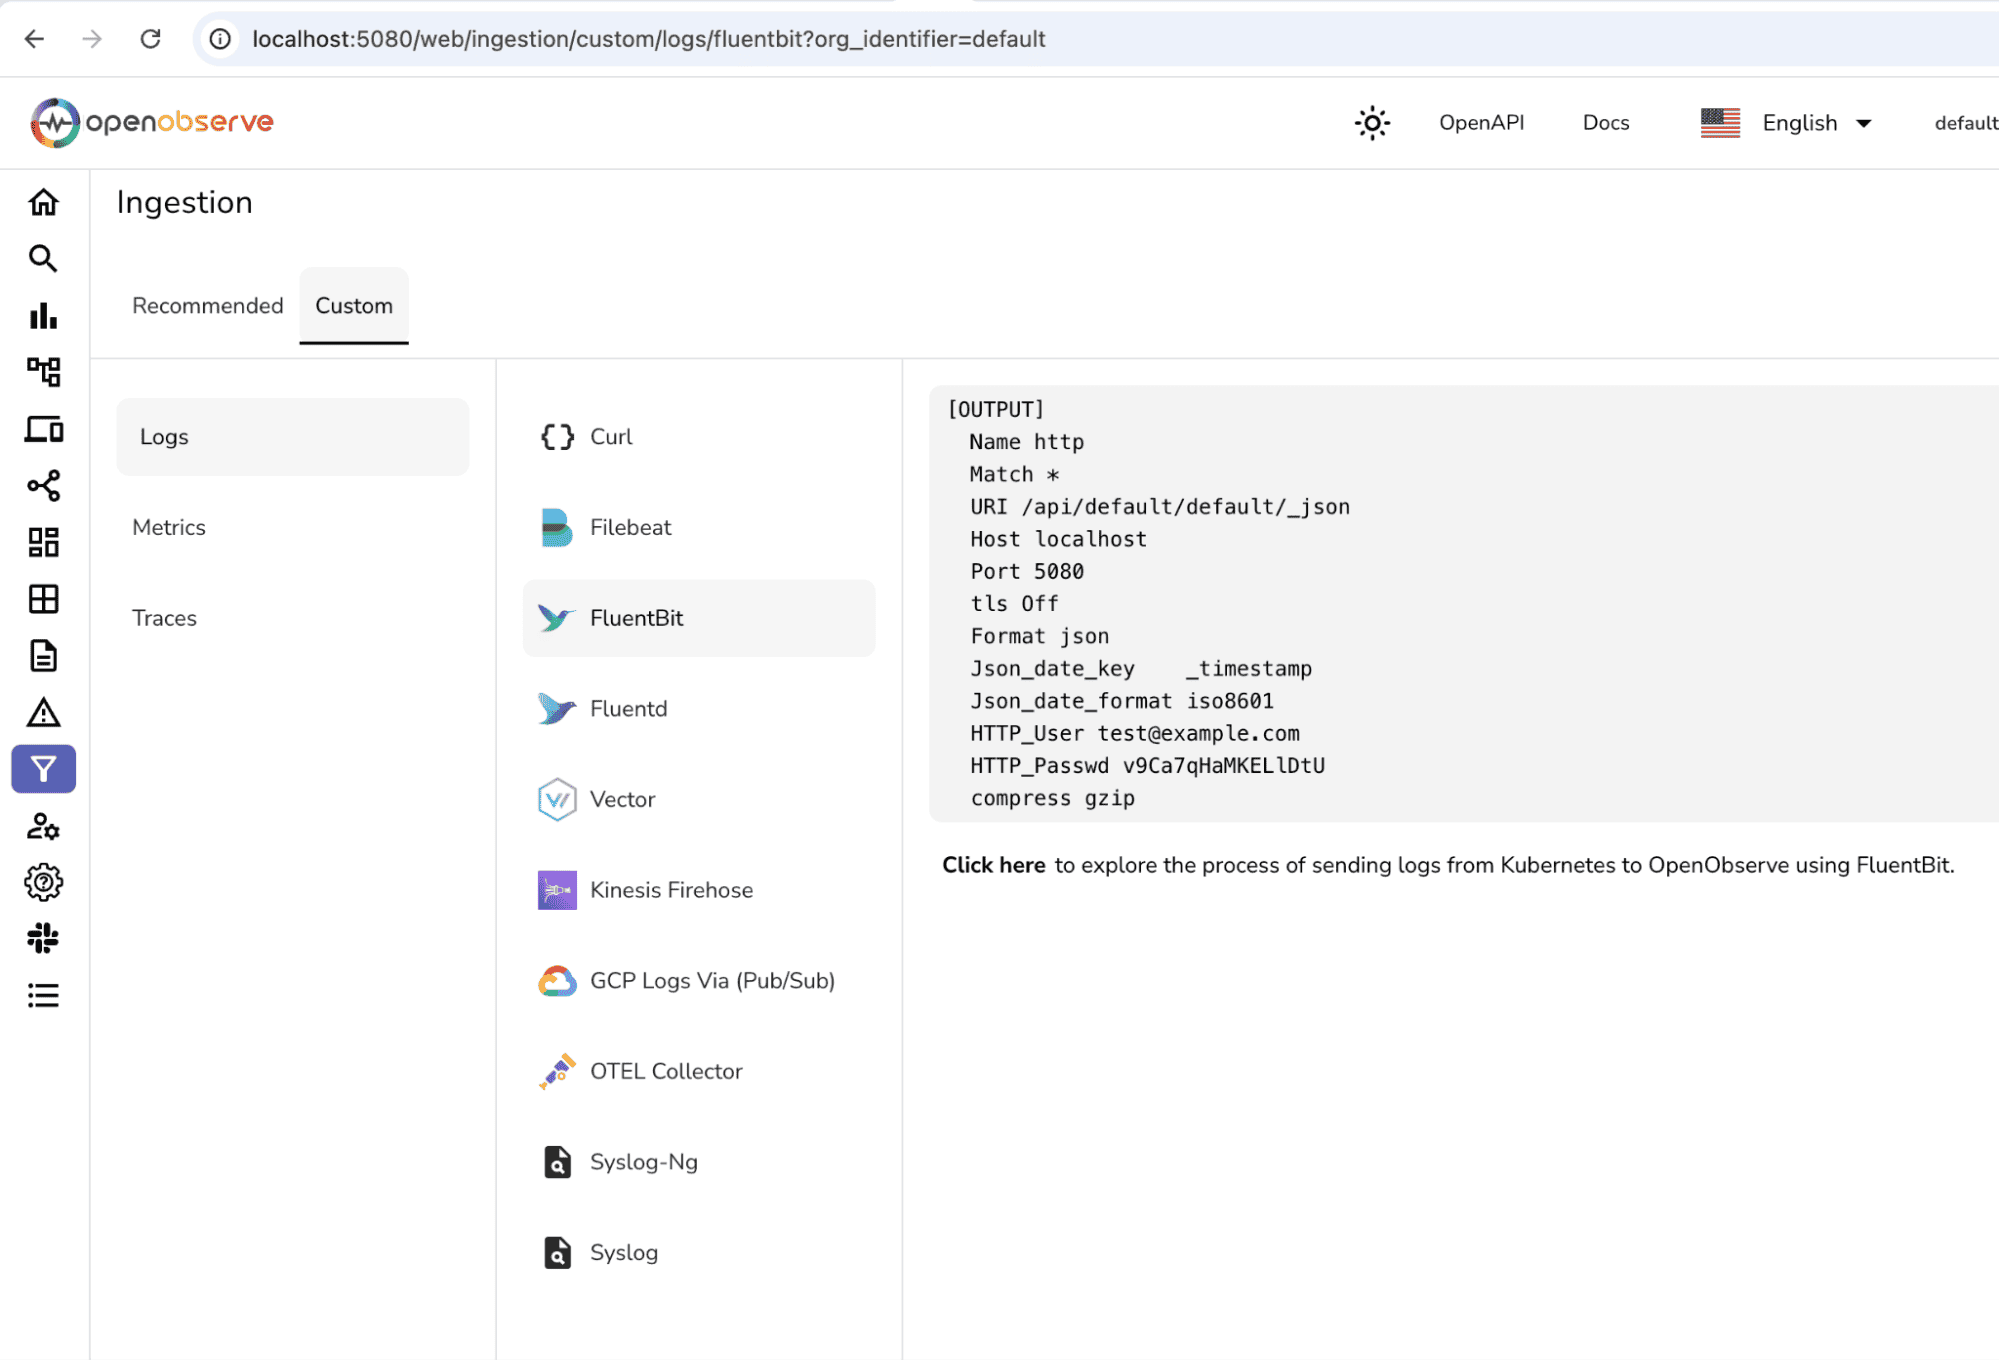
fluent-bit -c nginx-fluent-bit.conf
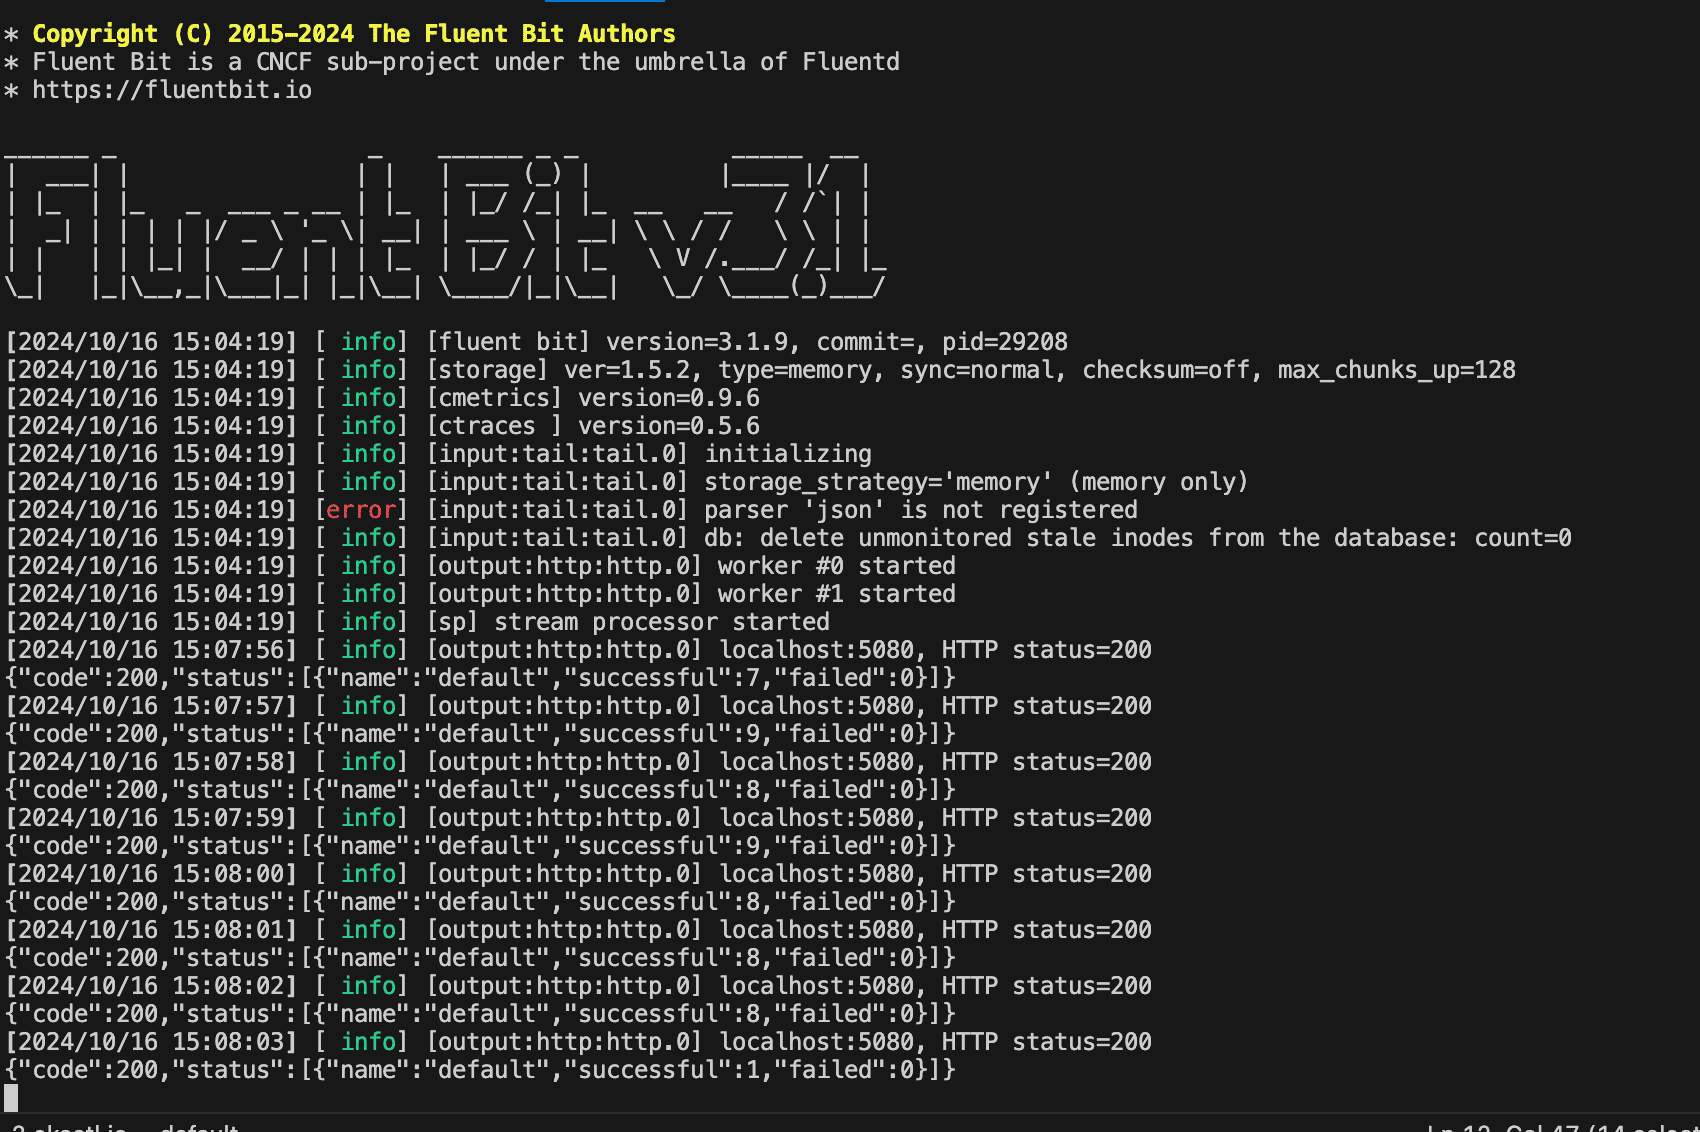
To test your setup and generate some log data, you can create a script to send repeated requests to the NGINX server.
vi nginx-load.sh
#!/bin/bash
for i in {1..1000}
do
  curl -s http://localhost:8080 > /dev/null
  echo "Request $i sent."
  sleep 0.1
done
chmod +x nginx-load.sh
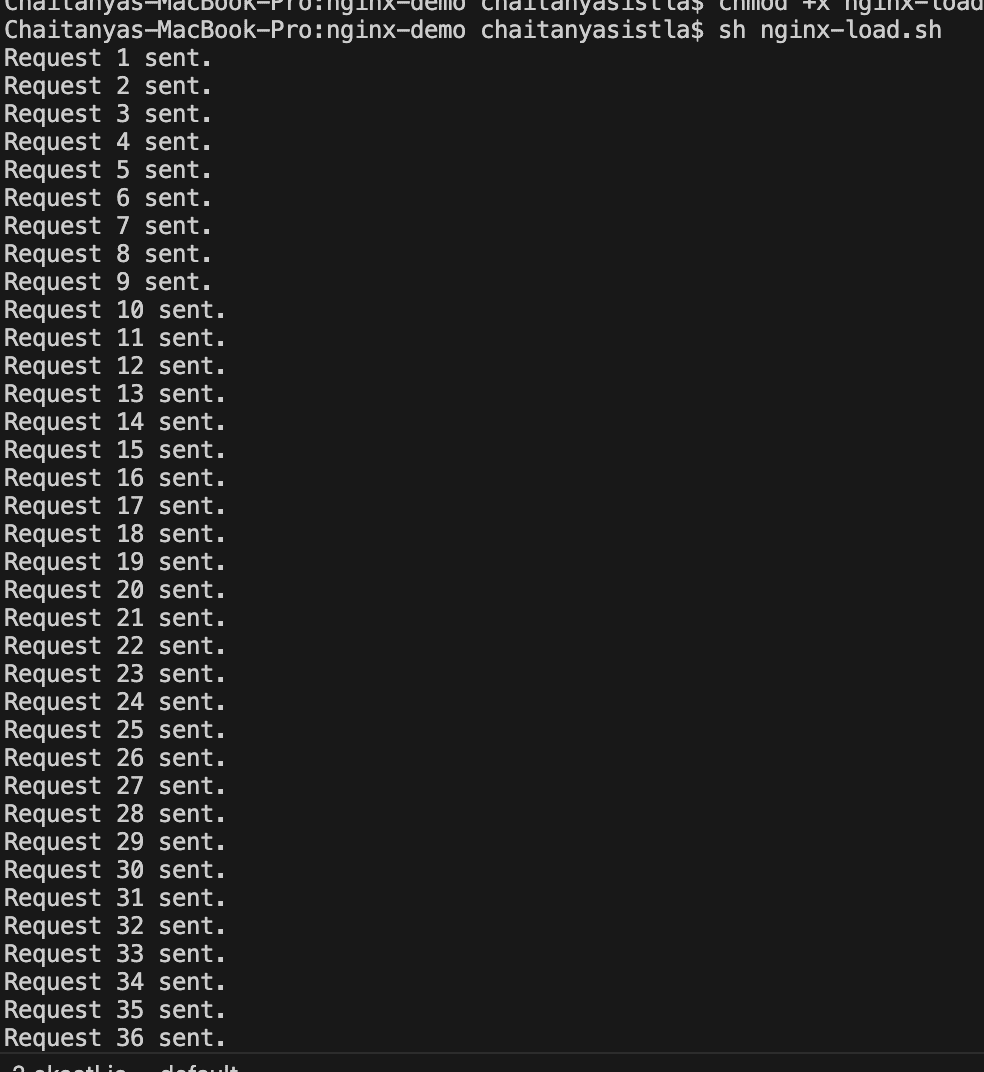
sh nginx-load.sh
As the script runs, you will generate log entries in the NGINX access log, which Fluent Bit will forward to OpenObserve.
If you don’t have OpenObserve running, you can set it up quickly using the below script to auto start everything. The below script can automate end to end setup.
https://github.com/openobserve/rum-demo/blob/main/openobserve-setup/setup_openobserve.sh
If you want to set up OpenObserve from scratch you can always visit here for more detailed steps.
Make sure OpenObserve is accessible at http://localhost:5080
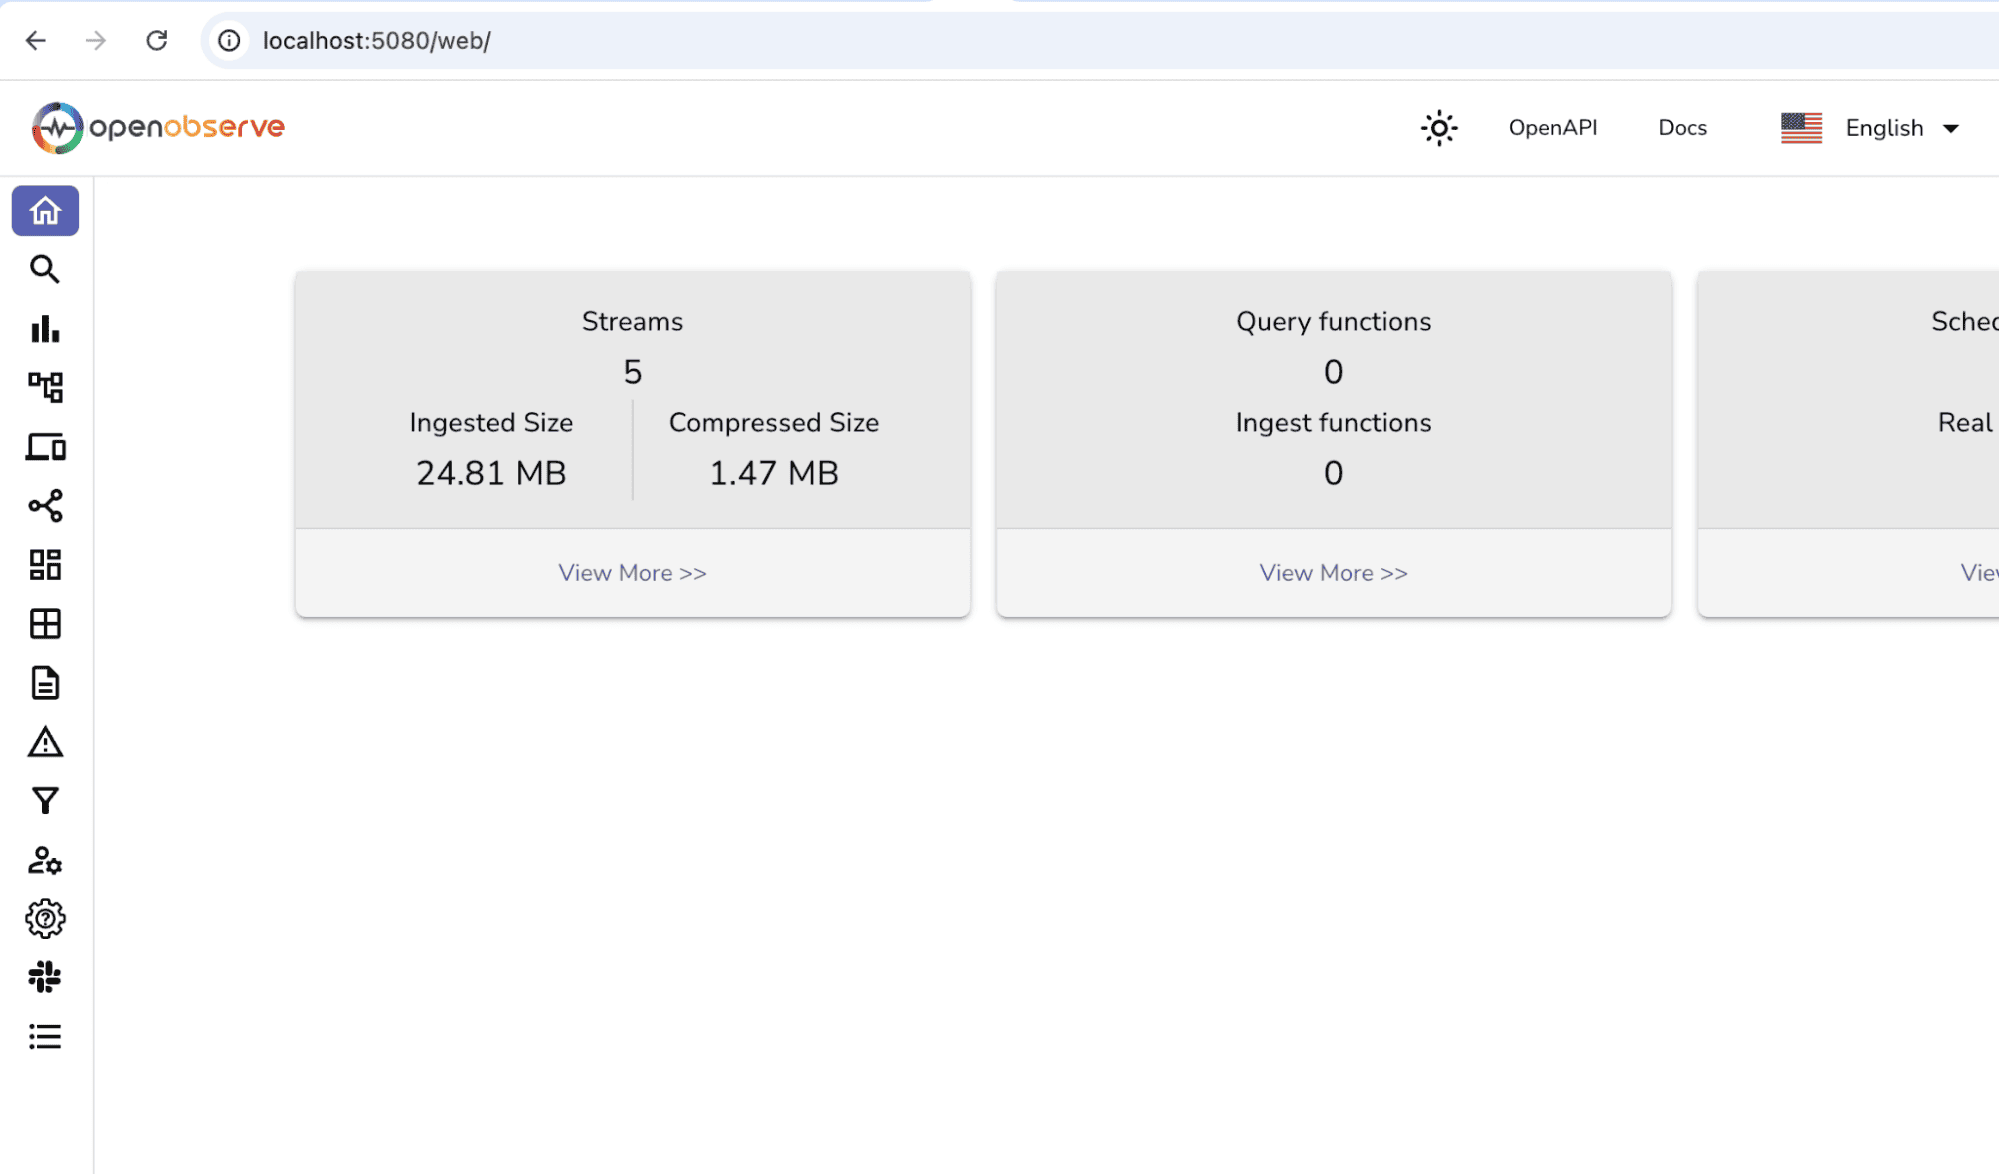
Now that logs are being forwarded to OpenObserve, you can verify that the data is arriving and being ingested properly.
You should see log entries similar to the following:
{
  "_timestamp": 1729109276178847,
  "log": {
    "@timestamp": "2024-10-16T15:07:55-05:00",
    "remote_addr": "127.0.0.1",
    "request": "GET / HTTP/1.1",
    "status": "200",
    "body_bytes_sent": "615",
    "http_referer": "",
    "http_user_agent": "curl/8.7.1"
  }
}
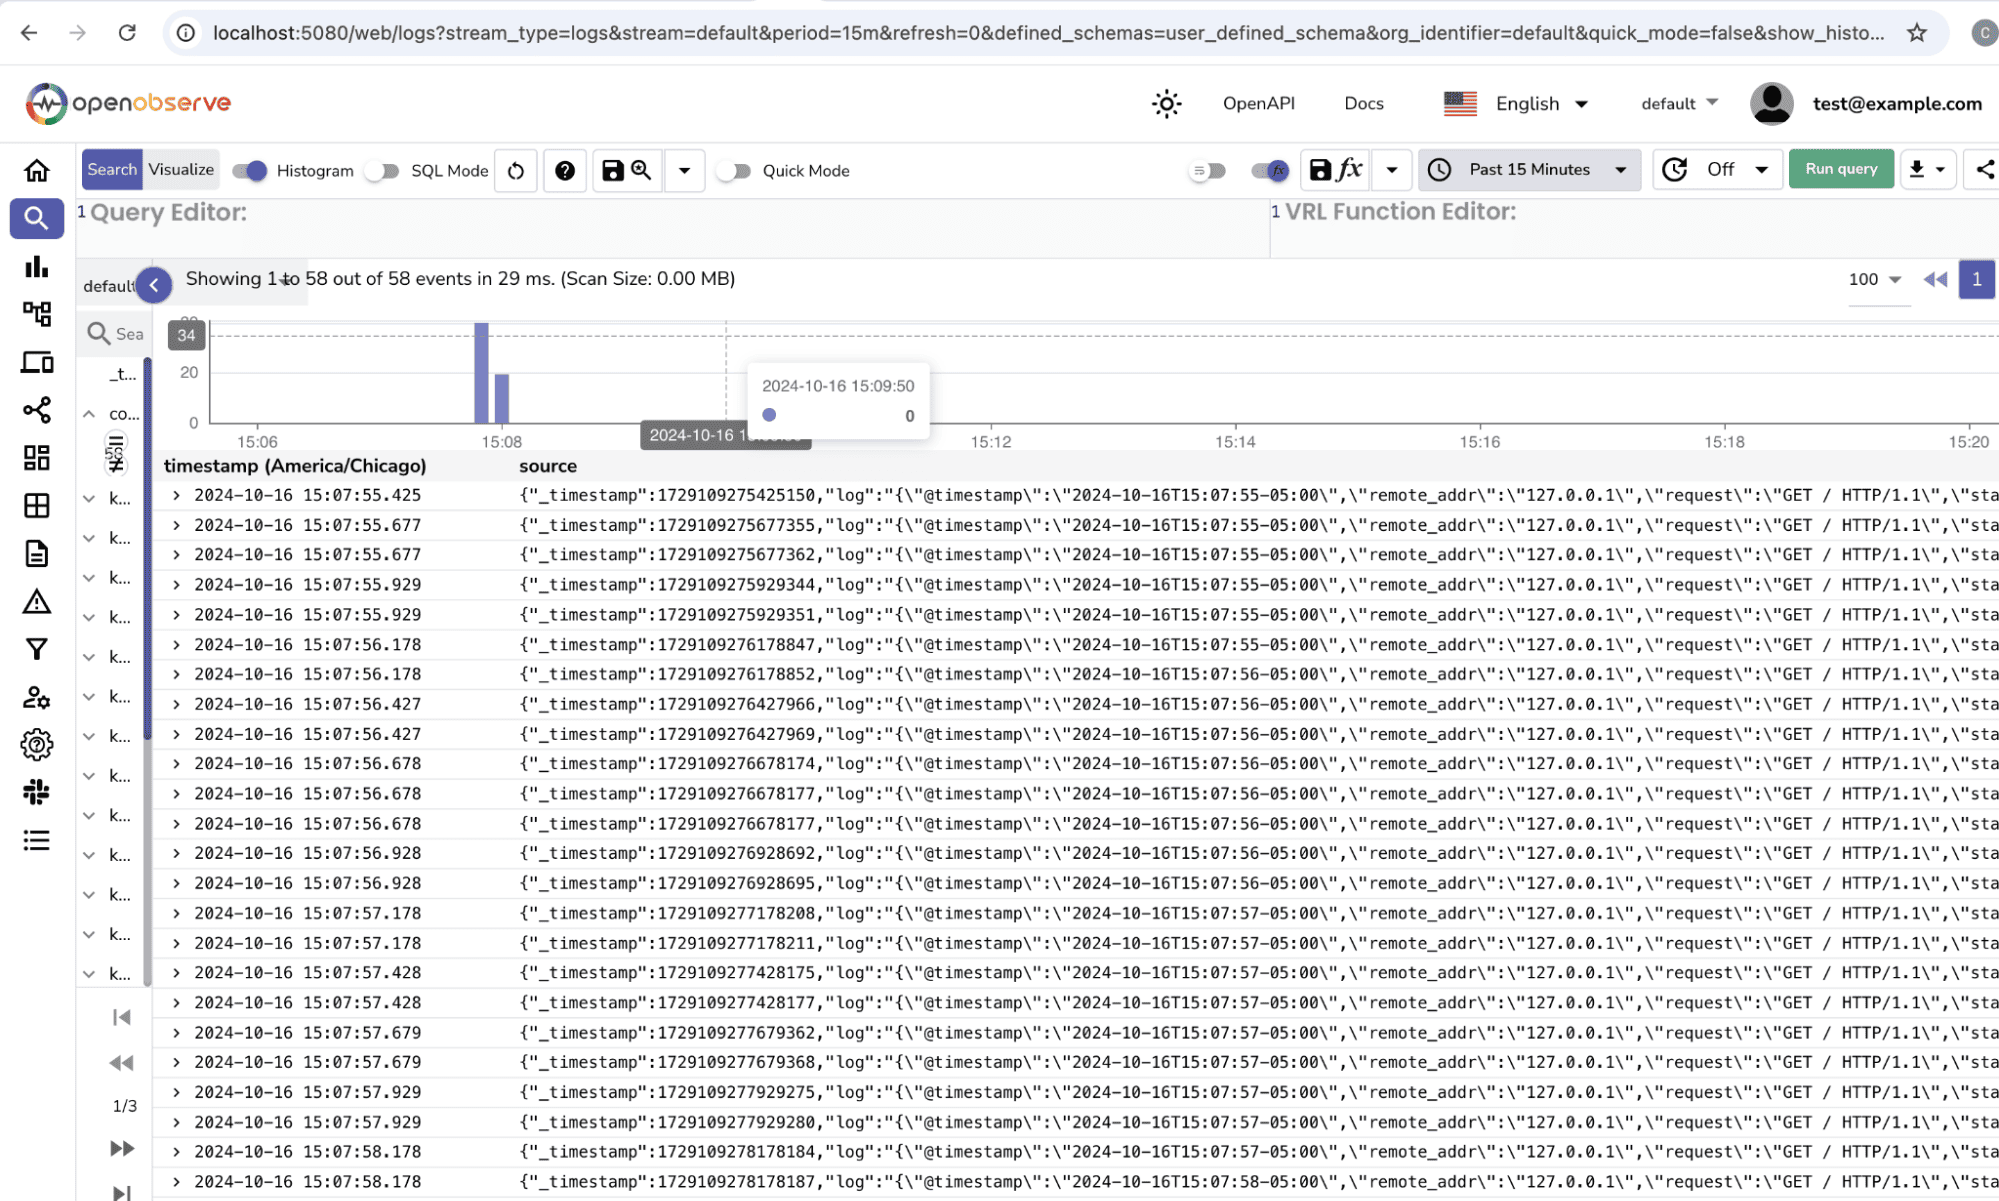
By integrating NGINX with OpenObserve, you've established a robust, real-time monitoring system that provides deep insights into your web server's performance. This setup allows you to track crucial metrics, analyze logs, and respond quickly to any issues that arise.
With the power of OpenObserve's customizable dashboards and alerting capabilities, you're now equipped to:
As you continue to work with this setup, consider exploring advanced features like anomaly detection and integrating additional data sources to create a comprehensive observability solution for your entire infrastructure.
Remember, effective monitoring is an ongoing process. Regularly review and refine your dashboards, alerts, and log analysis techniques to ensure you're always getting the most valuable insights from your NGINX monitoring setup with OpenObserve.

Chaitanya Sistla is a Principal Solutions Architect with 17X certifications across Cloud, Data, DevOps, and Cybersecurity. Leveraging extensive startup experience and a focus on MLOps, Chaitanya excels at designing scalable, innovative solutions that drive operational excellence and business transformation.