How to stream NodeJS application logs to OpenObserve!

Ashish Kolhe
October 02, 2023
3 min read
Don’t forget to share!
Try OpenObserve Cloud today for more efficient and performant observability.

🔥 Update: Check out our new blog post on Sending Pino Logs to OpenObserve: A Step-by-Step Guide for the latest and improved method of sending Pino logs to OpenObserve! We also recommend using our new npm library,
@openobserve/pino-openobserve, for a more streamlined integration. Learn how to leverage its enhanced features and performance in the new blog post.
In this blog, we are going to explore the process of sending NodeJS application logs to OpenObserve. Understanding how to efficiently send logs from applications, especially Node.js ones, can significantly boost observability and troubleshooting capabilities. Today, let’s dive deep into sending logs from a Node.js application to OpenObserve using the renowned Pino logger.
To make the most of this guide, ensure you have:
Pino stands out in the Node.js ecosystem due to its impressive speed and rich feature set. At its core, it's designed to produce JSON-focused logs that not only make them easily parseable but also make Pino highly performant.
While the default behavior is to log to stdout, Pino can be paired with utilities like pino-pretty for a more human-friendly output. Additionally, it supports integration with multiple transport mechanisms, making it versatile for different logging platforms.
Here’s a snapshot of a simple Node.js application that employs Pino:
const express = require("express");
const PORT = parseInt(process.env.PORT || "8080");
const app = express();
const pino = require("pino");
const logger = pino();

app.get("/hello", (req, res) => {
  logger.info({ log: "entry get hello", type: "GET", url: "/hello" });
  setTimeout(() => {
    res.send("Hello World");
  }, 1000);
});
app.listen(PORT, () => {
  console.log(`Listening for requests on http://localhost:${PORT}`);
});
Once you access http://localhost:8080/hello, the console showcases:
{"level":30,"time":1696257417125,"pid":74041,"hostname":"test-demo","log":"entry get hello","type":"GET","url":"/hello"}
For a deeper dive into Pino's capabilities, consult the Pino documentation.
Begin by adding pino-elasticsearch as a dependency:
npm install pino-elasticsearch --save
Now, adapt your application to utilize 'pino-elasticsearch'. This module forwards logs to the _bulk API (compatible with Elasticsearch). Conveniently, OpenObserve supports this very same API for logs ingestion.
Adjust your app as follows:
Please remove const logger = pino(); from our app & add below lines to our application.
const pinoLogs = require("pino-elasticsearch");
const streamToOpenObserve = pinoLogs({
  index: "pino_logs",
  node: "http://localhost:5080/api/default/",
  esVersion: 7,
  flushBytes: 1000,
  auth: {
    username: "root@example.com",
    password: "ComplexPass#123",
  },
});
const logger = pino({ level: "info" }, streamToOpenObserve);
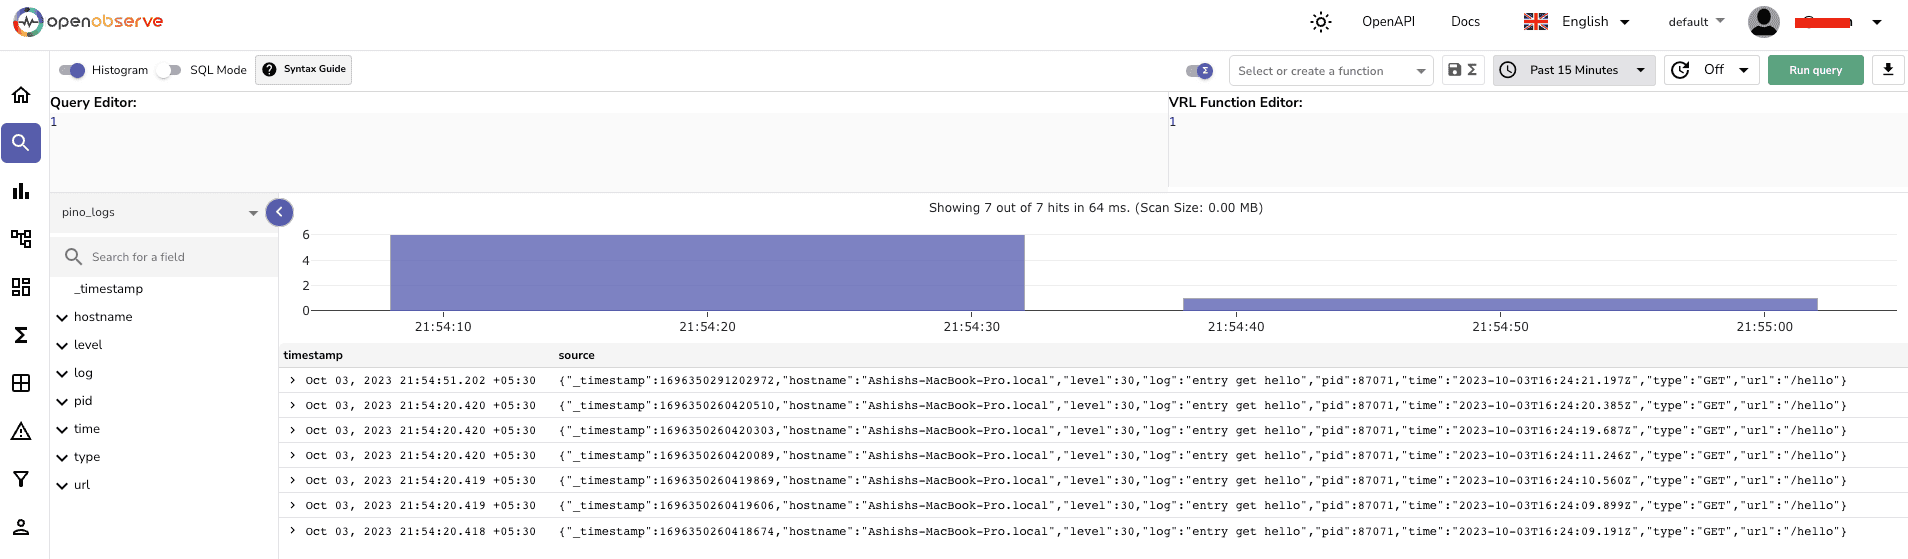
Upon implementing these changes, your application logs are seamlessly forwarded to the designated OpenObserve _bulk endpoint. Now, simply harness the OpenObserve UI to observe and analyze your logs, significantly enhancing the observability of your Node.js application within a Kubernetes environment.
Thank you for following this guide, and happy logging!
Ashish leads Engineering at OpenObserve. Ashish is obsessed with building high performance systems with simplicity in mind. He has vast experience in multiple disciplines like streaming, analytics, big data and more.