Getting Started with OpenObserve
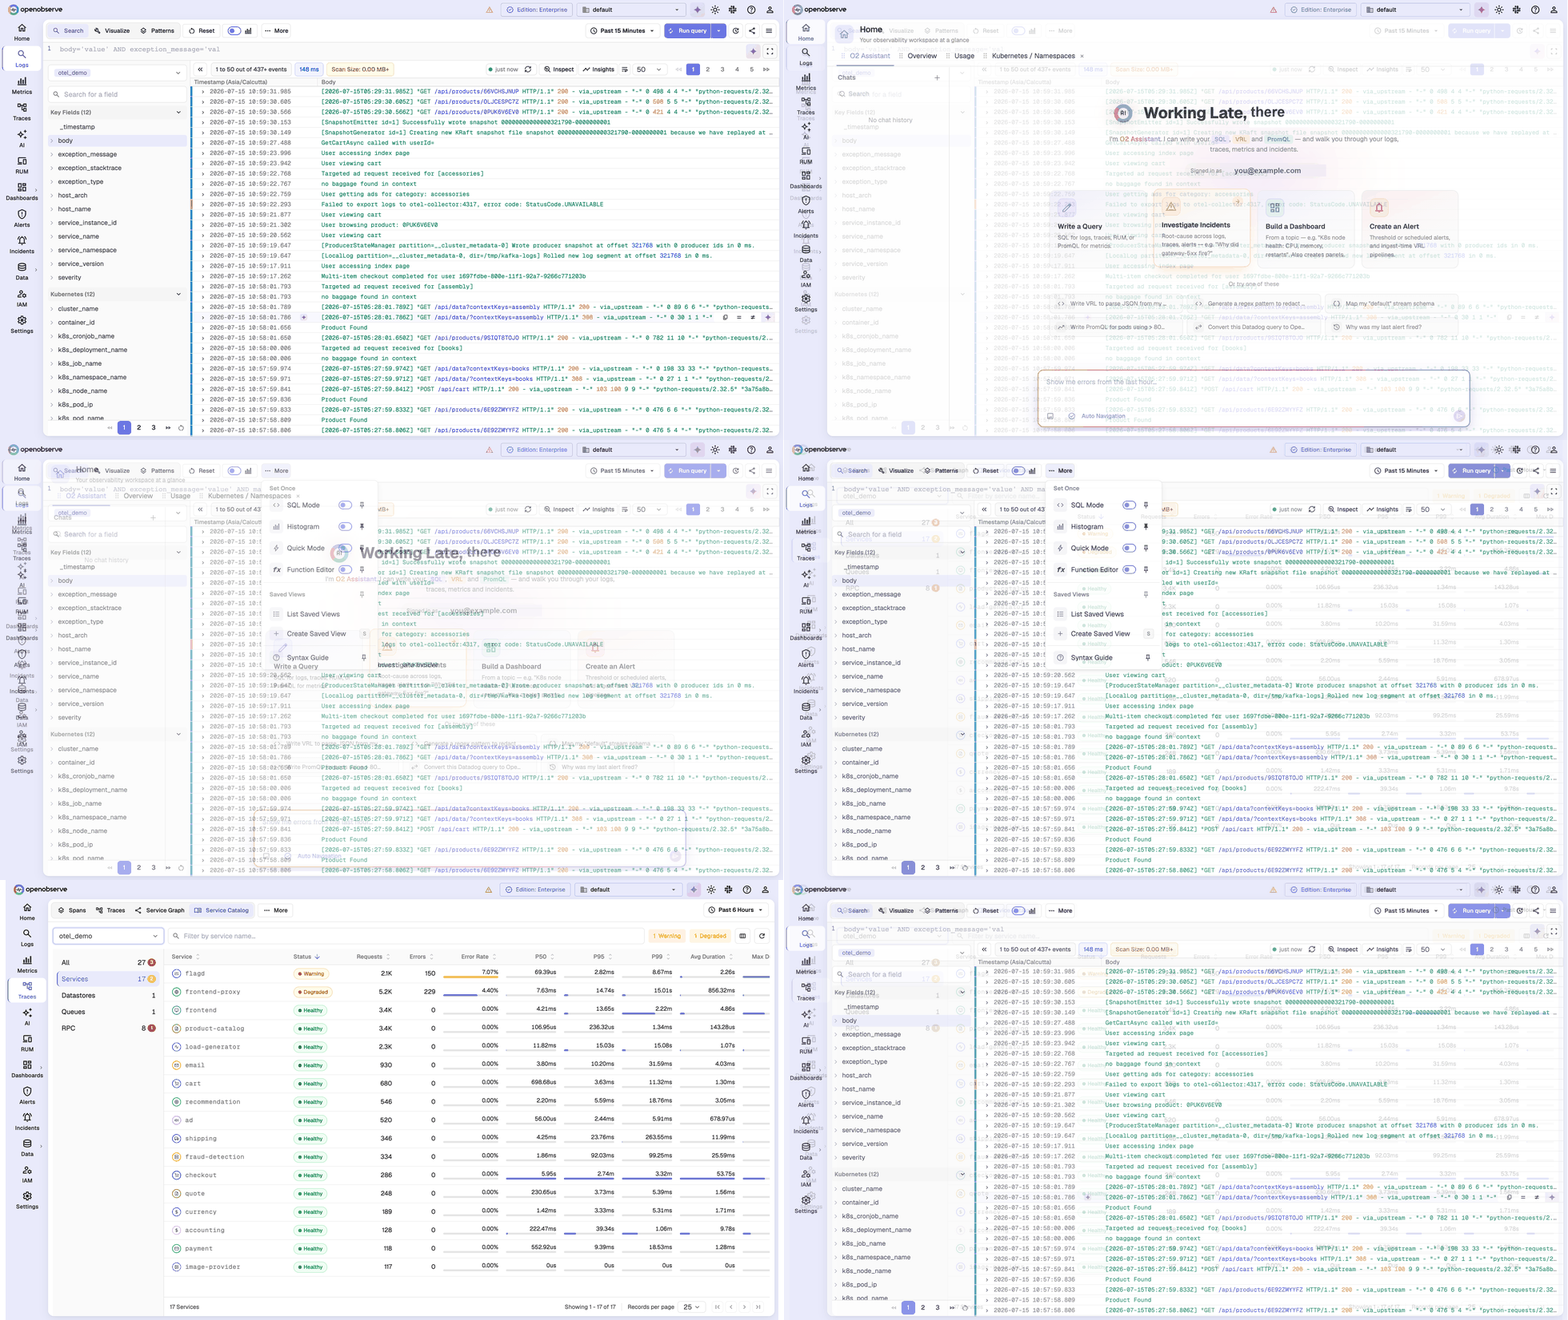
We optimized OpenObserve for speed and cost and let the UI take a backseat. You told us. Here is what we changed, and why we are not done.
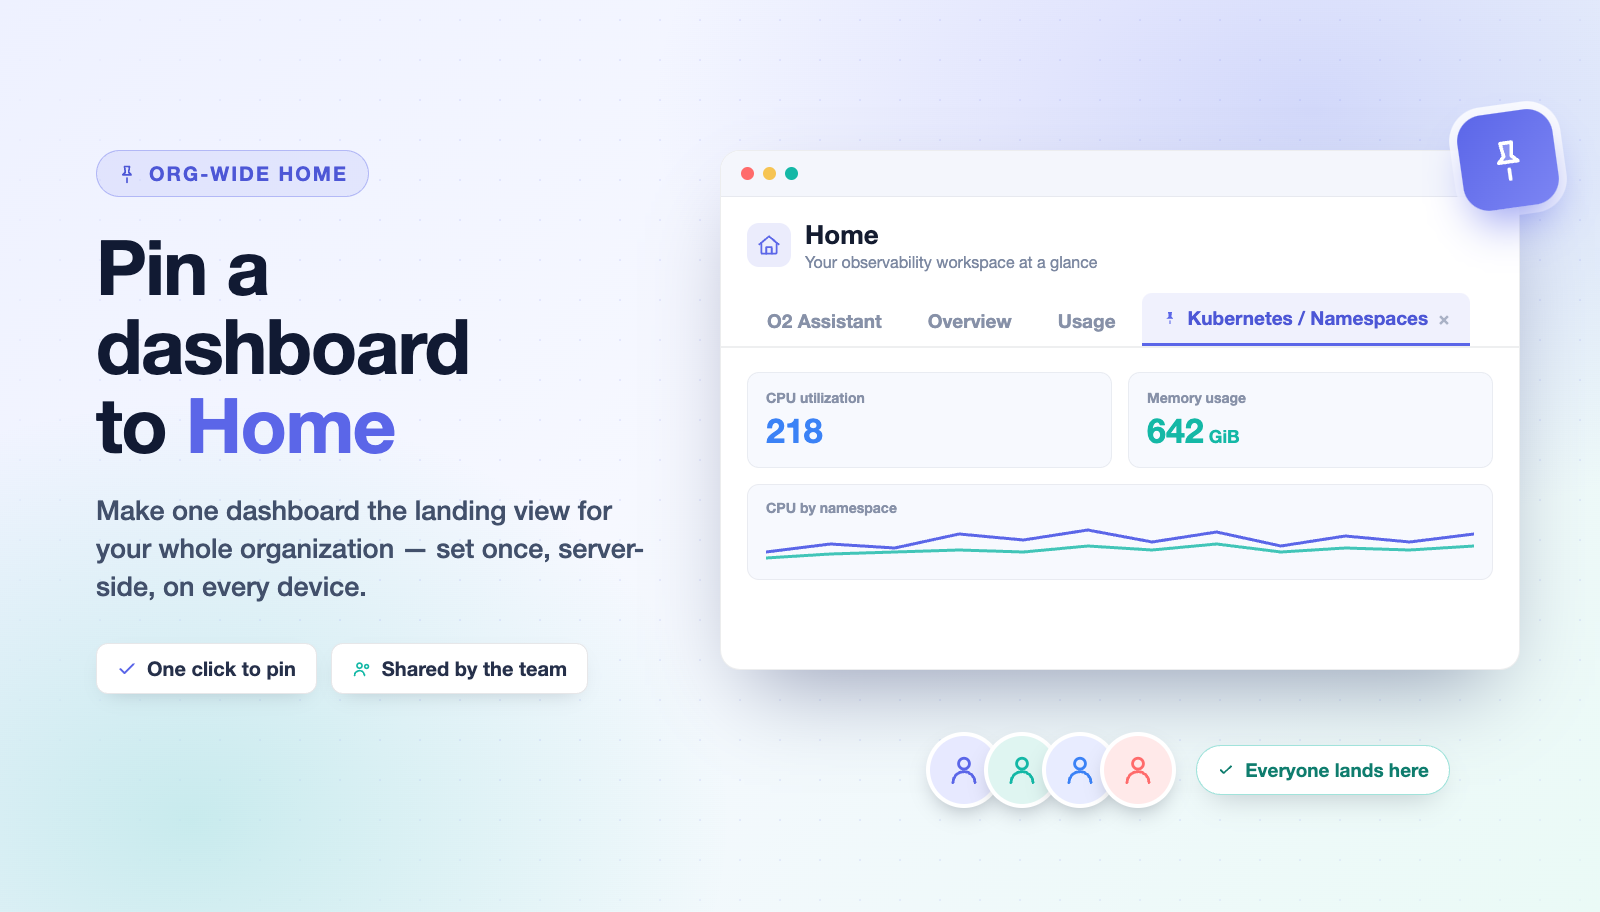
You asked, we shipped: make one dashboard the org-wide landing view in OpenObserve. Pin it from the dashboard list or the dashboard header, and everyone on the team sees the same Home tab, server-side and across devices.
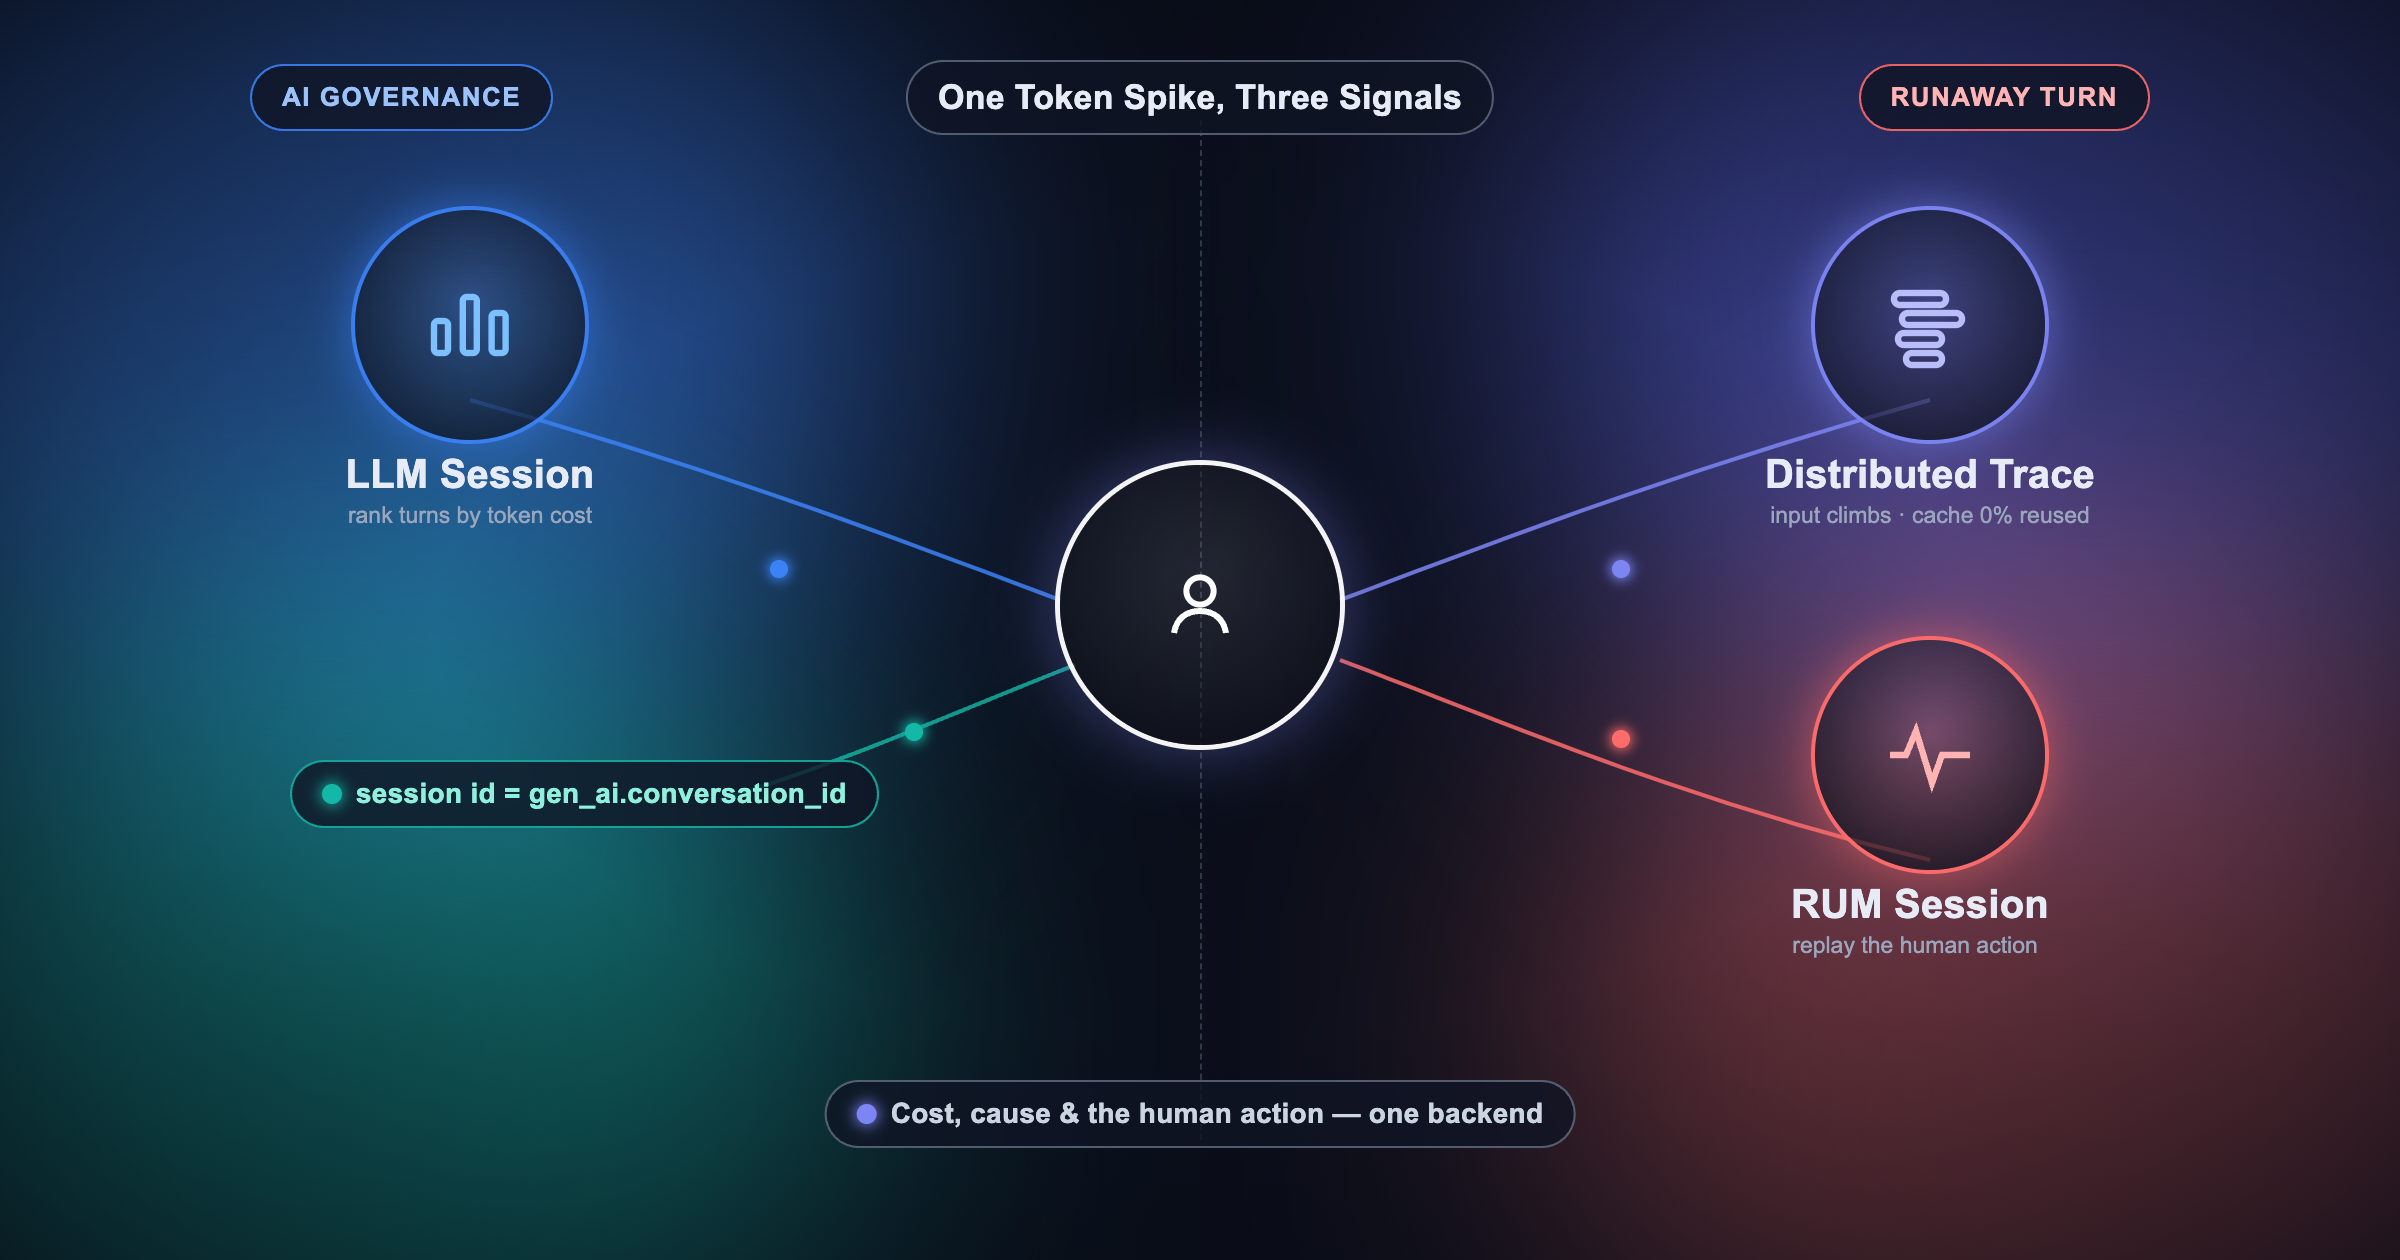
How an AI-governance engineer walks one anomalous LLM turn across three signals in OpenObserve — session, distributed trace, and RUM replay — to pin down cost, cause, and the human action behind a token spike.

We rewrote the XDrain log pattern extraction algorithm in Rust, achieving 40x performance improvements over Python. Learn how we used prefix trees, systematic sampling, and memory-bounded LRU caches to process 361,000 logs/sec in real-time.
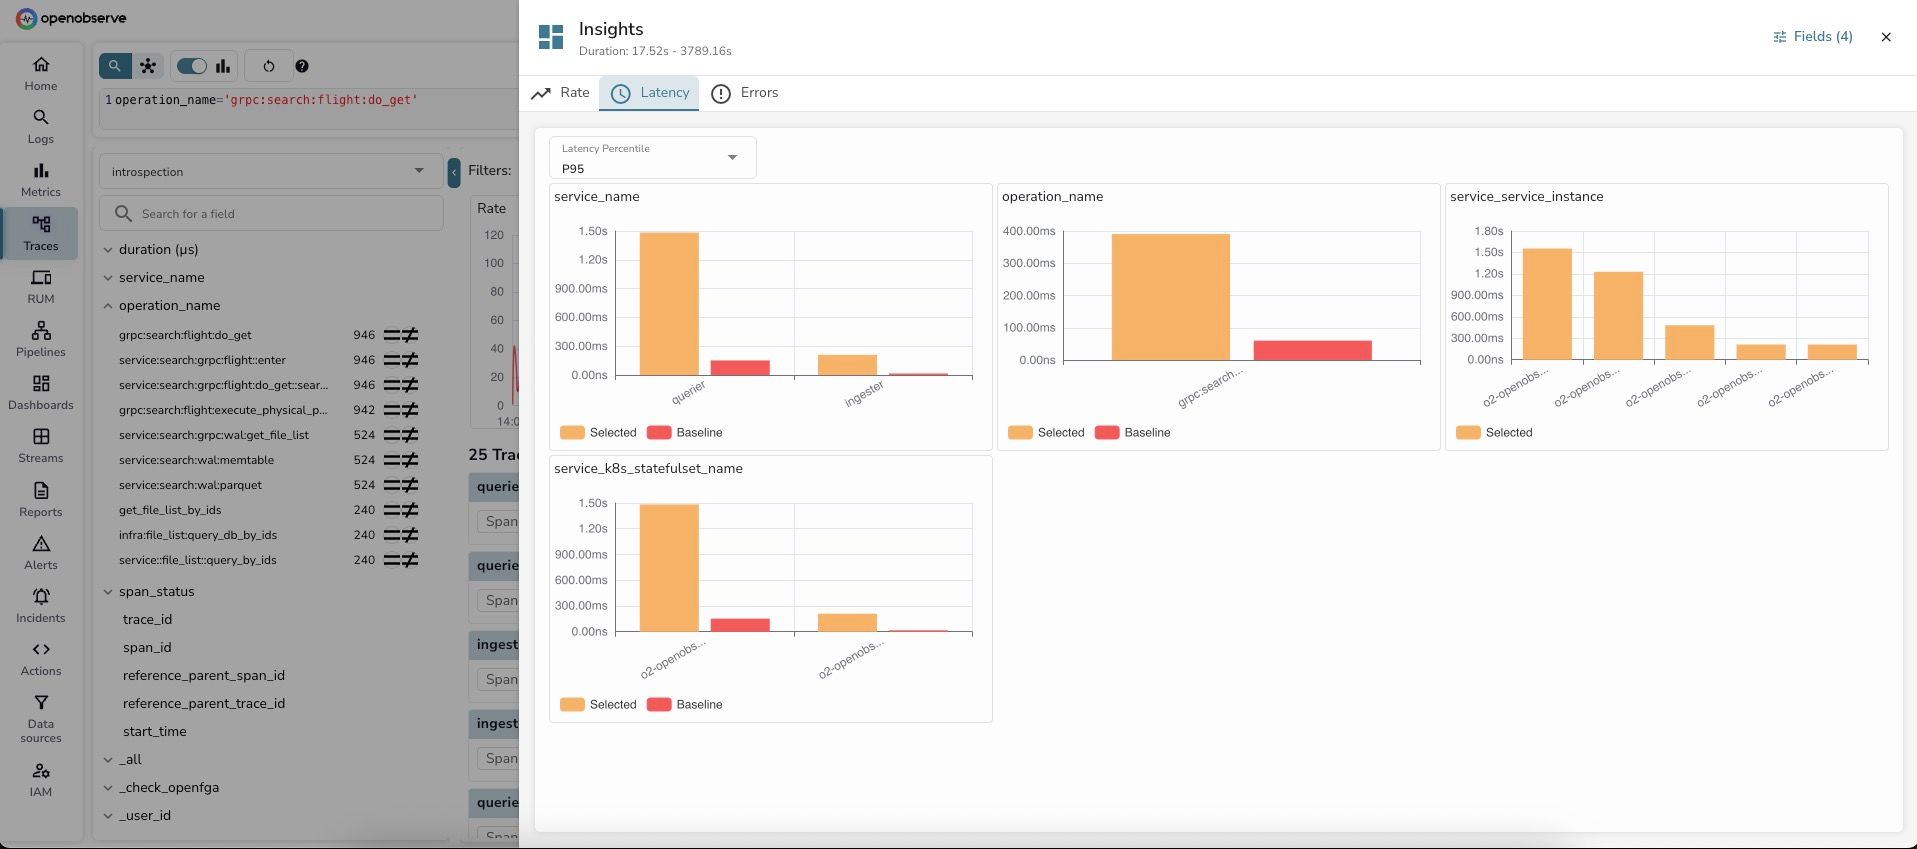
Learn how to use OpenObserve Insights for interactive log and trace analysis. Identify root causes in 60 seconds with dimension analysis. Real examples, step-by-step guides, and troubleshooting tips.
Automatically extract patterns from millions of logs in seconds. Learn how OpenObserve's log pattern analysis helps SREs reduce incident investigation time from 30 minutes to under 5 minutes.
Sending logs from NodeJS application to OpenObserve using Pino is easy. This blog is a step by step guide to do that.