Understanding OpenObserve Pipelines: Real-Time Processing, Routing, and Pre-Aggregation

Chaitanya Sistla
March 17, 2025
5 min read
Don’t forget to share!
Try OpenObserve Cloud today for more efficient and performant observability.
OpenObserve is an open-source, cloud-native observability platform designed for high-efficiency log management and monitoring. It utilizes the Parquet format for storage, ensuring optimized data compression and quick retrieval using a SQL-based query engine. Unlike traditional log management solutions that rely on costly mechanisms, OpenObserve provides a highly scalable alternative that can handle massive log volumes with minimal overhead.
Since version v0.14.0, OpenObserve introduced an optional inverted index for accelerating data queries. This enhancement allows users to retrieve logs faster without impacting the system’s efficiency.
This blog is based on the following OpenObserve version:
Version: v0.14.5-rc3
Commit Hash: ad7708002439241a04e00af182f0fd22e9a9954f
Build Date: 2025-03-15T06:12:31Z
Pipelines in OpenObserve were first introduced in version v0.14.0 and serve as a powerful mechanism for processing and transforming logs before they are stored. Pipelines offer three core functionalities:
These capabilities allow users to structure their logs effectively, minimize storage costs, and extract meaningful insights from raw data.
To demonstrate the power of OpenObserve Pipelines, let's take a sample raw log record before transformation:
{
  "timestamp": "01/Apr/2021:12:02:31 +0000",
  "message": "172.17.0.1 - alice [01/Apr/2021:12:02:31 +0000] \"POST /not-found HTTP/1.1\" 404 153 \"http://localhost/somewhere\" \"Mozilla/5.0 (Windows NT 6.1) AppleWebKit/537.36 (KHTML, like Gecko) Chrome/72.0.3626.119 Safari/537.36\" \"2.75\""
}
Raw logs like this are difficult to analyze efficiently. Using Vector Remap Language (VRL), we can parse the message field and extract structured fields.
{
  "client": "172.17.0.1",
  "user": "alice",
  "timestamp": "2021-04-01T12:02:31Z",
  "request": "POST /not-found HTTP/1.1",
  "status": 404,
  "size": 153,
  "referer": "http://localhost/somewhere",
  "agent": "Mozilla/5.0 (Windows NT 6.1) AppleWebKit/537.36 (KHTML, like Gecko) Chrome/72.0.3626.119 Safari/537.36",
  "compression": "2.75"
}
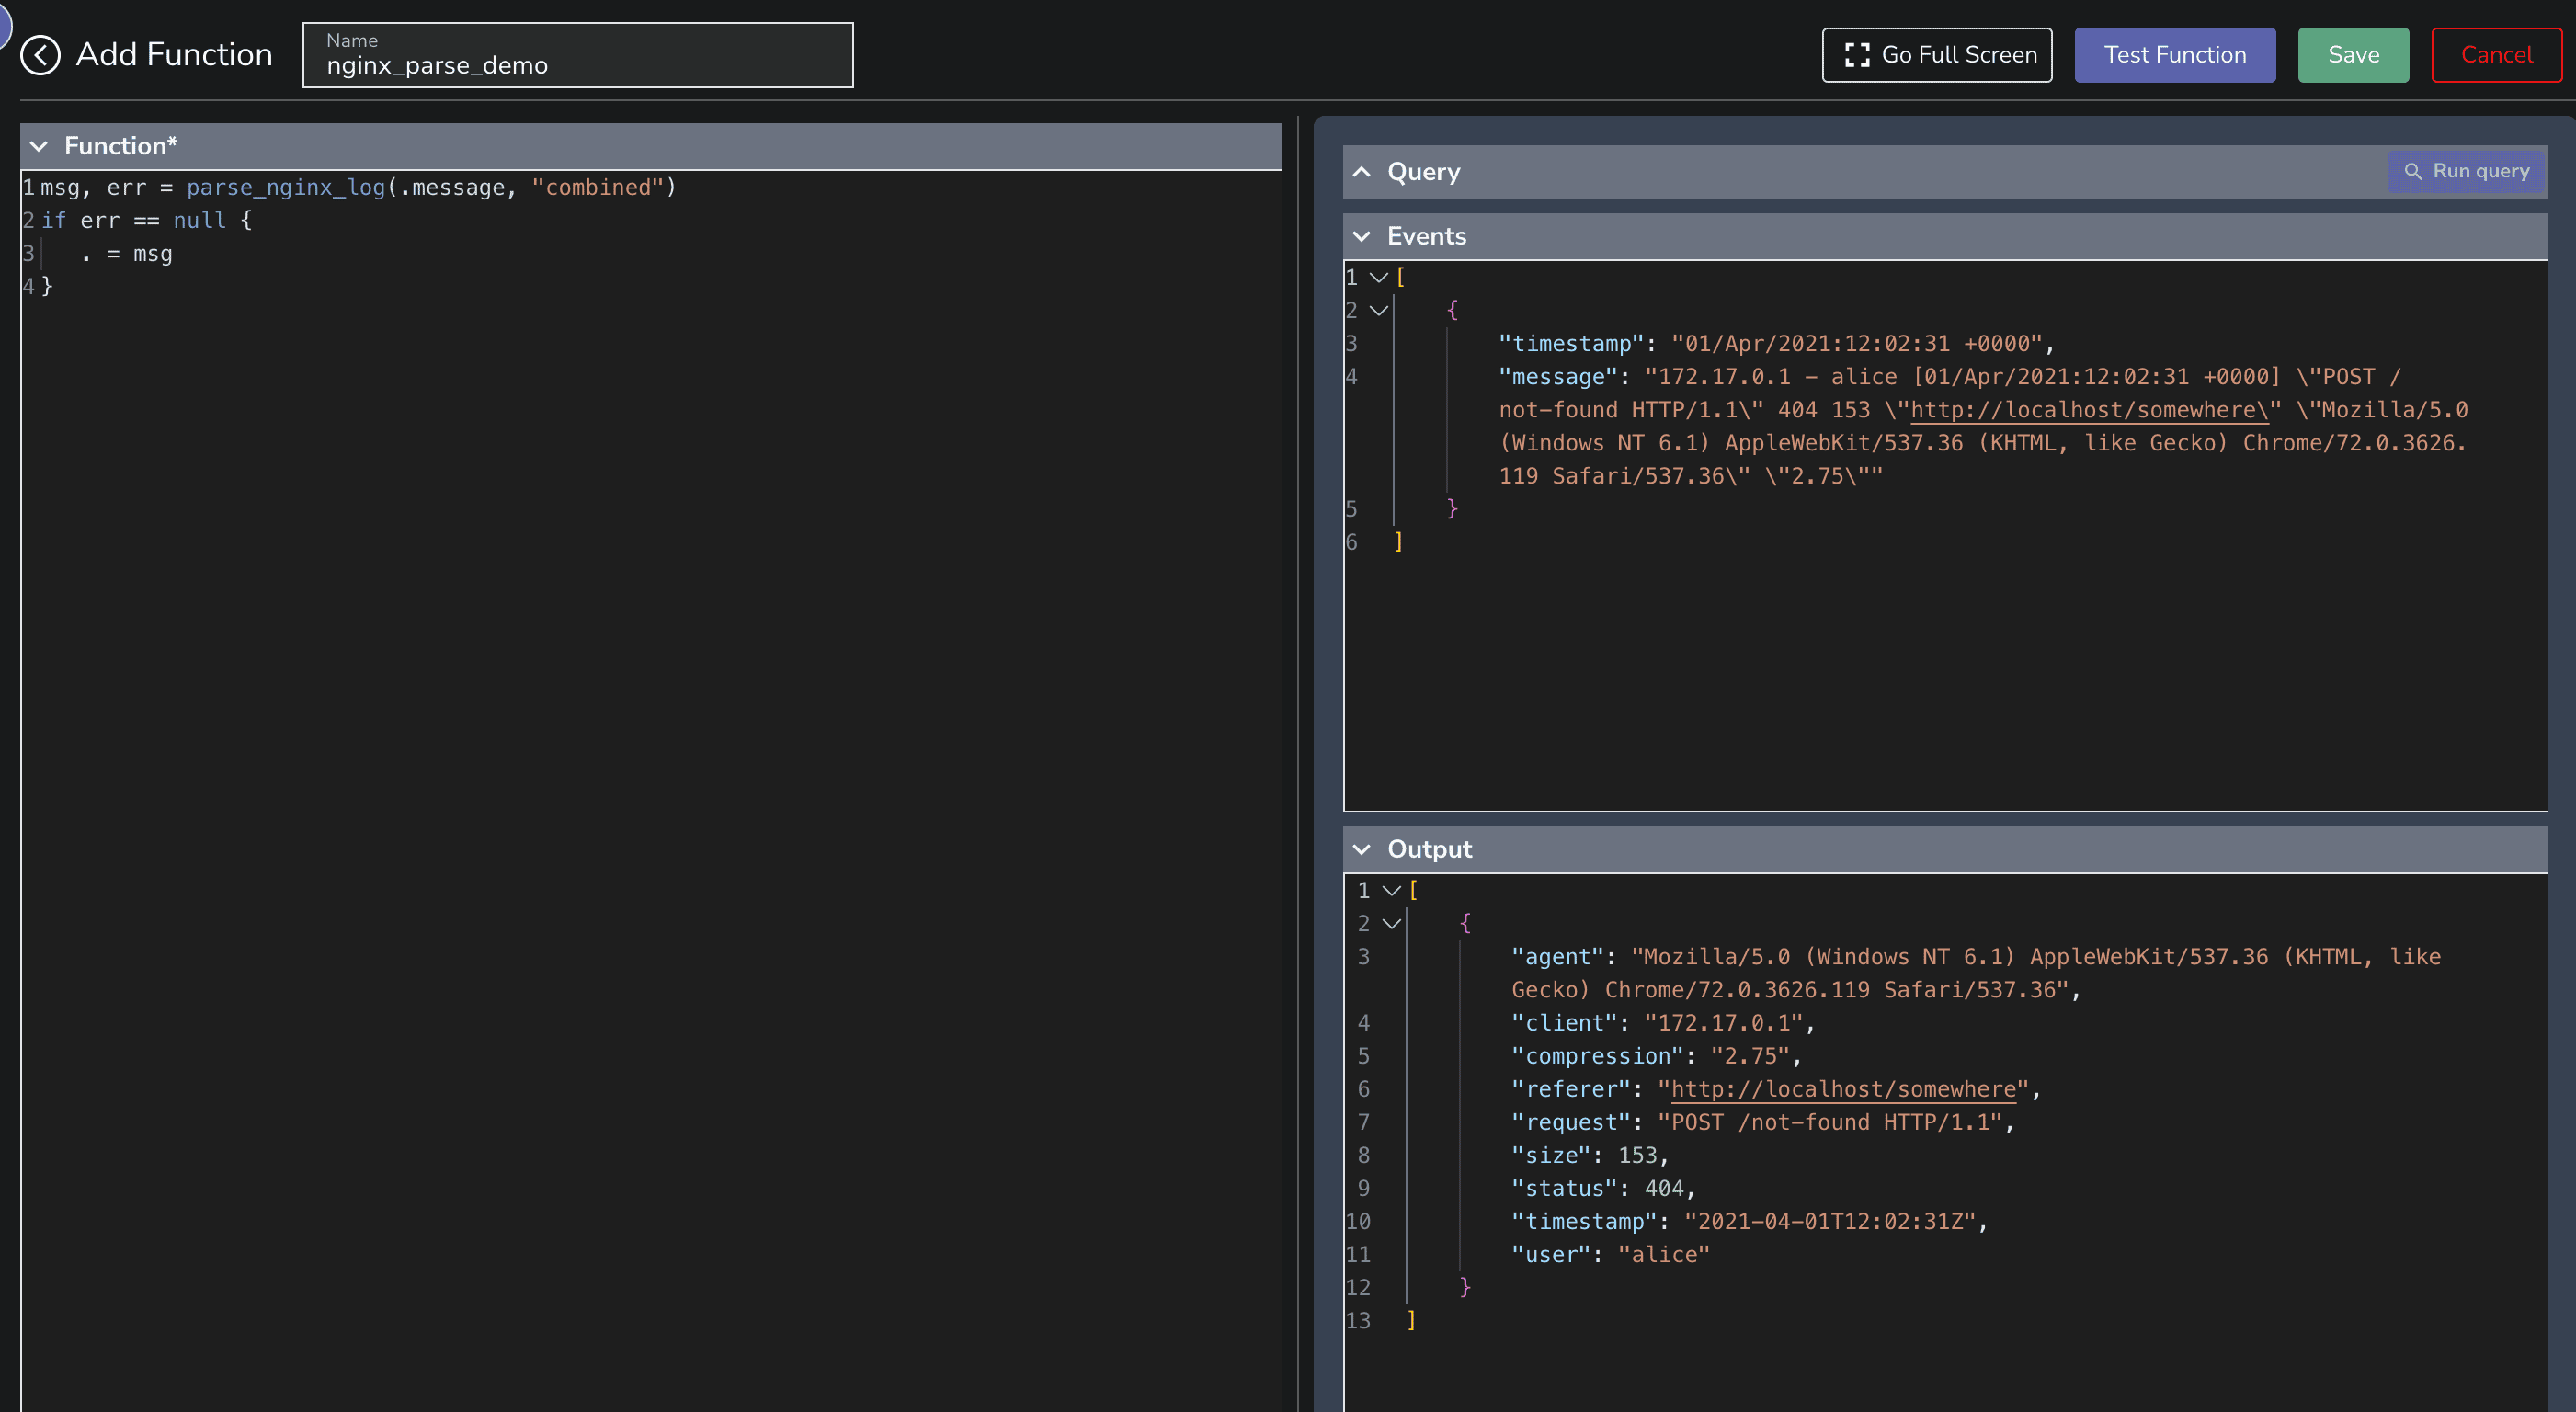
A quick test to transform this can be done via the VRL function editor as shown in the below image.
Pipelines > Functions > Create new function
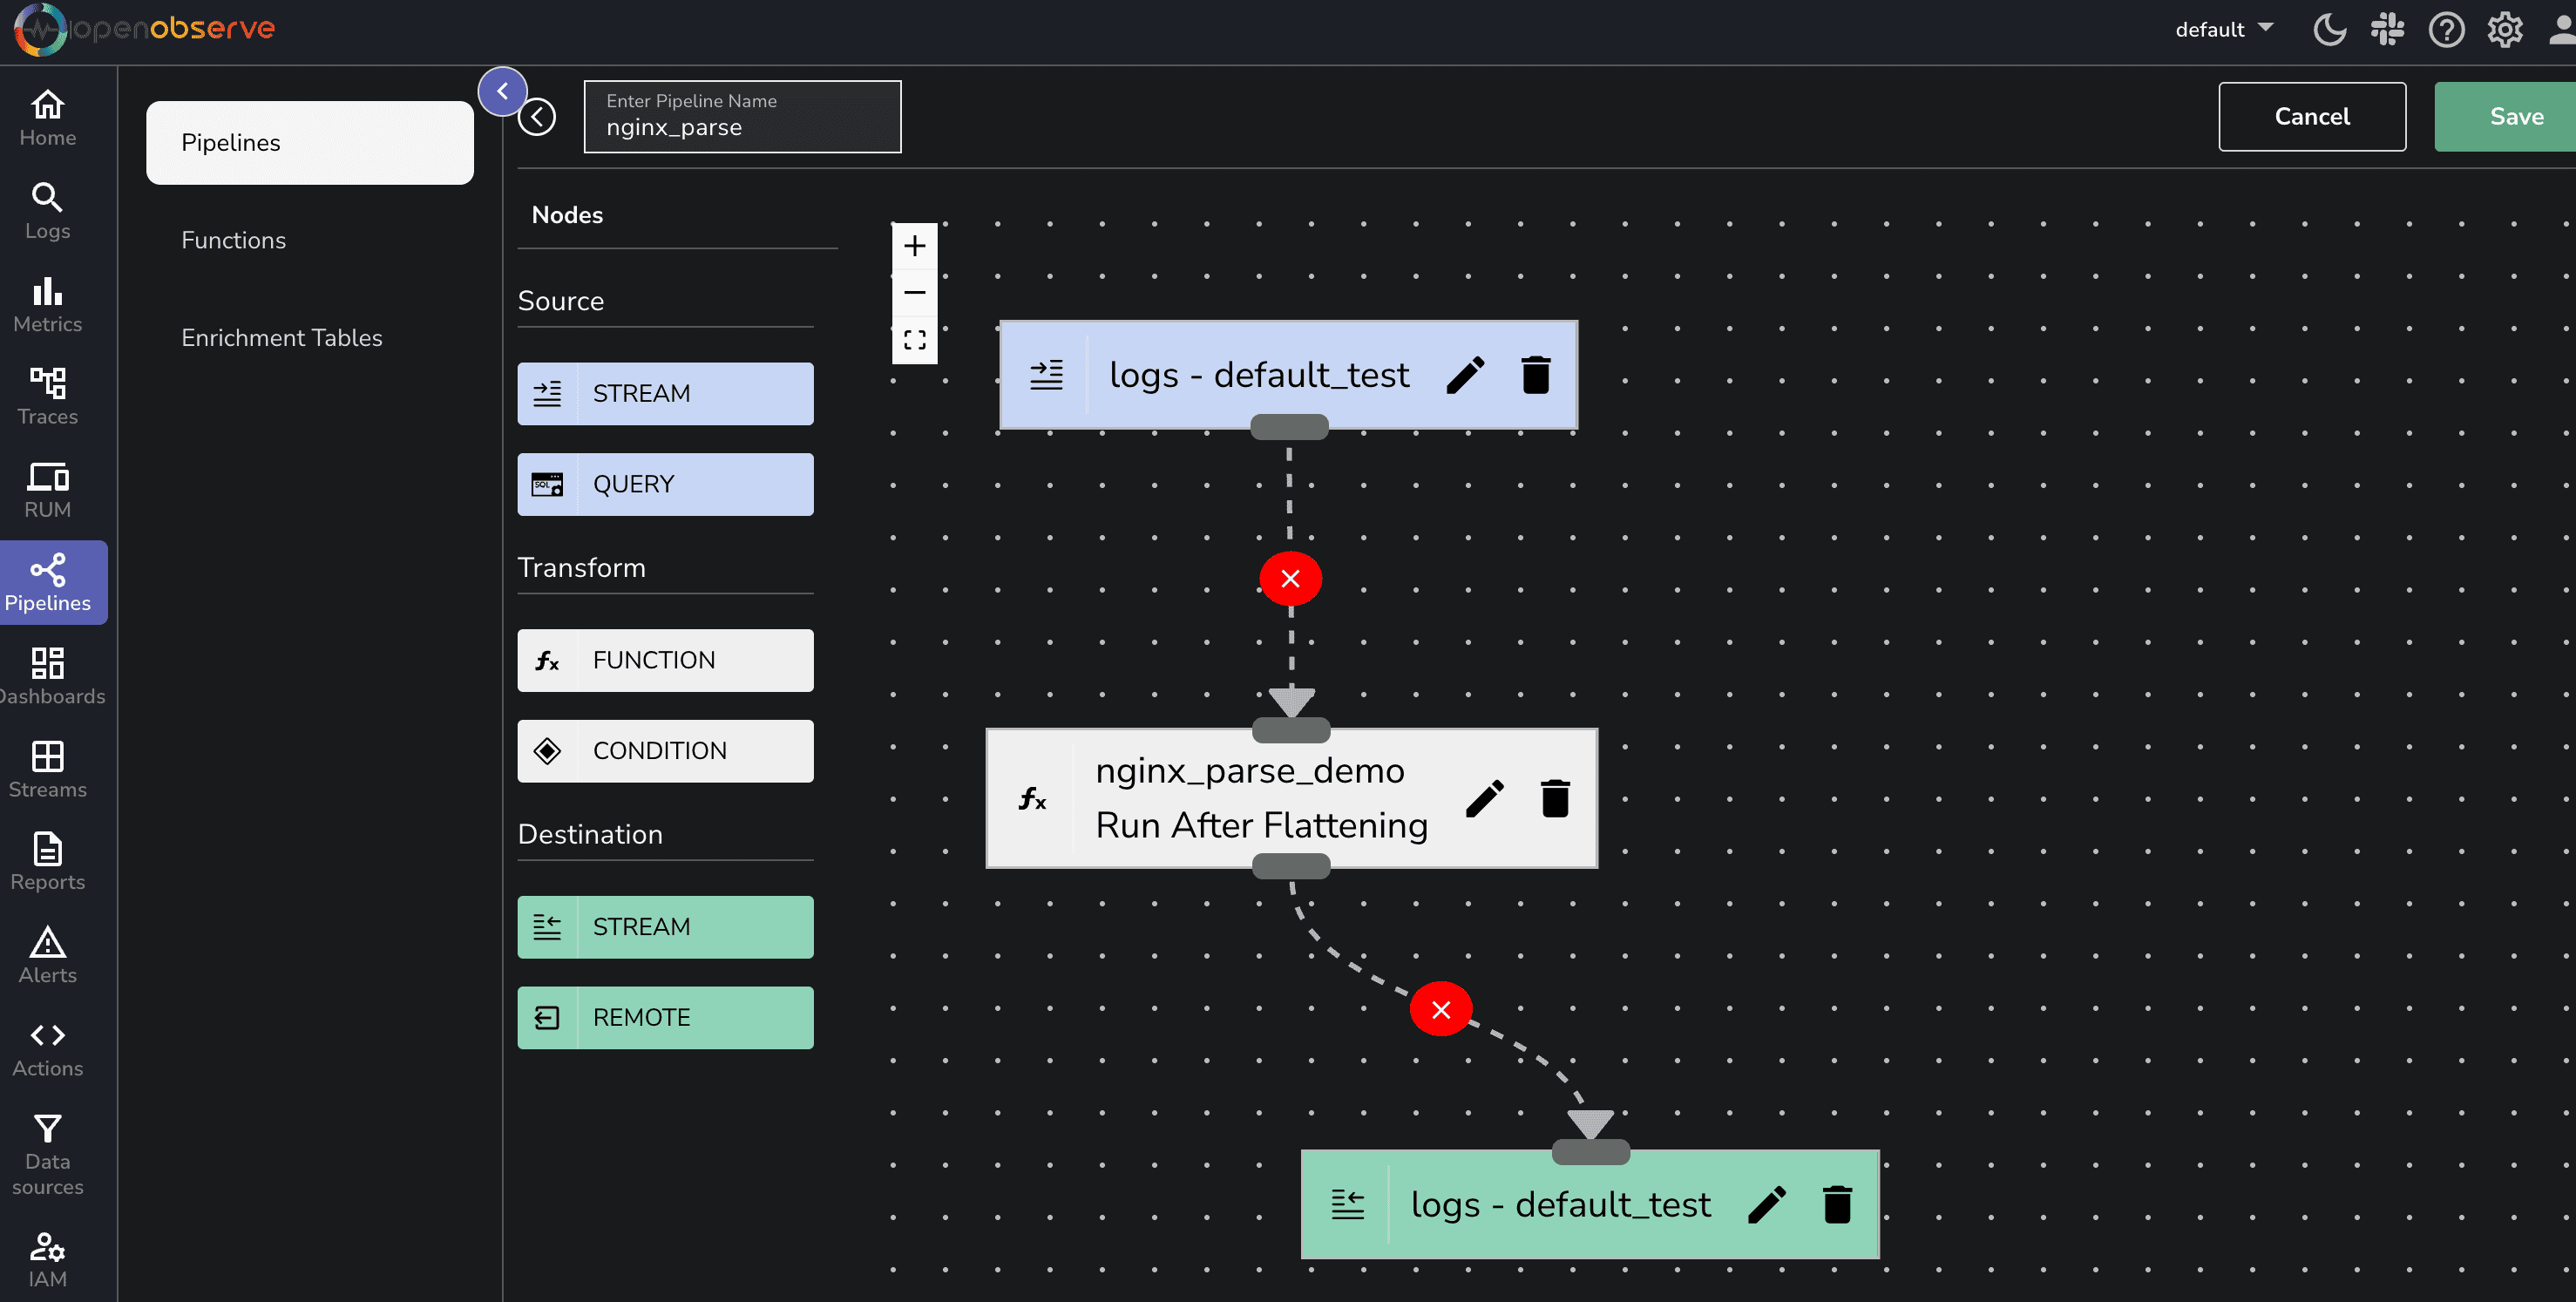
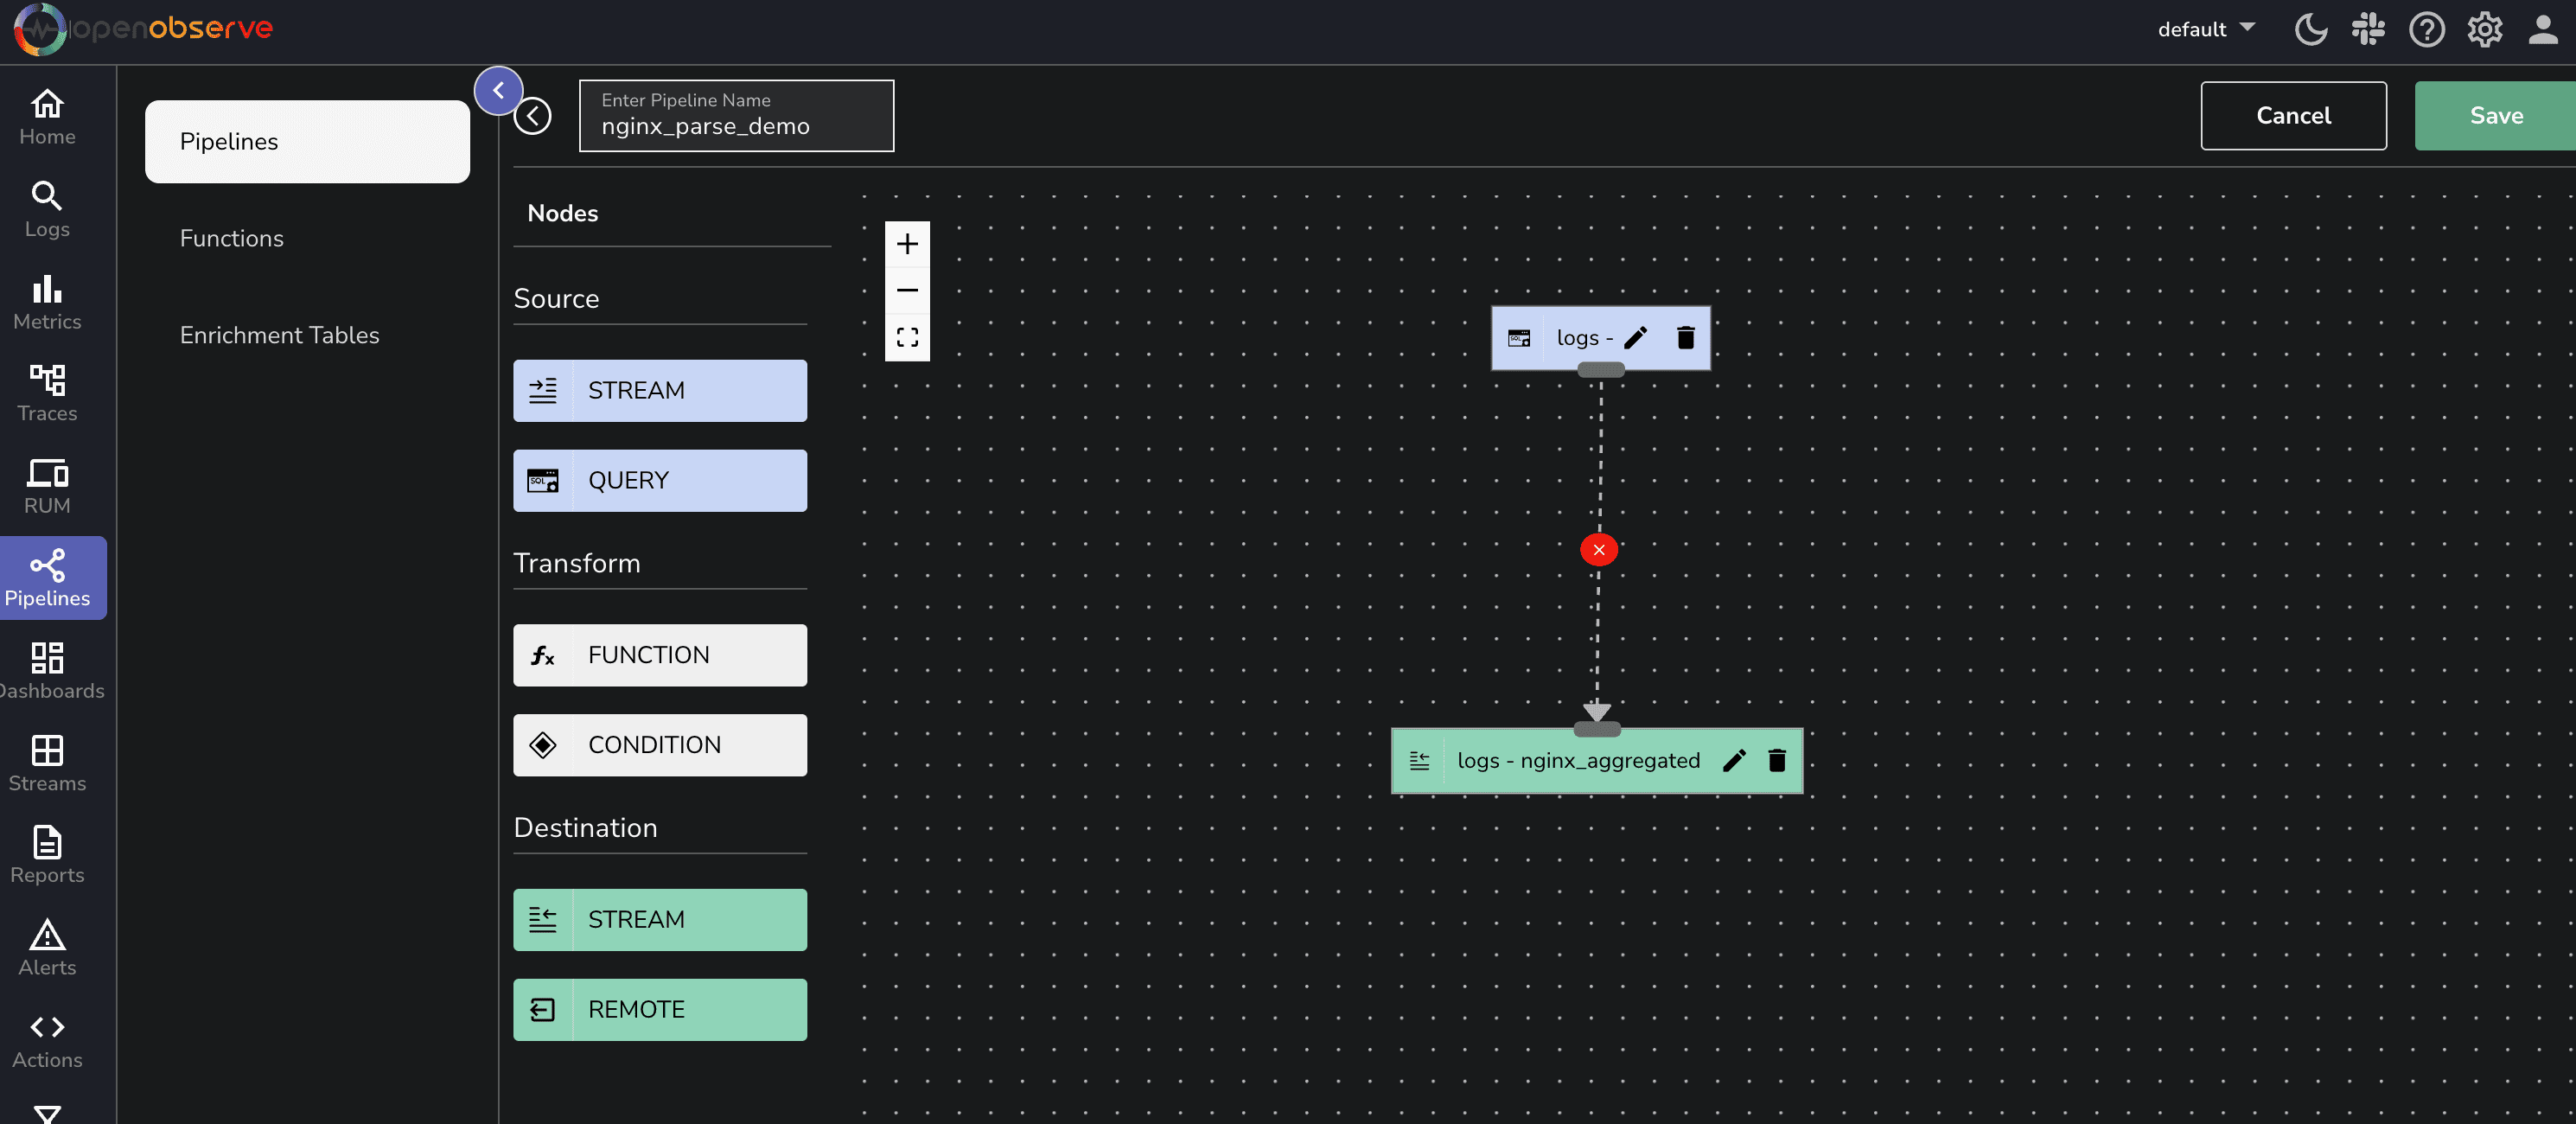
Now to make this flow as a pipeline, follow the below steps.
To process Nginx logs, start by creating a Pipeline in OpenObserve:
Now, let’s transform the unstructured log using VRL. Drag the Function icon and add the following VRL function by clicking on Create new function
msg, err = parse_nginx_log(.message, "combined")
if err == null {
   . = msg
}
This function:
Once the pipeline is active, ingest some new Nginx logs and verify the structured output in OpenObserve’s log interface.
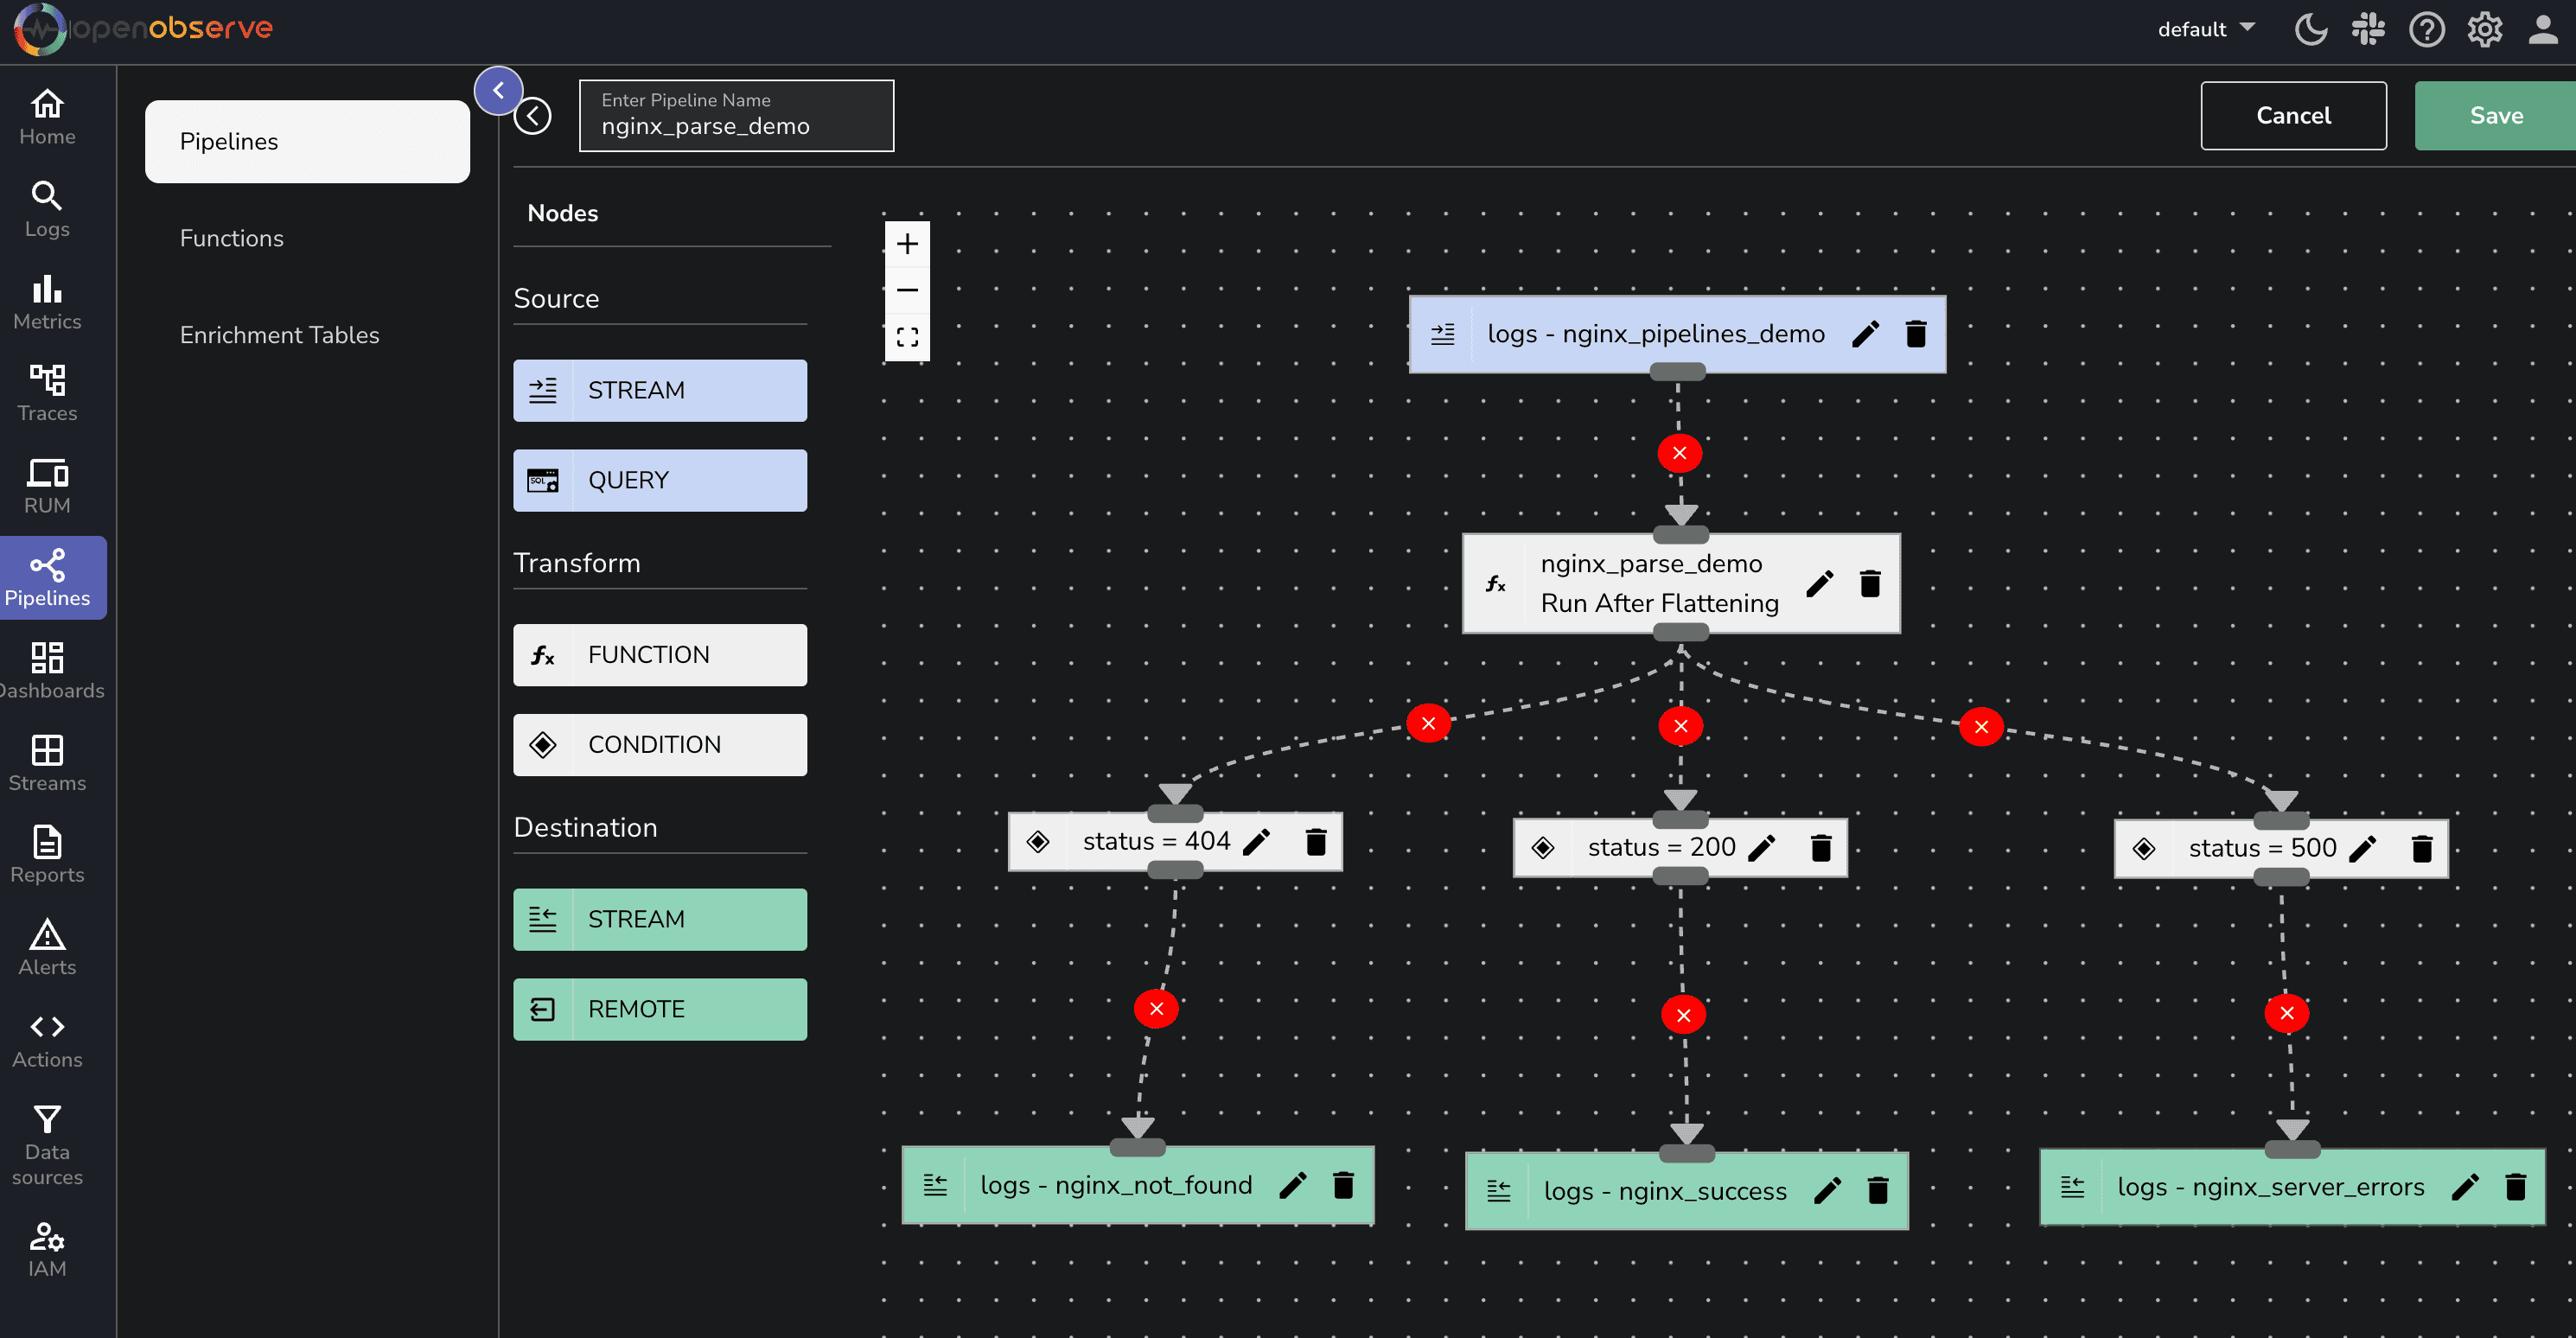
In some cases, you might want to store logs with different HTTP status codes into separate data streams. For example:
We can modify our Pipeline to achieve this dynamic routing:
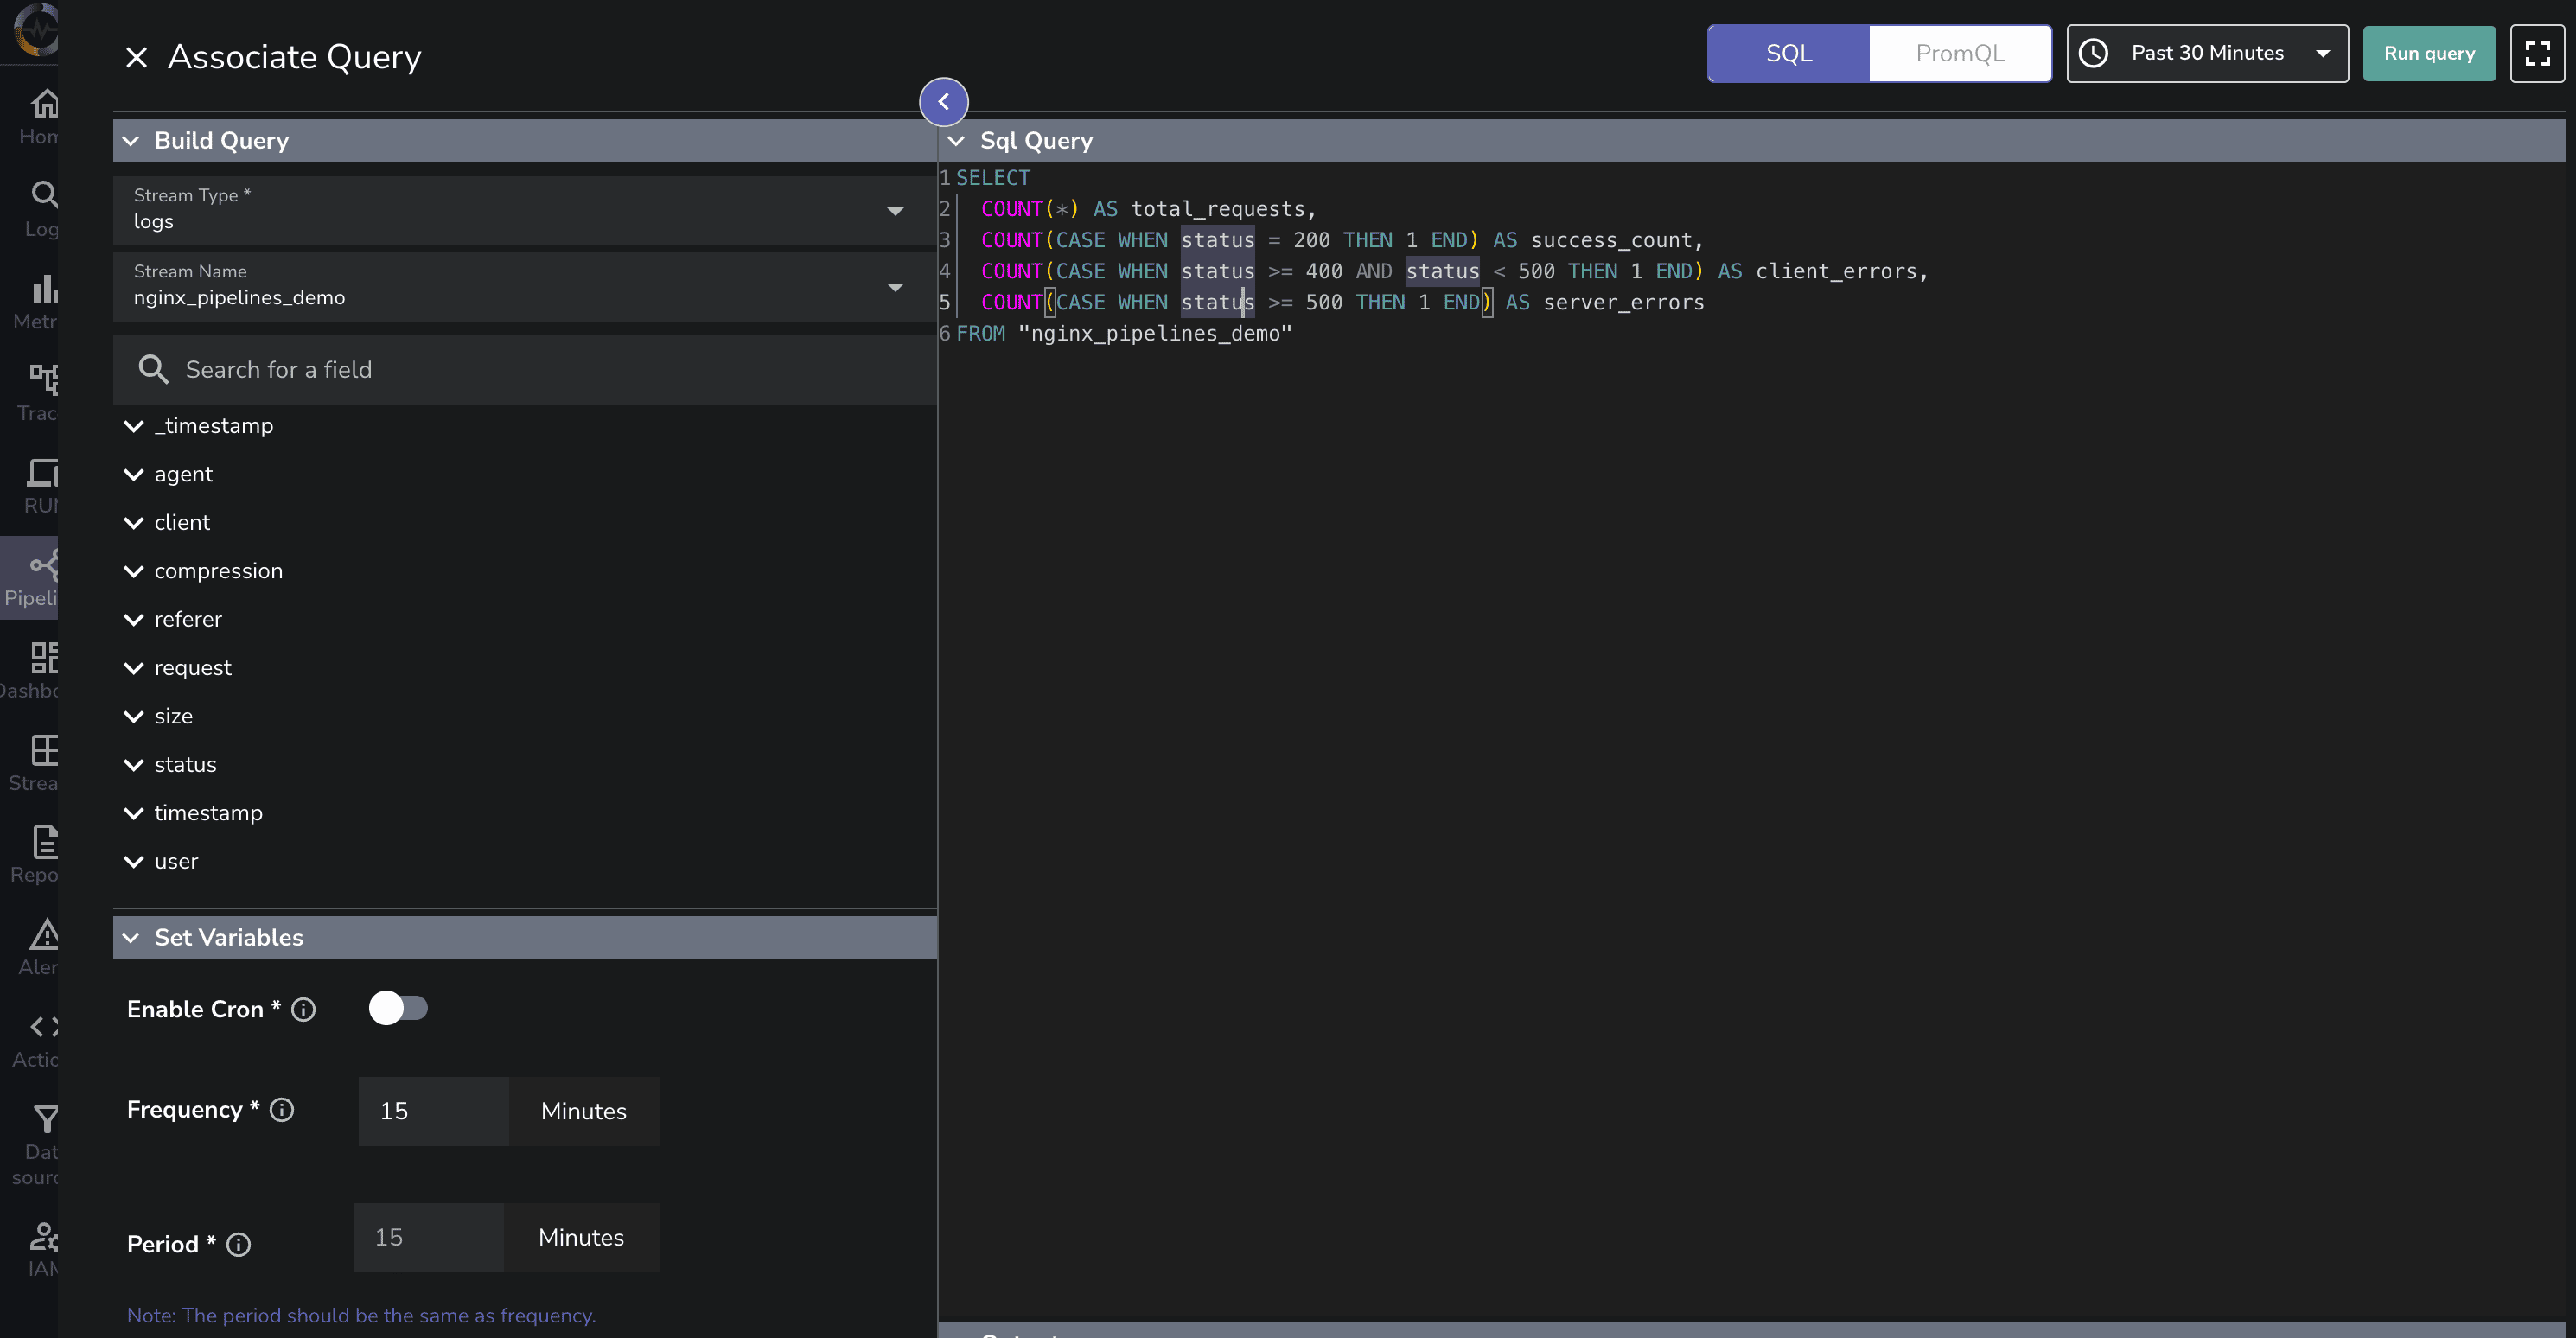
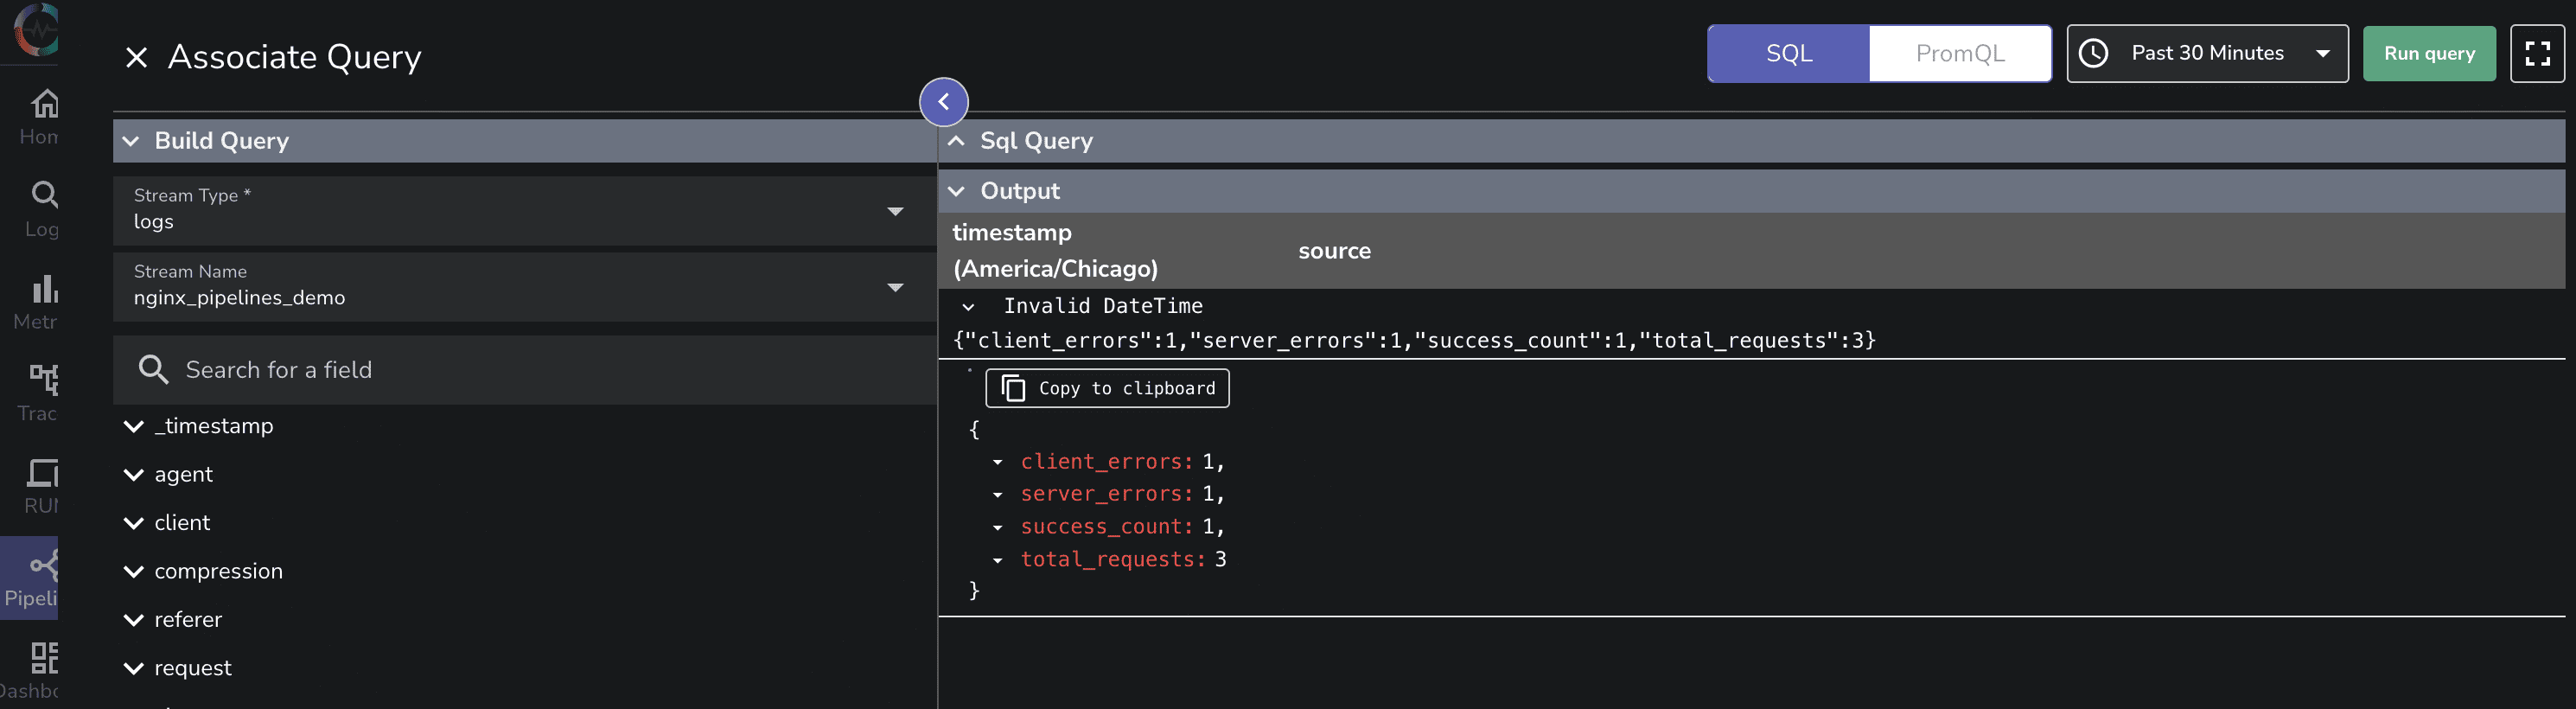
Rather than performing expensive queries on historical data, we can pre-aggregate statistics and store them in a separate data stream for faster retrieval.
SELECT
  COUNT(*) AS total_requests,
  COUNT(CASE WHEN status = 200 THEN 1 END) AS success_count,
  COUNT(CASE WHEN status >= 400 AND status < 500 THEN 1 END) AS client_errors,
  COUNT(CASE WHEN status >= 500 THEN 1 END) AS server_errors
FROM "nginx_pipelines_demo"
OpenObserve Pipelines offer a powerful, flexible, and efficient way to process logs. Whether you need real-time transformations, dynamic routing, or pre-aggregated insights, OpenObserve Pipelines enable you to handle log data at scale with minimal configuration.
If you haven’t explored Pipelines in OpenObserve yet, now is the perfect time to get started!
Get Started with OpenObserve Today!
Sign up for a free trial of OpenObserve on our website. Check out our GitHub repository for self-hosting and contribution opportunities.
Chaitanya Sistla is a Principal Solutions Architect with 17X certifications across Cloud, Data, DevOps, and Cybersecurity. Leveraging extensive startup experience and a focus on MLOps, Chaitanya excels at designing scalable, innovative solutions that drive operational excellence and business transformation.