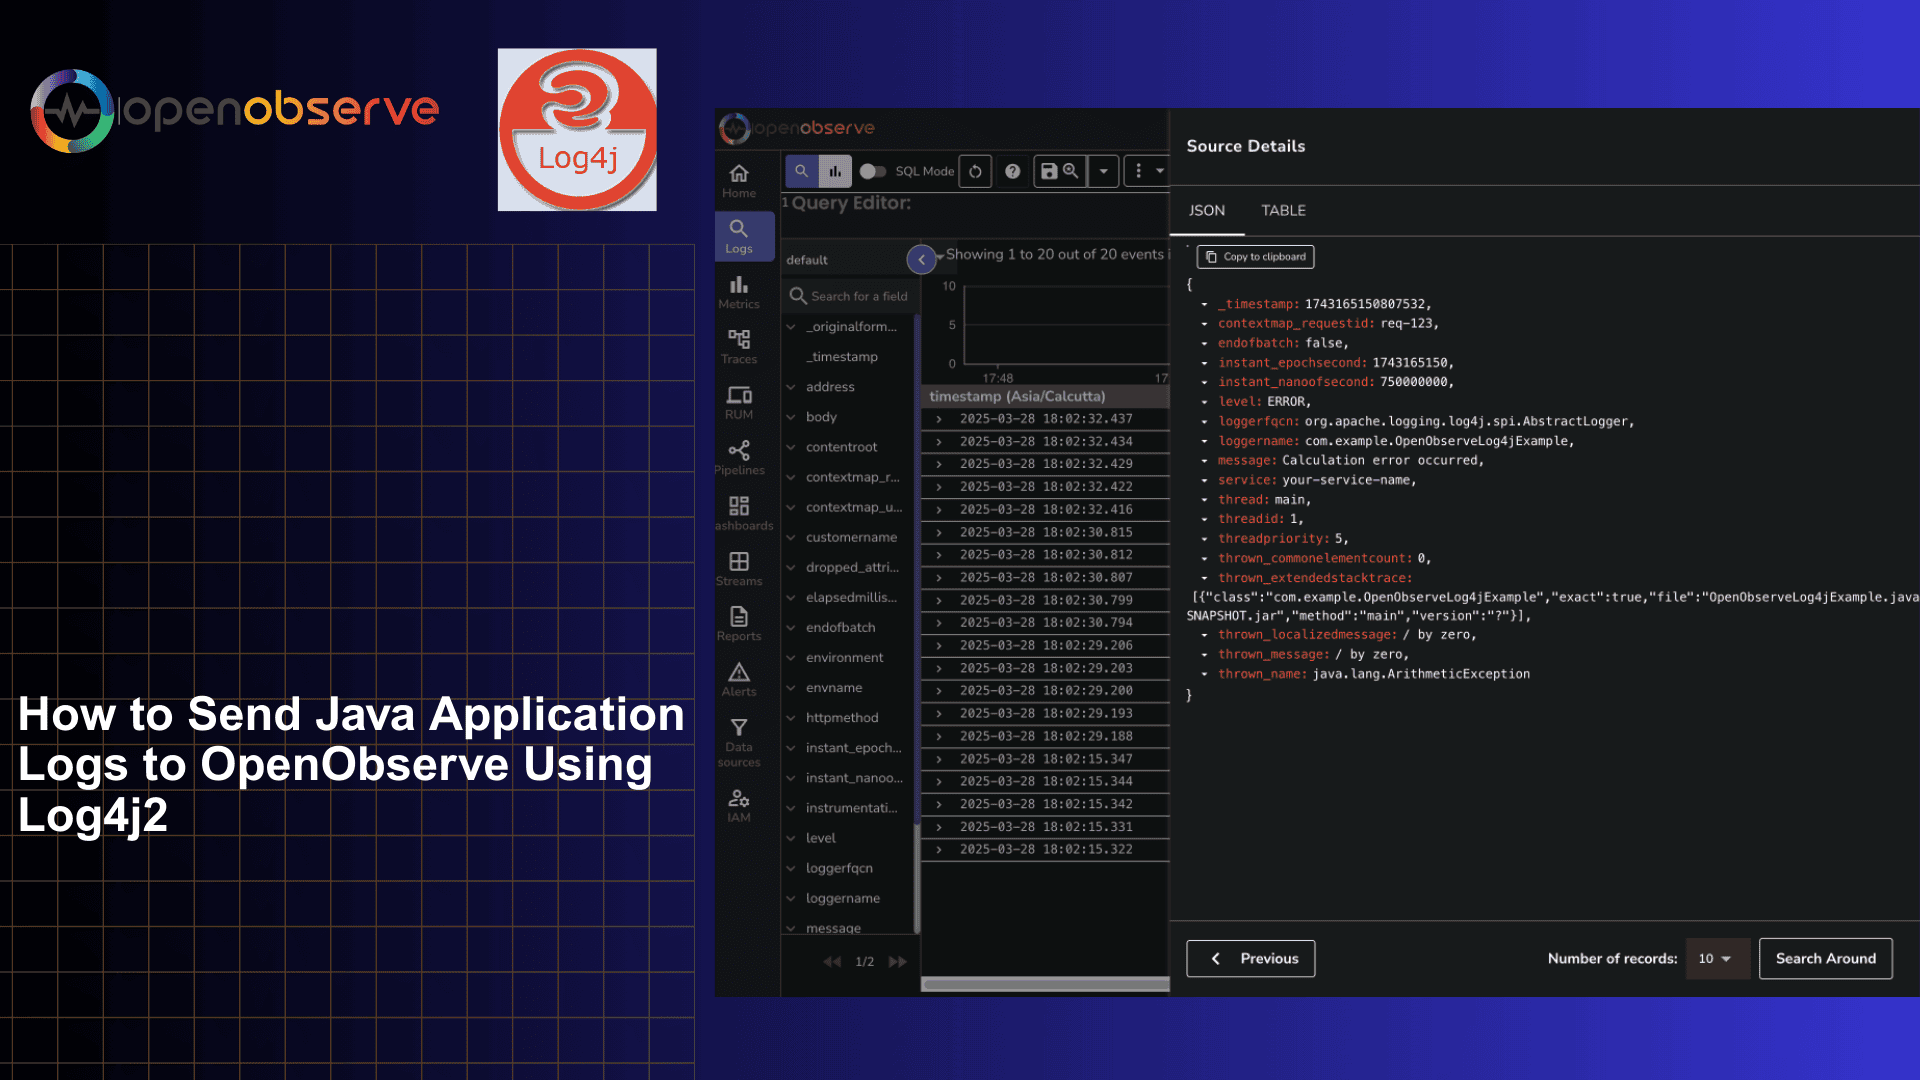
How to Send Java Application Logs to OpenObserve Using Log4j2

Manas Sharma
March 28, 2025
6 min read
Don’t forget to share!
Try OpenObserve Cloud today for more efficient and performant observability.
Effective logging is not just about recording events; it's about gaining actionable insights!
Java applications generate various types of logs - from application-specific messages to framework logs and JVM information. Managing these logs effectively becomes challenging as applications scale across multiple services and environments.
Log4j2 stands as the industry-standard logging framework for Java applications, offering significant advantages:
At its core, Log4j2 works through:
For our OpenObserve integration, we'll configure an HTTP appender with JSON layout to send structured logs directly to the OpenObserve API.
OpenObserve serves as the perfect observability backend for your Java applications:
By combining Log4j2 with OpenObserve, you gain centralized log management with powerful search capabilities, allowing you to correlate logs with metrics and traces for complete observability of your Java applications.
Before we begin, ensure you have:
Start by cloning our example repository:
git clone https://github.com/openobserve/openobserve-log4j.git
cd openobserve-log4j
This repository contains a complete example project with all the necessary configurations to integrate Log4j2 with OpenObserve.
Before running the example, you need to update the Log4j2 configuration to point to your OpenObserve instance:
src/main/resources/log4j2.xml<Http name="OpenObserve" url="https://your-openobserve-instance/api/organization_name/stream_name/_json">
<Property name="Content-Type" value="application/json"/>
<!-- Basic authentication -->
<Property name="Authorization" value="Basic ${base64:your_username:your_password}"/>
<!-- JSON Layout for structured logging -->
<JsonLayout compact="true" eventEol="true" properties="true">
<KeyValuePair key="service" value="your-service-name"/>
</JsonLayout>
</Http>
your-openobserve-instance with your OpenObserve domainorganization_name with your organization name in OpenObservestream_name with your desired log stream nameyour_username and your_password with your OpenObserve credentialsyour-service-name with your application's nameThe Log4j2 configuration includes several key components:
<!-- Console Appender for local debugging -->
<Console name="Console" target="SYSTEM_OUT">
    <PatternLayout pattern="%d{HH:mm:ss.SSS} [%t] %-5level %logger{36} - %msg%n"/>
</Console>

<!-- Async wrapper for better performance -->
<Async name="AsyncOpenObserve">
    <AppenderRef ref="OpenObserve"/>
</Async>

<Loggers>
    <Root level="info">
        <AppenderRef ref="Console"/>
        <AppenderRef ref="AsyncOpenObserve"/>
    </Root>
</Loggers>
The HTTP appender is configured to send logs directly to OpenObserve's API endpoint with basic authentication. The JSON layout ensures that logs are properly structured for efficient querying in OpenObserve.
The repository includes a sample application that demonstrates various logging scenarios:
import org.apache.logging.log4j.LogManager;
import org.apache.logging.log4j.Logger;
import org.apache.logging.log4j.ThreadContext;

public class OpenObserveLog4jExample {
    private static final Logger logger = LogManager.getLogger(OpenObserveLog4jExample.class);

    public static void main(String[] args) {
        // Add context data (MDC)
        ThreadContext.put("user_id", "12345");
        ThreadContext.put("session_id", "abcdef");

        // Log messages at different levels
        logger.debug("This is a debug message");
        logger.info("This is an info message");
        logger.warn("This is a warning message");

        try {
            // Simulate an exception
            int result = 10 / 0;
        } catch (Exception e) {
            logger.error("An error occurred", e);
        }

        // Clean up context data
        ThreadContext.clearAll();

        logger.info("Application shutting down");
    }
}
This example demonstrates:
Once you've updated the configuration, build and run the example:
mvn clean package
java -jar target/openobserve-log4j-1.0-SNAPSHOT.jar
The example application will generate logs and send them to your OpenObserve instance.
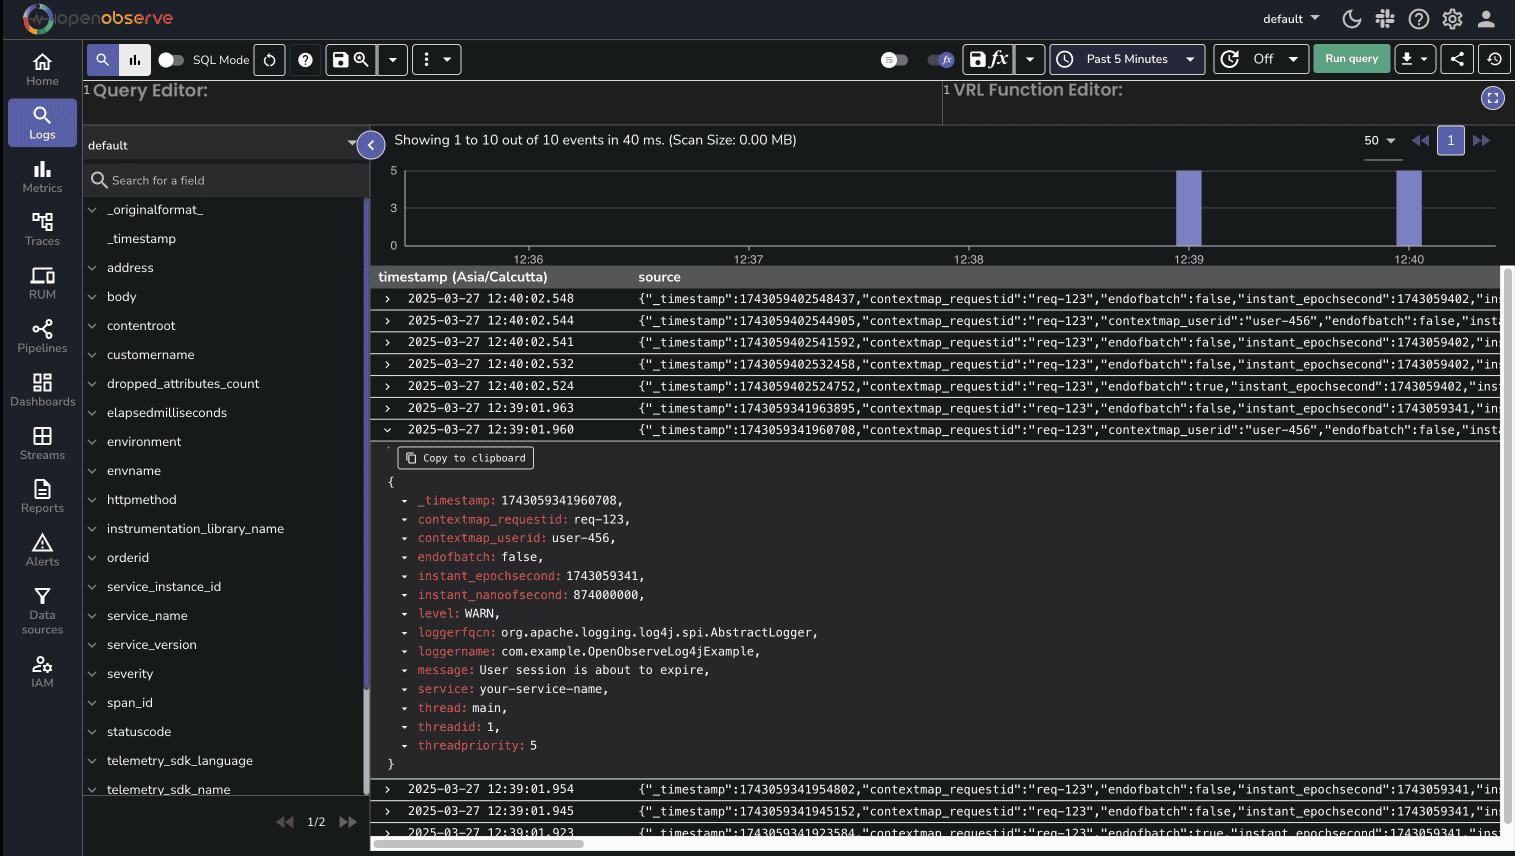
After running the example, you can view your logs in OpenObserve:
You should see structured logs from your application, complete with timestamps, log levels, and any custom fields you added.
You can enrich your logs with custom fields by adding KeyValuePair elements to the JsonLayout:
<JsonLayout compact="true" eventEol="true" properties="true">
    <KeyValuePair key="service" value="your-service-name"/>
    <KeyValuePair key="environment" value="production"/>
    <KeyValuePair key="version" value="1.0.0"/>
</JsonLayout>
Thread Context (also known as MDC - Mapped Diagnostic Context) allows you to add contextual information to your logs:
ThreadContext.put("user_id", "12345");
ThreadContext.put("session_id", "abcdef");
logger.info("User action performed");
These context values will be included in the JSON sent to OpenObserve, making it easy to filter logs by user, session, or other contexts.
Connection Refused
Ensure your OpenObserve URL is correct and accessible from your application.
Authentication Failed
Verify your username and password are correctly encoded in the configuration.
No Logs Appearing
Check that your log level is set appropriately in the Root logger configuration.
To troubleshoot Log4j2 itself, enable debug mode in your configuration:
<Configuration status="DEBUG">
This will output detailed information about Log4j2's initialization and operation.
Now that you've successfully integrated Log4j2 with OpenObserve, you have a powerful foundation for centralized logging of your Java applications. Here are some quick tips to take your implementation to the next level:
<Http name="OpenObserve" url="..." ignoreExceptions="true">The combination of Log4j2's flexible logging framework and OpenObserve's powerful analysis capabilities gives you complete visibility into your Java applications, helping you identify and resolve issues faster while keeping storage costs low.
Manas is a passionate Dev and Cloud Advocate with a strong focus on cloud-native technologies, including observability, cloud, kubernetes, and opensource. building bridges between tech and community.