Convert Raw Logs into Metrics with OpenObserve Pipelines

Simran Kumari
December 16, 2025
11 min read
Don’t forget to share!
Try OpenObserve Cloud today for more efficient and performant observability.
Most teams begin their observability journey with logs. They’re easy to add, they tell you exactly what happened, and when something breaks, logs are usually the first place you look.
Logs capture individual events, but those events often include metric data points: timestamps, status codes, error flags, and latency values. Each log entry represents a single point in time, and together, they form a time series.
As systems scale, teams want dashboards that show trends: error rates over time, request volume per minute, latency percentiles. While this data exists inside logs, building dashboards directly on raw event streams means aggregating high-volume data repeatedly, which quickly becomes slow and inefficient.
The interesting part is that the problem usually isn’t a lack of data. It’s that teams are asking metric questions while still relying entirely on logs. The better approach is to extract metrics from event logs and store them as first-class time-series data.
In this article, we will cover how to convert logs into metrics using a scheduled pipeline in OpenObserve, step by step.
Logs and metrics are often talked about together, but they exist for very different reasons.
| Aspect | Logs | Metrics |
|---|---|---|
| What they represent | Individual events | Aggregated summaries |
| Level of detail | Very detailed (per event / per request) | High-level trends and counts |
| Cardinality | High | Low |
| Typical questions answered | What exactly happened? | How often did it happen? How bad is it? |
| Best used for | Debugging, root cause analysis | Monitoring, alerting, dashboards |
| Query cost | Expensive at scale | Cheap and fast |
When you try to use logs as a substitute for metrics, you end up paying the cost of high cardinality for questions that don’t need that level of detail. The solution isn’t to get rid of logs. It’s to derive the right metrics from them. This is where pipelines come into the picture.
A pipeline in OpenObserve is a configurable data processing workflow that determines how incoming data is handled after ingestion. In OpenObserve, pipelines broadly fall into two categories, based on when that logic is applied.
For a logs-to-metrics use case, that logic is usually straightforward. You read log events, filter out what matters, aggregate them over time, and write the result as a metric.
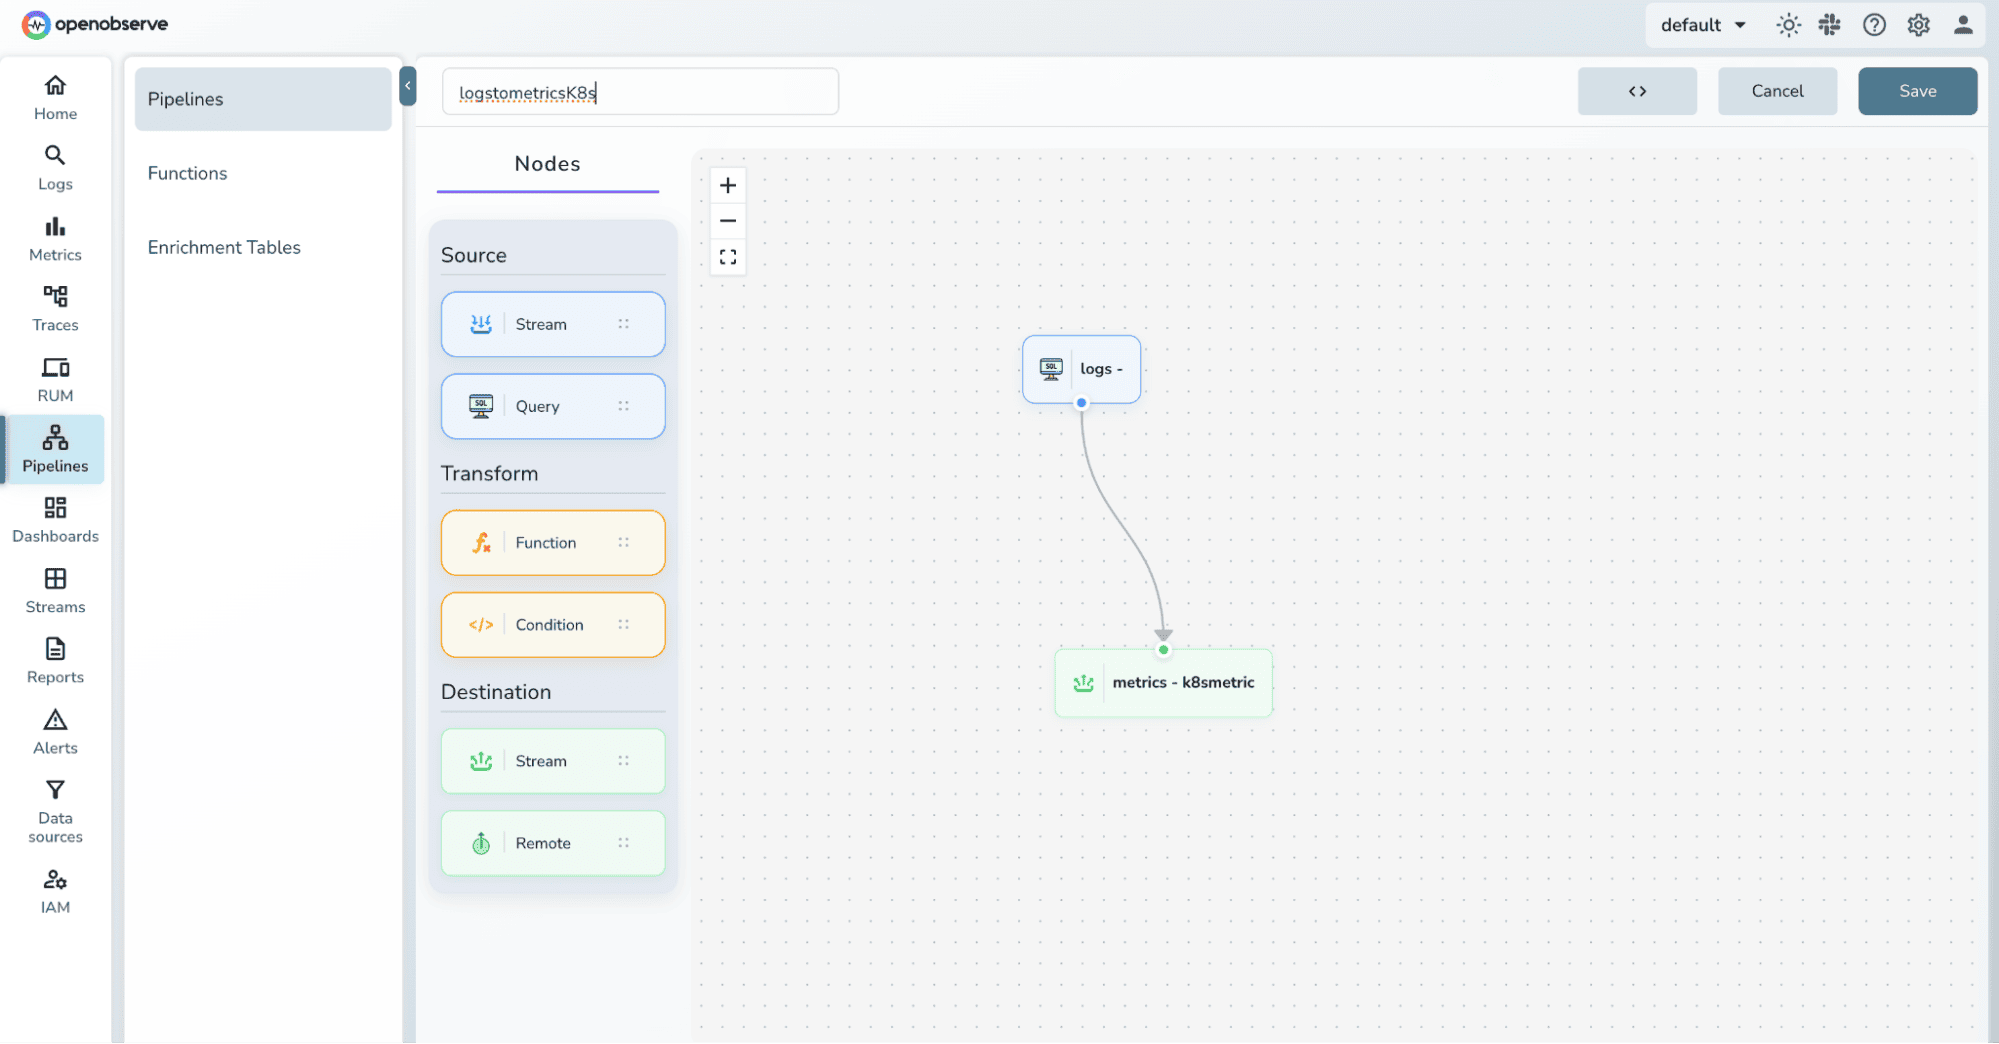
In practice, the flow looks like this. Your application emits logs, which are ingested and stored in a log stream. A scheduled pipeline runs every minute or every few minutes and reads logs from the previous window. It filters and aggregates those logs and writes the result into a metric stream.
Once that metric stream exists, dashboards and alerts read from it directly. Logs are still there when you need to debug, but they’re no longer powering every operational query.
A scheduled pipeline is simple but explicit. It consists of:
The aggregation window is defined by the pipeline schedule itself. Each execution processes logs from the previous window and produces one or more metric datapoints.
Let’s walk through how this actually works in practice, using a scheduled pipeline to convert Kubernetes logs into a metric stream.
Prerequisites:
Your application and infrastructure emit logs, which are ingested into OpenObserve and stored in a log stream.
For this demo we will be making use of sample Kubernetes logs:
# Download and extract sample Kubernetes logs
curl -L https://zinc-public-data.s3.us-west-2.amazonaws.com/zinc-enl/sample-k8s-logs/k8slog_json.json.zip -o k8slog_json.json.zip
unzip k8slog_json.json.zip
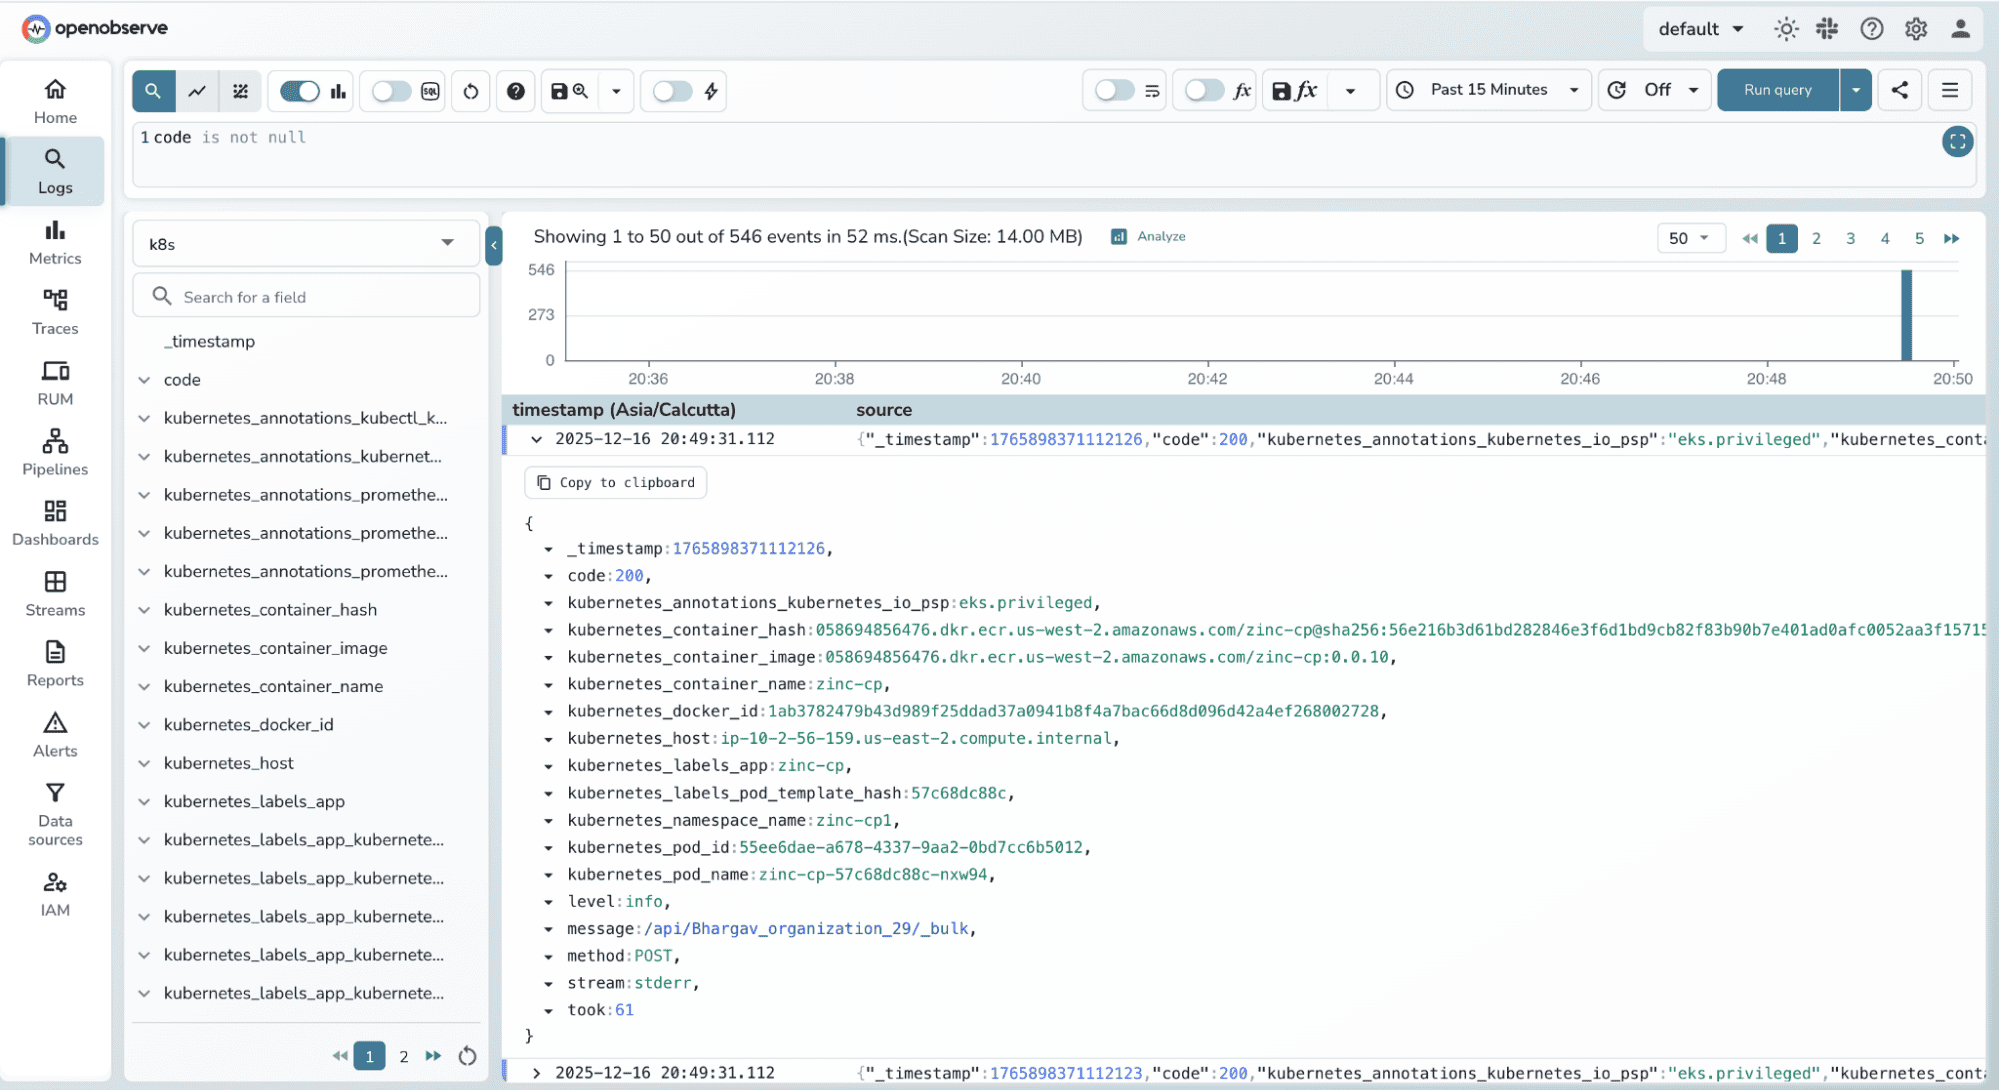
In a Kubernetes setup, these logs typically contain fields like:
_timestampcode (HTTP status code)kubernetes_container_namekubernetes_labels_appkubernetes_hostAt this stage, the data is raw and event-oriented. Each log line represents a single occurrence.
Before writing any pipeline, it’s important to be clear about the metric you want.
For example:
This decision determines: which logs you filter, how you aggregate them and which fields become metric labels
Example metrics:
k8s_http_requests_total : total requests per app per minutek8s_http_errors_total : total 5xx responses per app per minuteCreate a scheduled pipeline that runs at a fixed interval: for example, every 1 minute. At each run, the pipeline will:
For example: HTTP request count per app
SELECT
  'k8s_http_requests_total' AS "__name__",
  'counter' AS "__type__",
  COUNT(*) AS "value",
  kubernetes_labels_app AS app,
  kubernetes_namespace_name AS namespace,
  MAX(_timestamp) AS _timestamp
FROM kubernetes_logs
GROUP BY
  kubernetes_labels_app,
  kubernetes_namespace_name
Explanation:
__name__ → metric name__type__ → metric type (counter)value → number of requests in this windowapp & namespace → metric labelsExample: HTTP 5xx error count per app
SELECT
  'k8s_http_errors_total' AS __name__,
  'counter' AS __type__,
  COUNT(*) AS value,
  kubernetes_labels_app AS app,
  kubernetes_namespace_name AS namespace,
  MAX(_timestamp) AS _timestamp
FROM kubernetes_logs
WHERE code >= 500
GROUP BY
  kubernetes_labels_app,
  kubernetes_namespace_name
To filter logs for code >= 500 to only count server errors.
2. Before saving, run the SQL query once to validate the output. You should see rows that include __name__, __type__, and value, along with the expected label fields.
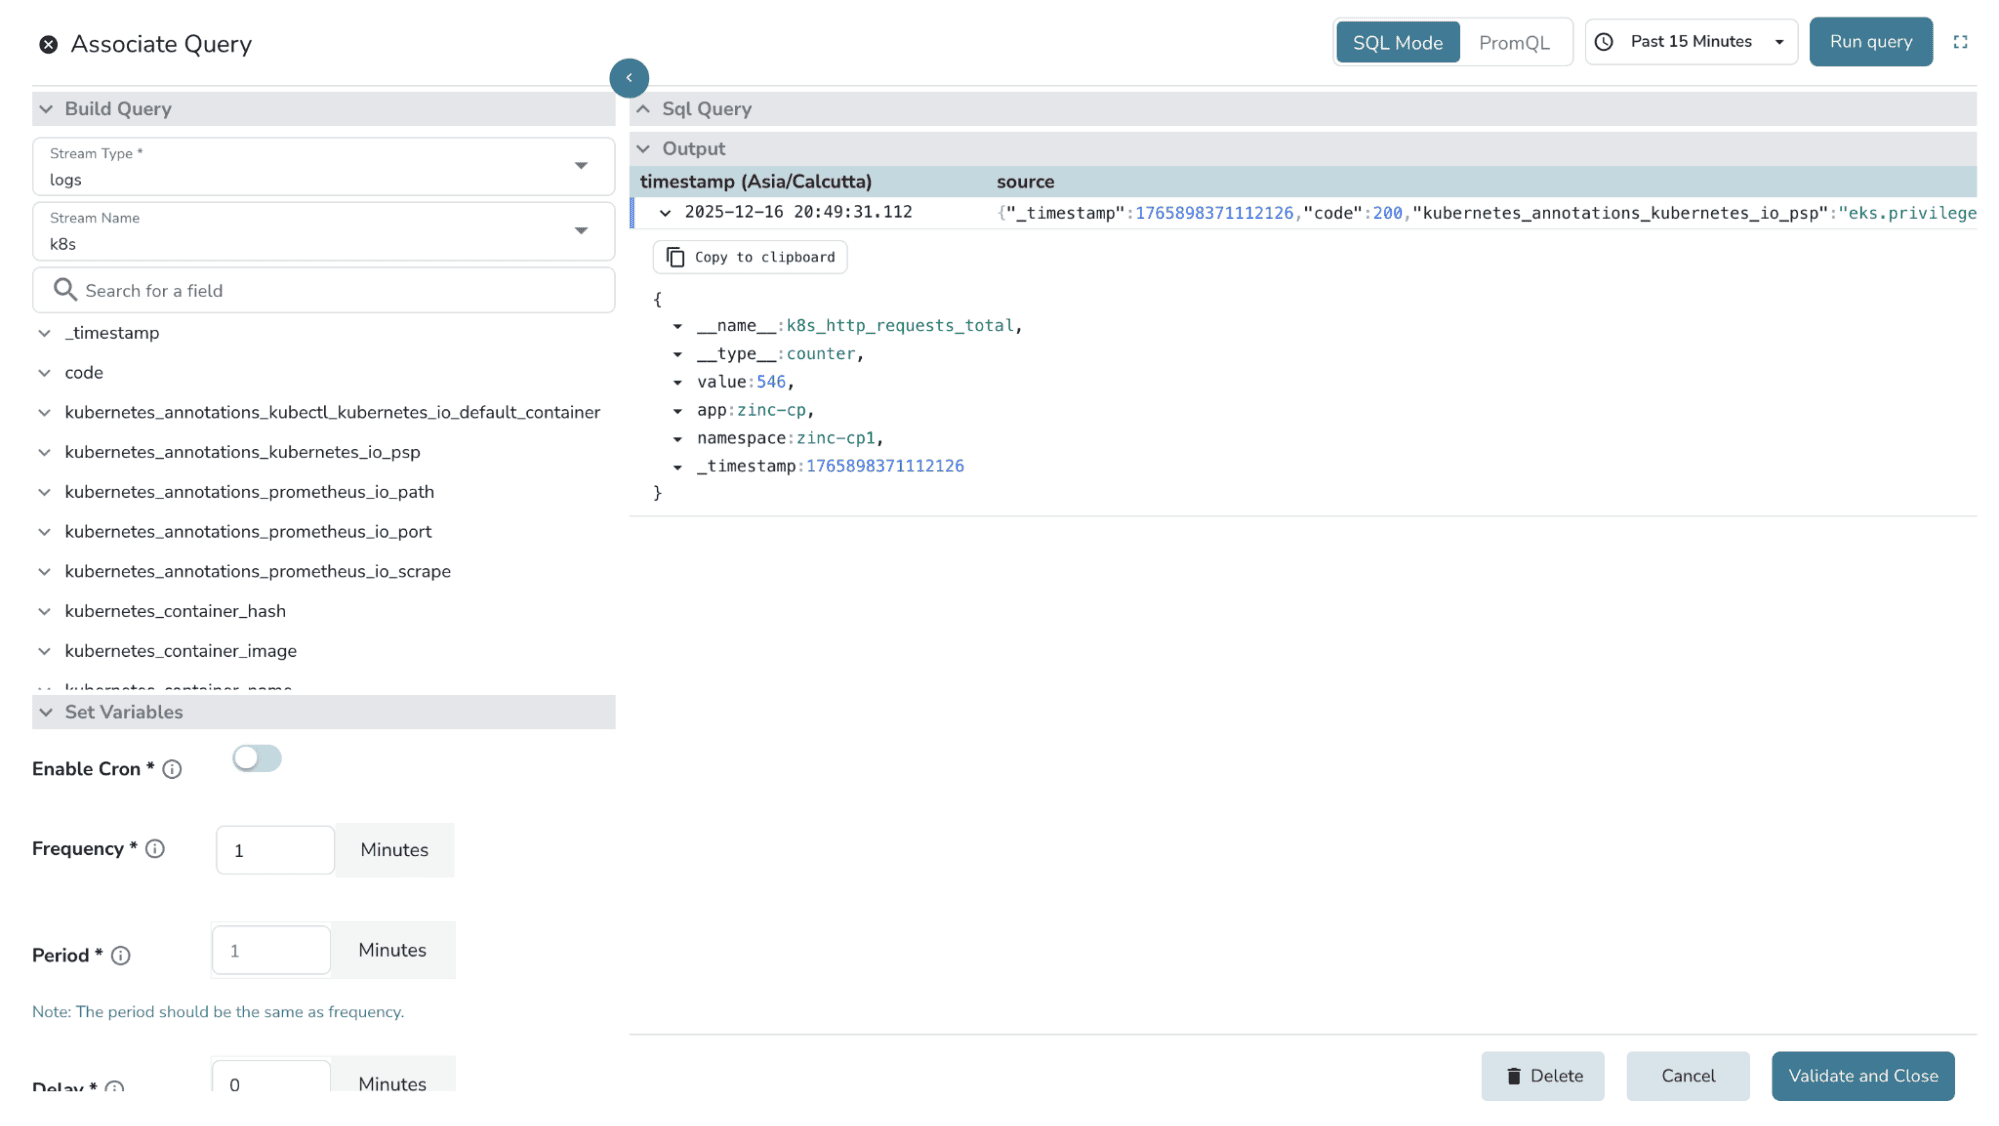
3. Define the interval/ frequency for the pipeline to run, and save.
After the source query, you can optionally use the transformation node.
This is where you might:
For simple logs-to-metrics use cases, the SQL query alone is often sufficient, but transformations give you flexibility when needed.
Finally, configure the destination node to write the output into a metric stream.
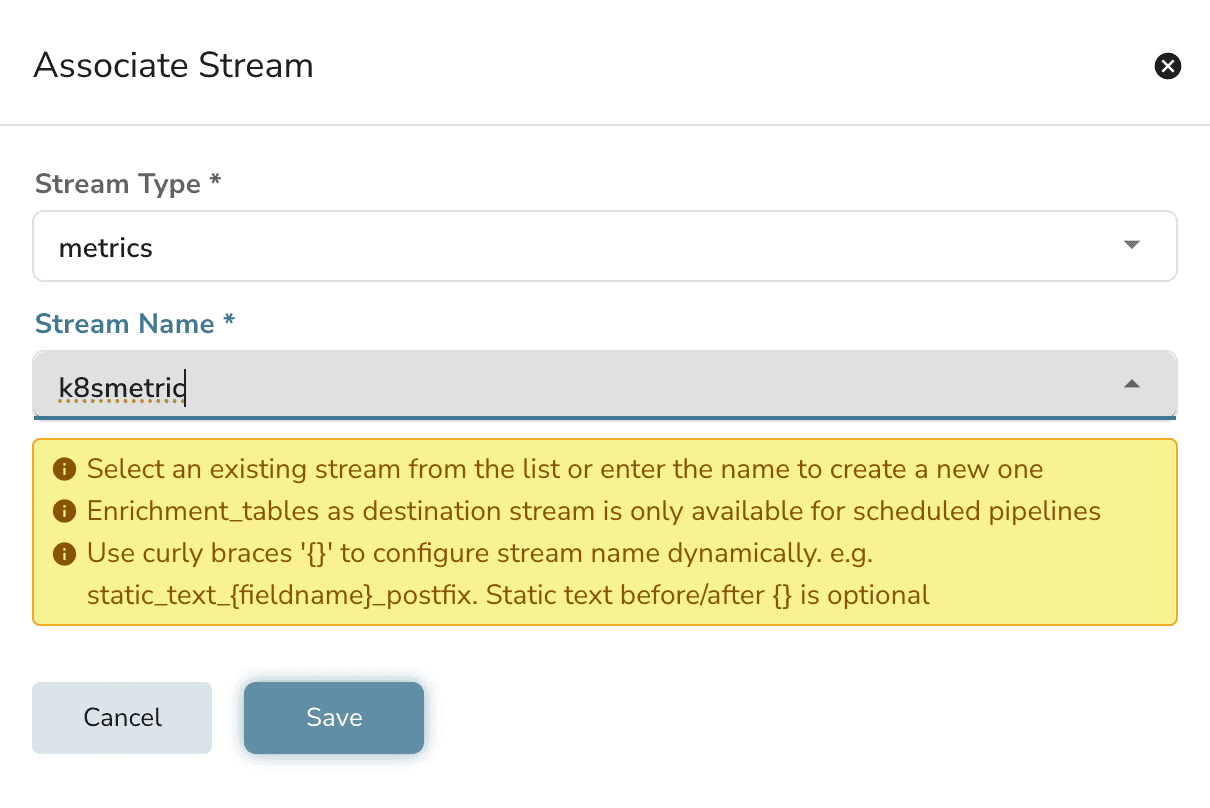
Connect the nodes based on data flow, provide your pipeline a name and save it.
Ingest new log data and wait for the scheduled pipeline to execute based on the configured interval.
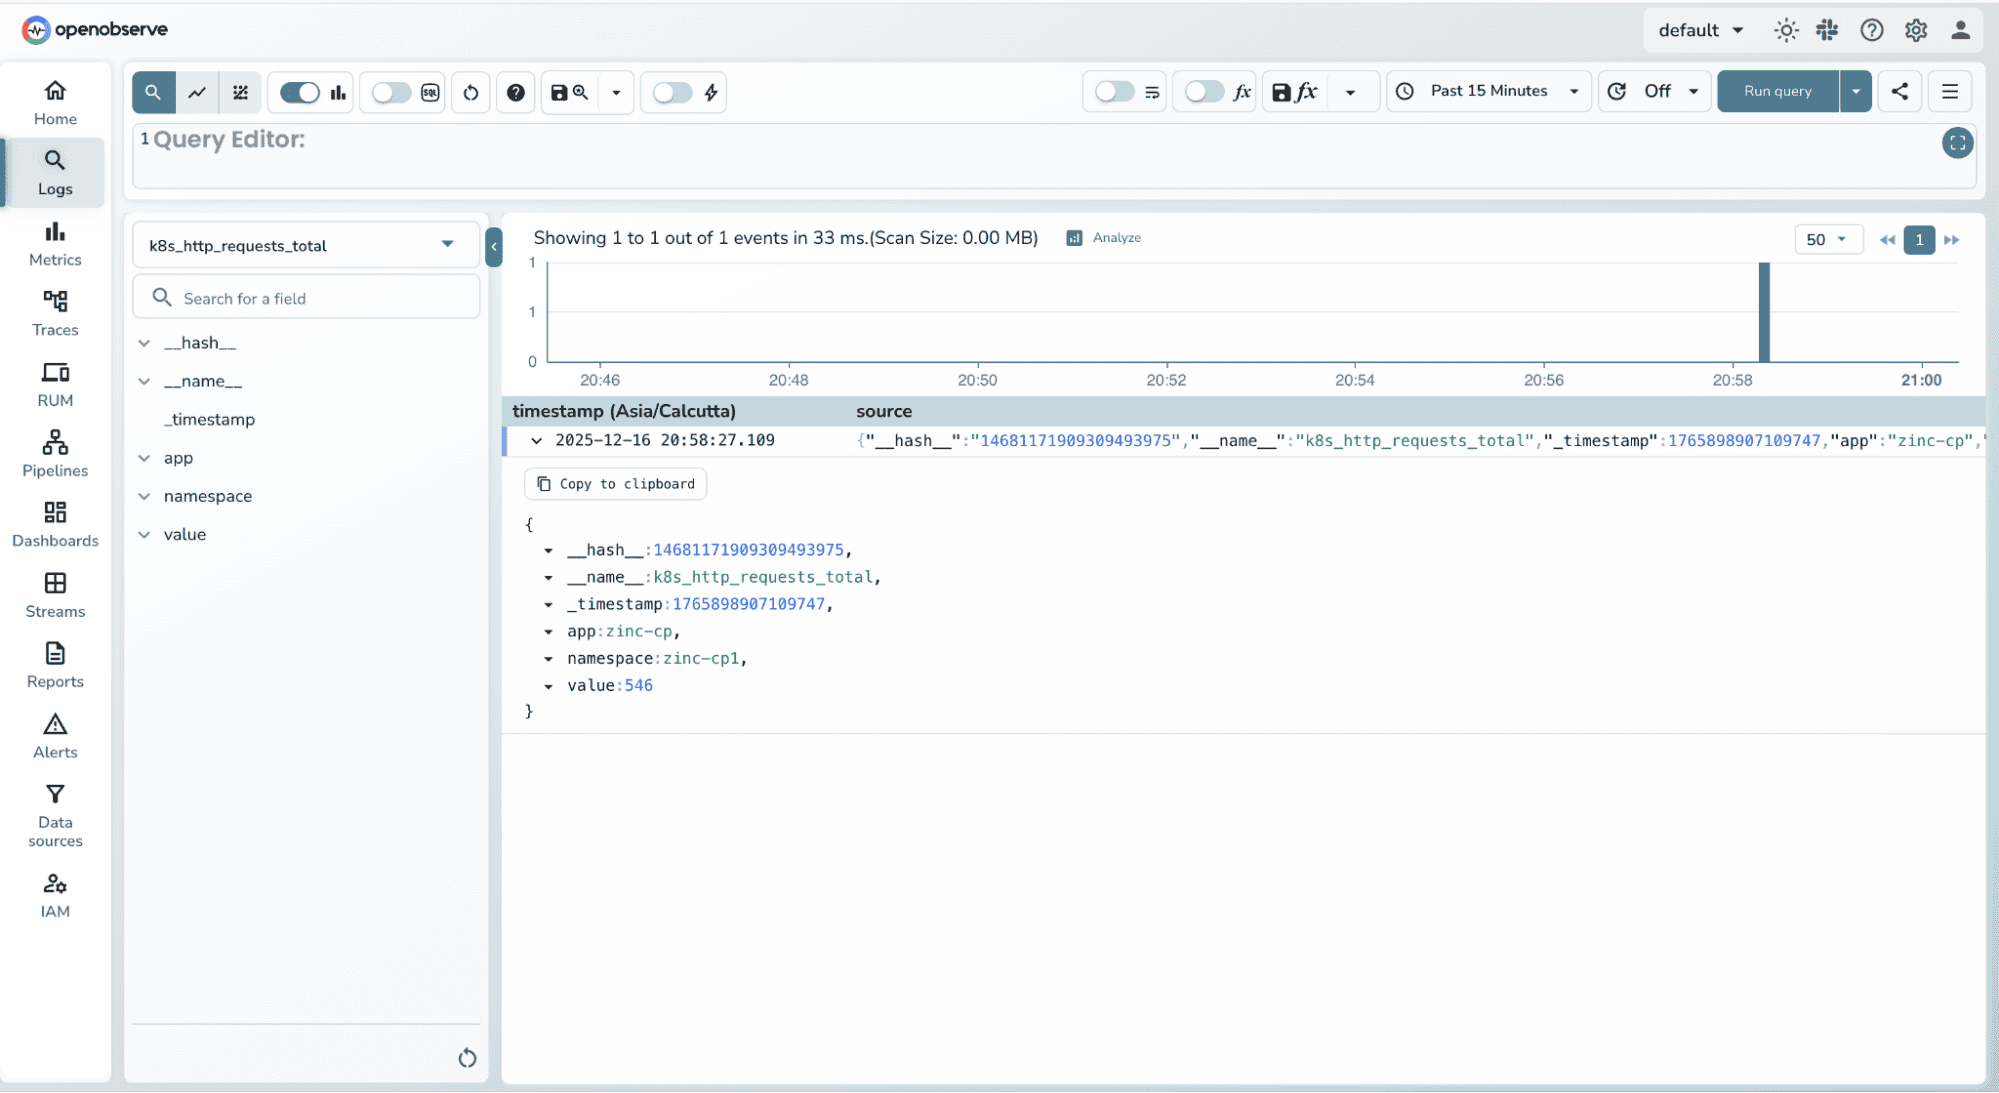
Once the pipeline runs, a new metric stream is created using the destination name you provided. Verify that the metric records contain the expected metric name, type, values, and labels.
If something goes wrong, OpenObserve gives you a few clear places to look.
First, make sure usage reporting is enabled by setting ZO_USAGE_REPORTING_ENABLED=true. This allows OpenObserve to record pipeline execution details and surface meaningful error information. (You can refer to the usage reporting guide for setup details.)
When a scheduled pipeline runs and encounters an error, the failure details are written to the error stream. This is where you’ll find messages about missing fields, invalid metric formats, or query execution issues.
You can also inspect the triggers stream, which records each scheduled execution of the pipeline. This helps you confirm whether the pipeline is running on schedule and whether it’s actually reading data from the source stream.
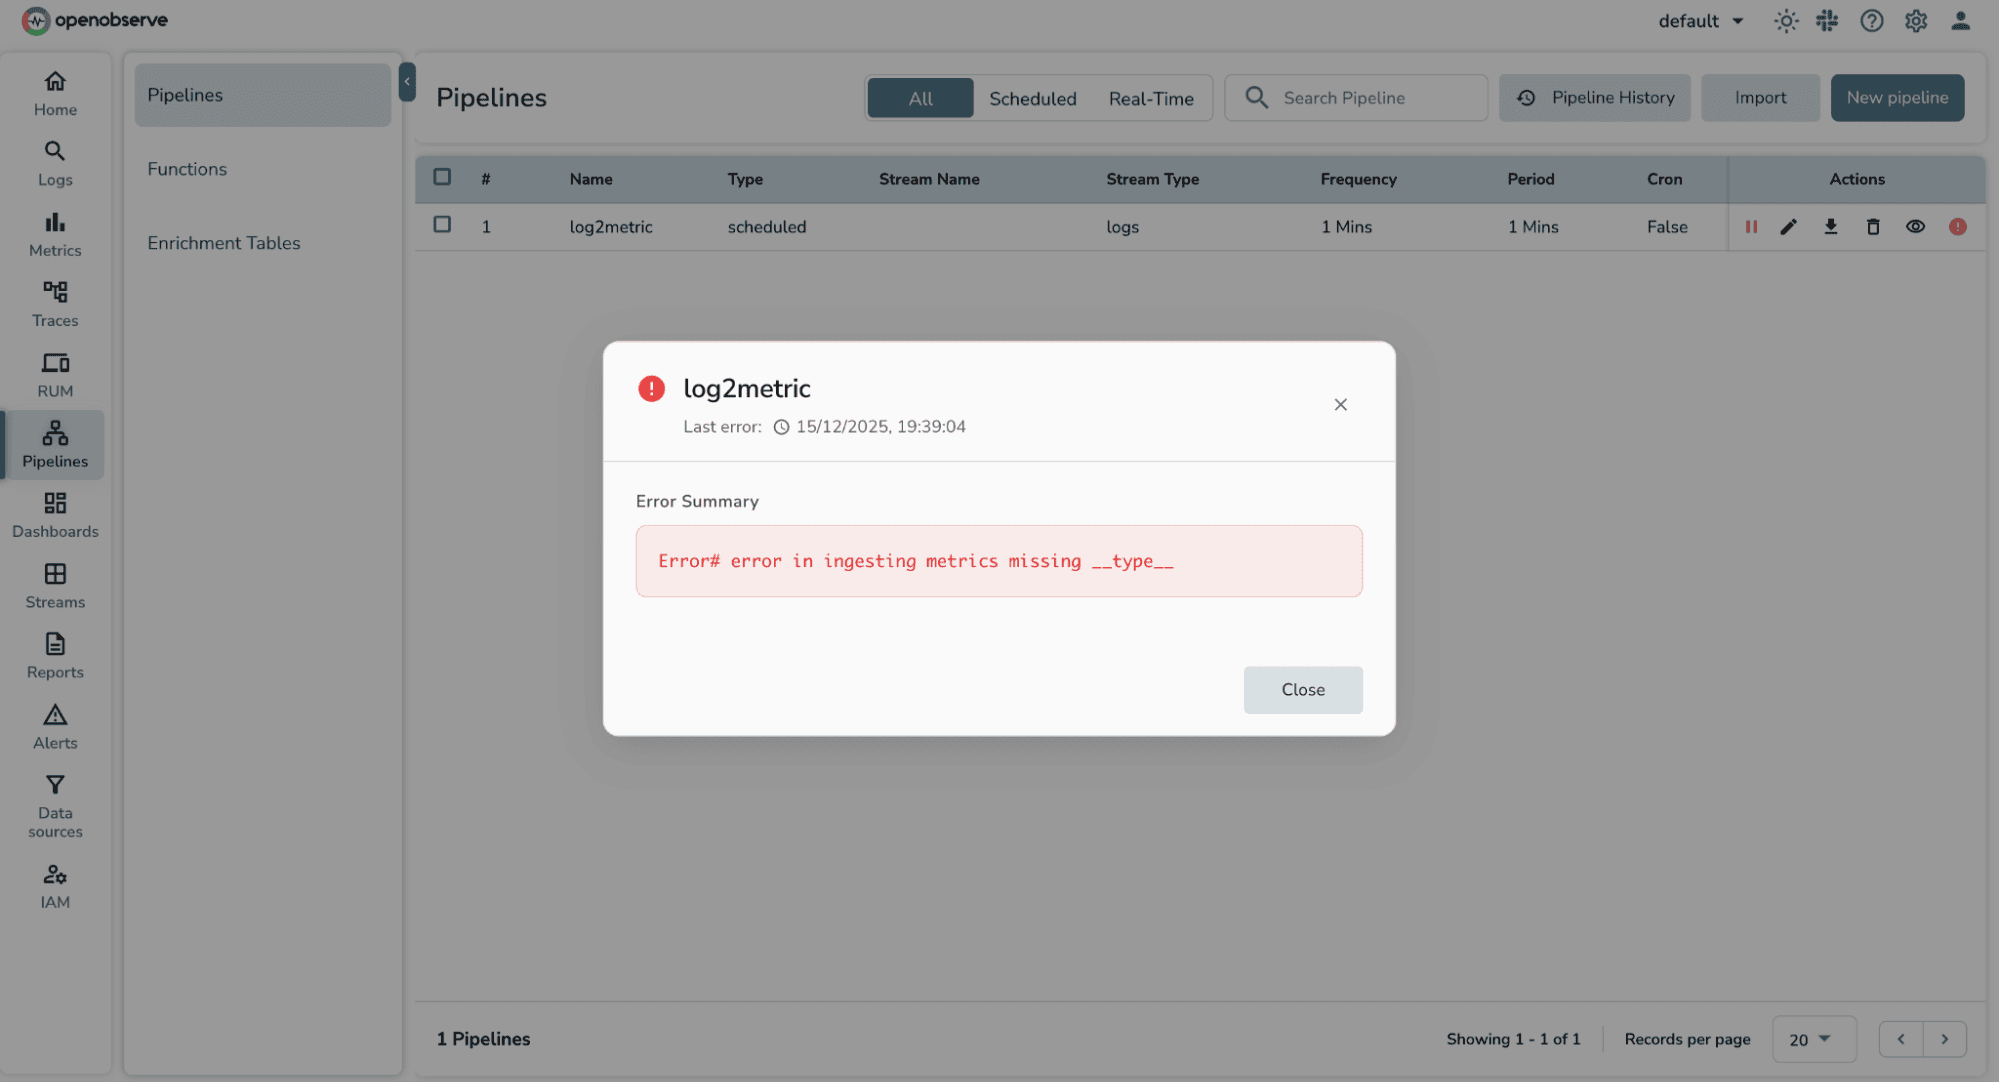
In the UI, failed runs are highlighted with a pipeline failure indicator, along with the associated error message. This makes it easy to quickly spot what went wrong and iterate on the pipeline configuration.
When setting up scheduled pipelines to convert logs into metrics, a few common errors can prevent the pipeline from writing data into a metric stream. Most of these issues are related to missing or incorrectly defined metric fields.
error in ingesting metrics missing __name__This error means the pipeline output does not include the __name__ field, which is required to identify the metric.
How to fix it:
__name__ as a string field.__name__ (including underscores).__name__ column.Example:
SELECT
  'k8s_http_requests_total' AS "__name__",
  ...
error in ingesting metrics missing __type__This indicates the metric type is not being set.
How to fix it:
__type__ field to your query output.counter or gauge.Example:
SELECT
  'counter' AS "__type__",
  ...
error in ingesting metrics missing valueThis error occurs when the metric datapoint itself is missing.
How to fix it:
value field.COUNT(*), SUM(), or AVG().value must be spelled exactly.Example:
COUNT(*) AS "value"
DerivedStream has reached max retries of 3This message means the scheduled pipeline failed multiple times due to one or more of the issues above.
What’s happening:
How to fix it:
__name__, __type__, and value are present and correct.Once the underlying issue is fixed, the pipeline will automatically resume on its next run.
Sometimes the pipeline runs successfully, but no metrics are produced. In this case, the issue is often not with the pipeline logic itself, but with the source data.
What’s happening:
This typically means there are no logs available in the source stream for the selected time window.
How to fix it:
Once logs are confirmed in the source stream and the query returns rows, the scheduled pipeline will begin producing metrics on the next run.
Scheduled pipelines provide a practical bridge between raw logs and meaningful metrics. They let you keep the detail and flexibility of logs while extracting the signals you actually need for dashboards, alerts, and SLOs.
Instead of repeatedly scanning high-cardinality log data, scheduled pipelines summarize it once, over clear time windows, and store the result in a form that scales. This makes operational views faster, alerts more reliable, and system behavior easier to reason about.
Most importantly, this approach doesn’t require new instrumentation or a major redesign. It works with the data you already have. If you find yourself building dashboards or alerts directly on top of logs, that’s usually a sign that it’s time to introduce this missing layer.
Once you’ve successfully converted logs into metrics using a scheduled pipeline, there are a few natural directions to build on this foundation.
Passionate about observability, AI systems, and cloud-native tools. All in on DevOps and improving the developer experience.


