Navigating Observability: Logs, Metrics, and Traces Explained

Simran Kumari
August 14, 2025
10 min read
Don’t forget to share!
Try OpenObserve Cloud today for more efficient and performant observability.
By the end of this guide, you’ll understand:
You've built an app. It's running on a server. Users are using it. Life is good.
Then at 2 AM, you get a call: "The website is broken!"
You frantically SSH into your server, run top to check CPU, maybe df -h to see disk space. Everything looks... fine? You restart the application. It works again. You go back to bed, but you're left with that nagging question: What actually went wrong?
This scenario plays out thousands of times every day for developers worldwide. The problem isn't that we don't know how to fix issues, it's that we don't know what's actually happening inside our systems when things go wrong.
This is where observability helps.
Observability isn't just a buzzword, it's a combination of the tools and techniques that help answer three critical questions when your system misbehaves:
Think of observability as providing your application a voice. Instead of your app silently failing and leaving you to guess what went wrong, an observable system tells you exactly what's happening, when it happened, and why.
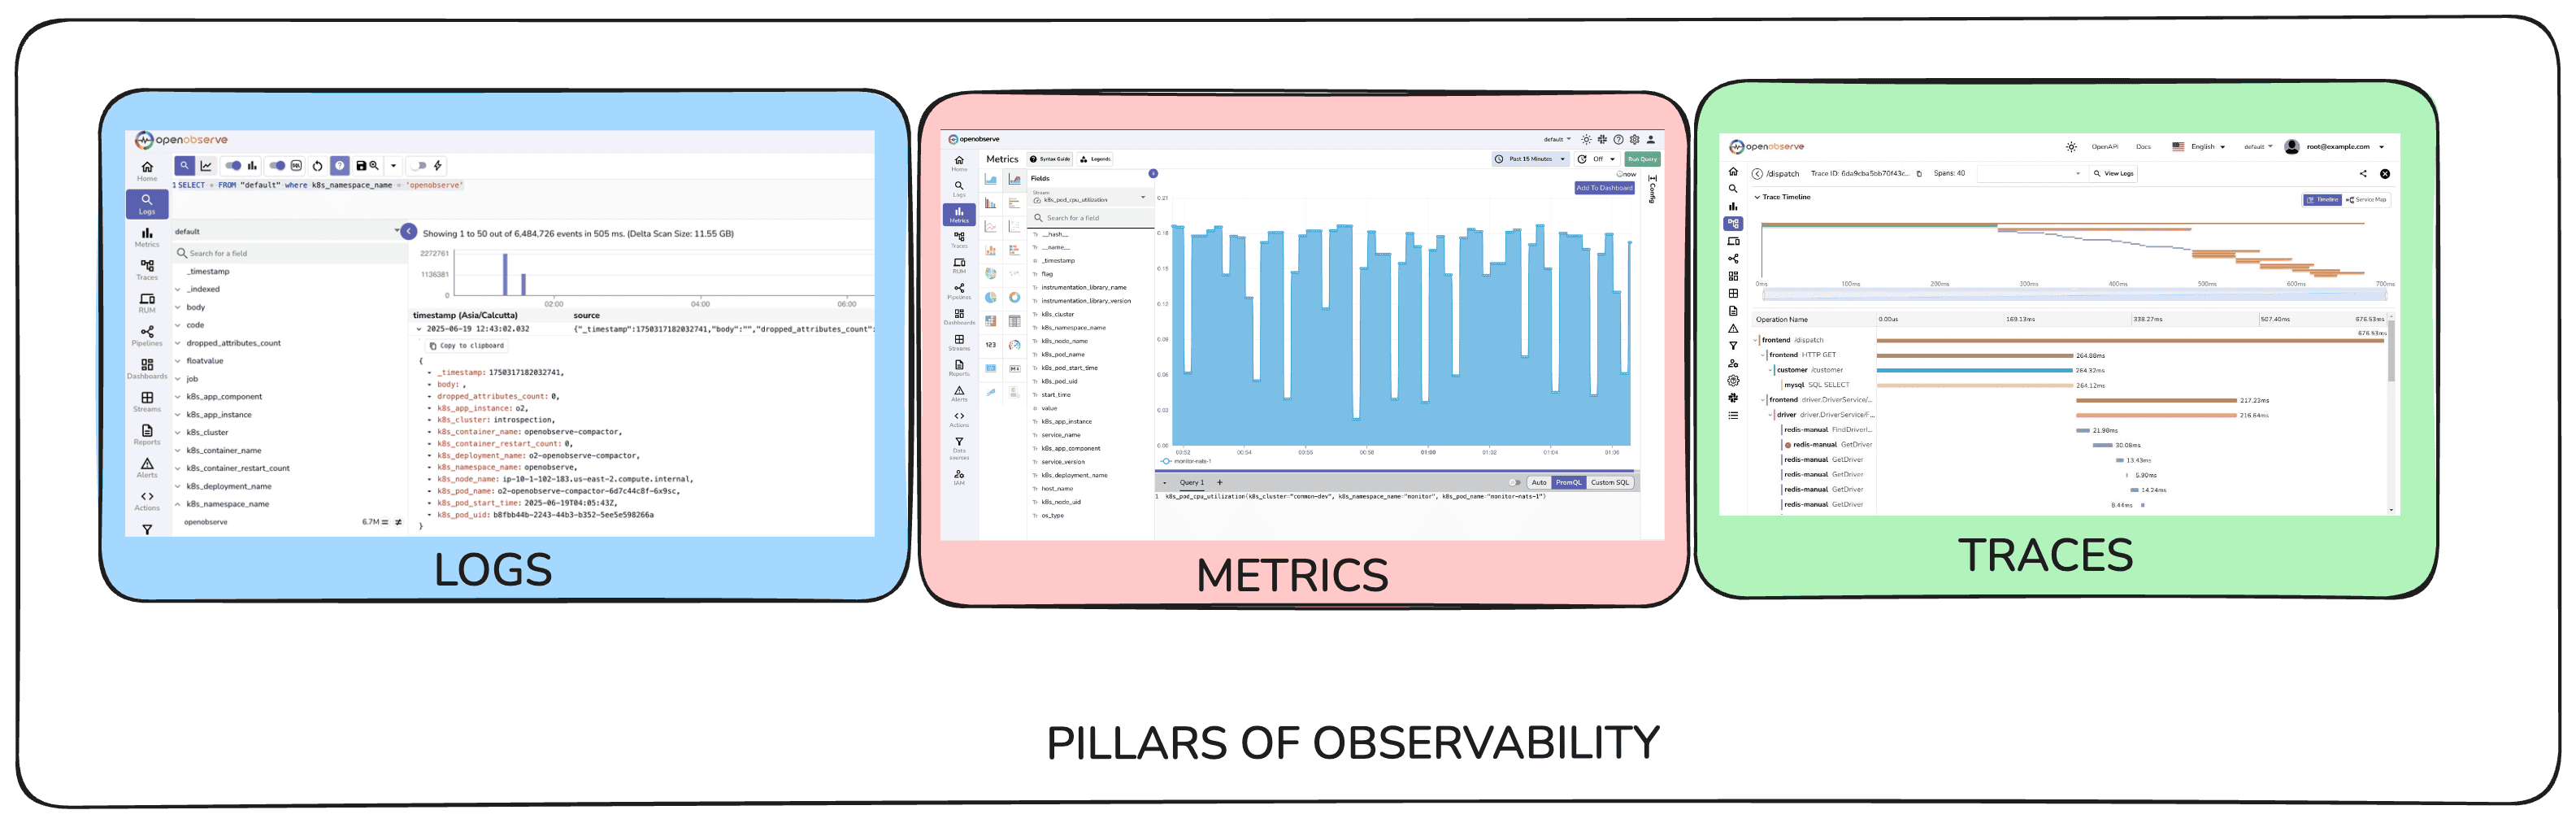
The foundation of this "voice" comes from three types of data your application can emit:
Let's see how each one solves real problems.
Starting Simple: Your App on a Server
Let's say you have a Node.js web application running on a single server. Users can sign up, log in, and browse products. It's working fine, but you want to sleep better at night.
The First Problem: Is Everything Actually OK?
You need to know if your app and server are healthy. This is where metrics come in.
Metrics are numbers that change over time. They're like taking your app's temperature and pulse continuously.
Here's what you might want to track:
// Server health metrics
cpu_usage_percent = 45
memory_usage_percent = 67
disk_usage_percent = 23

// Application health metrics
requests_per_minute = 120
response_time_ms = 250
failed_requests_percent = 0.8
active_users = 43
Real example: Your response time metric shows requests that normally take 200ms are now taking 2000ms. You check and find the database connection pool is exhausted, you can fix it before users start complaining about slow page loads.
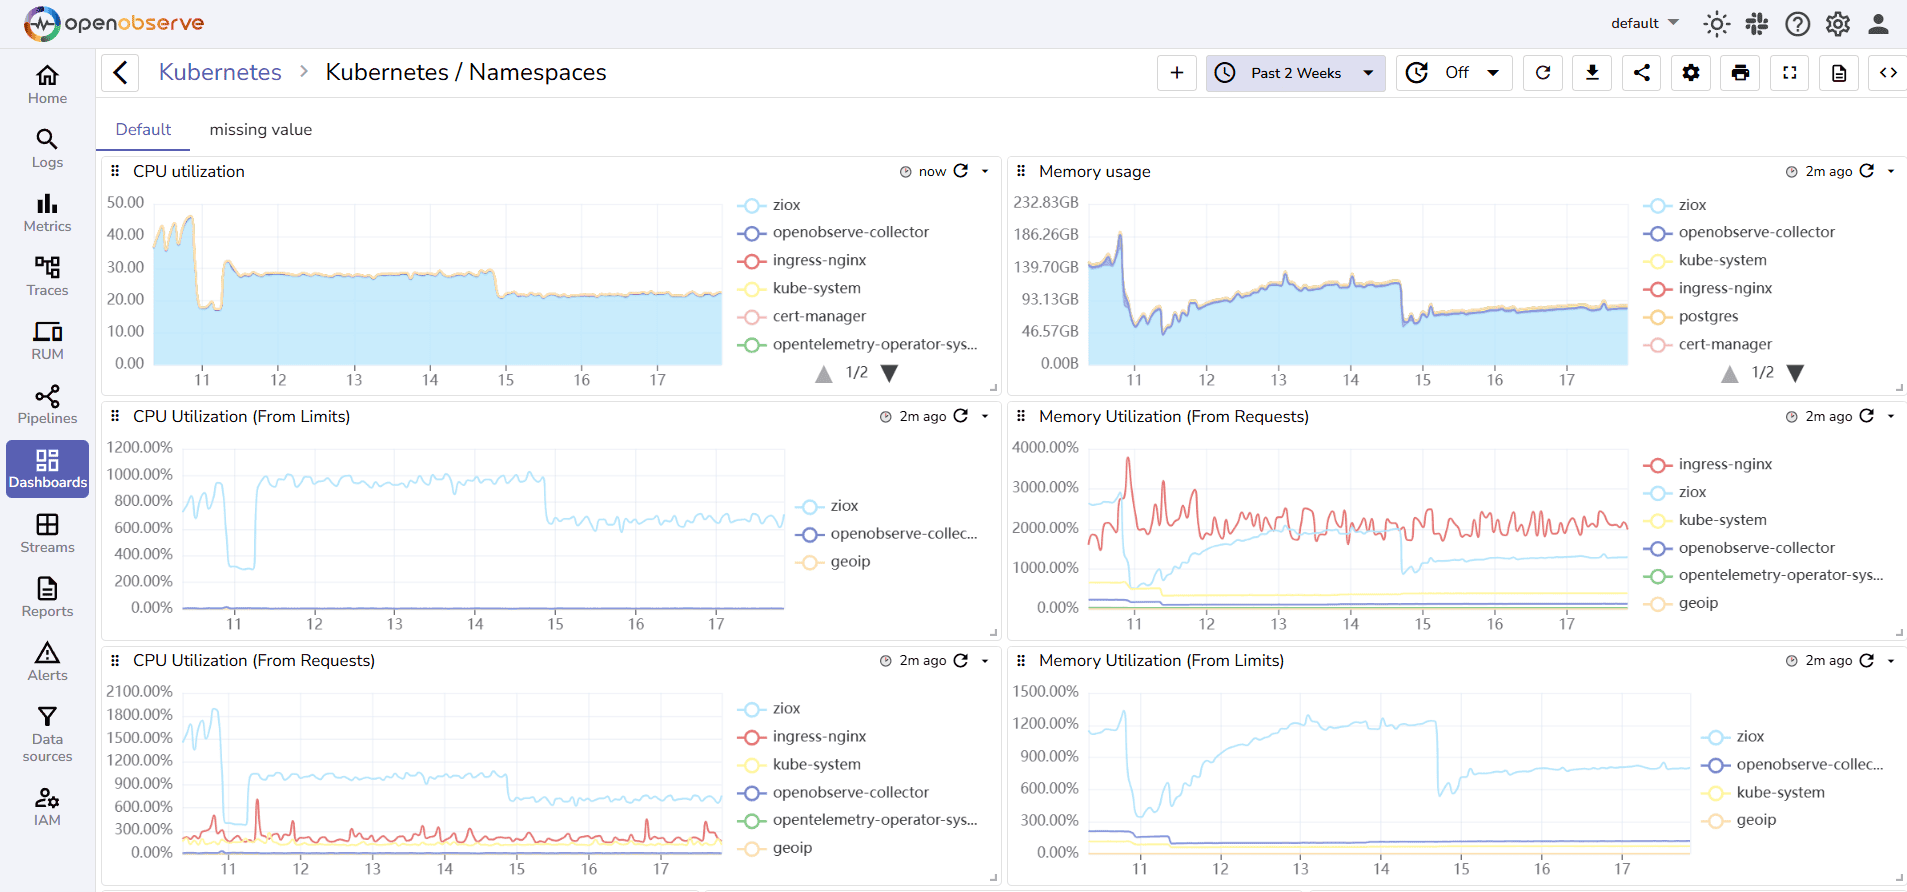
Raw numbers scrolling by are useless. You need these metrics displayed on graphs over time. Dashboards show you things like:
A good dashboard answers "Is my system healthy?" at a glance.
The Second Problem: Something's Wrong, But What Exactly?
Metrics tell you that something is wrong. Your percentage of failed requests is spiking. But what failures? Which users? What caused them?
This is where logs come in.
Logs are detailed records of specific events that happened in your application. They're like a detailed diary of everything your app does.
Instead of just knowing "more requests are failing," logs tell you:
2024-08-08T14:30:15Z ERROR [AuthService] Failed login attempt for user@email.com: invalid password
2024-08-08T14:30:16Z ERROR [AuthService] Failed login attempt for user@email.com: invalid password
2024-08-08T14:30:17Z ERROR [AuthService] Failed login attempt for user@email.com: account locked after 3 failed attempts
2024-08-08T14:30:45Z INFO [AuthService] Password reset requested for user@email.com
Random text logs are hard to analyze. Structured logs (usually JSON) make searching and filtering much easier:
{
  "timestamp": "2024-08-08T14:30:15Z",
  "level": "ERROR",
  "service": "AuthService",
  "message": "Failed login attempt",
  "user_id": "12345",
  "email": "user@email.com",
  "reason": "invalid_password",
  "attempt_count": 1
}
With structured logs, you can easily answer questions like: "Show me all errors from the AuthService in the last hour", "How many failed login attempts did user 12345 have today?" etc.
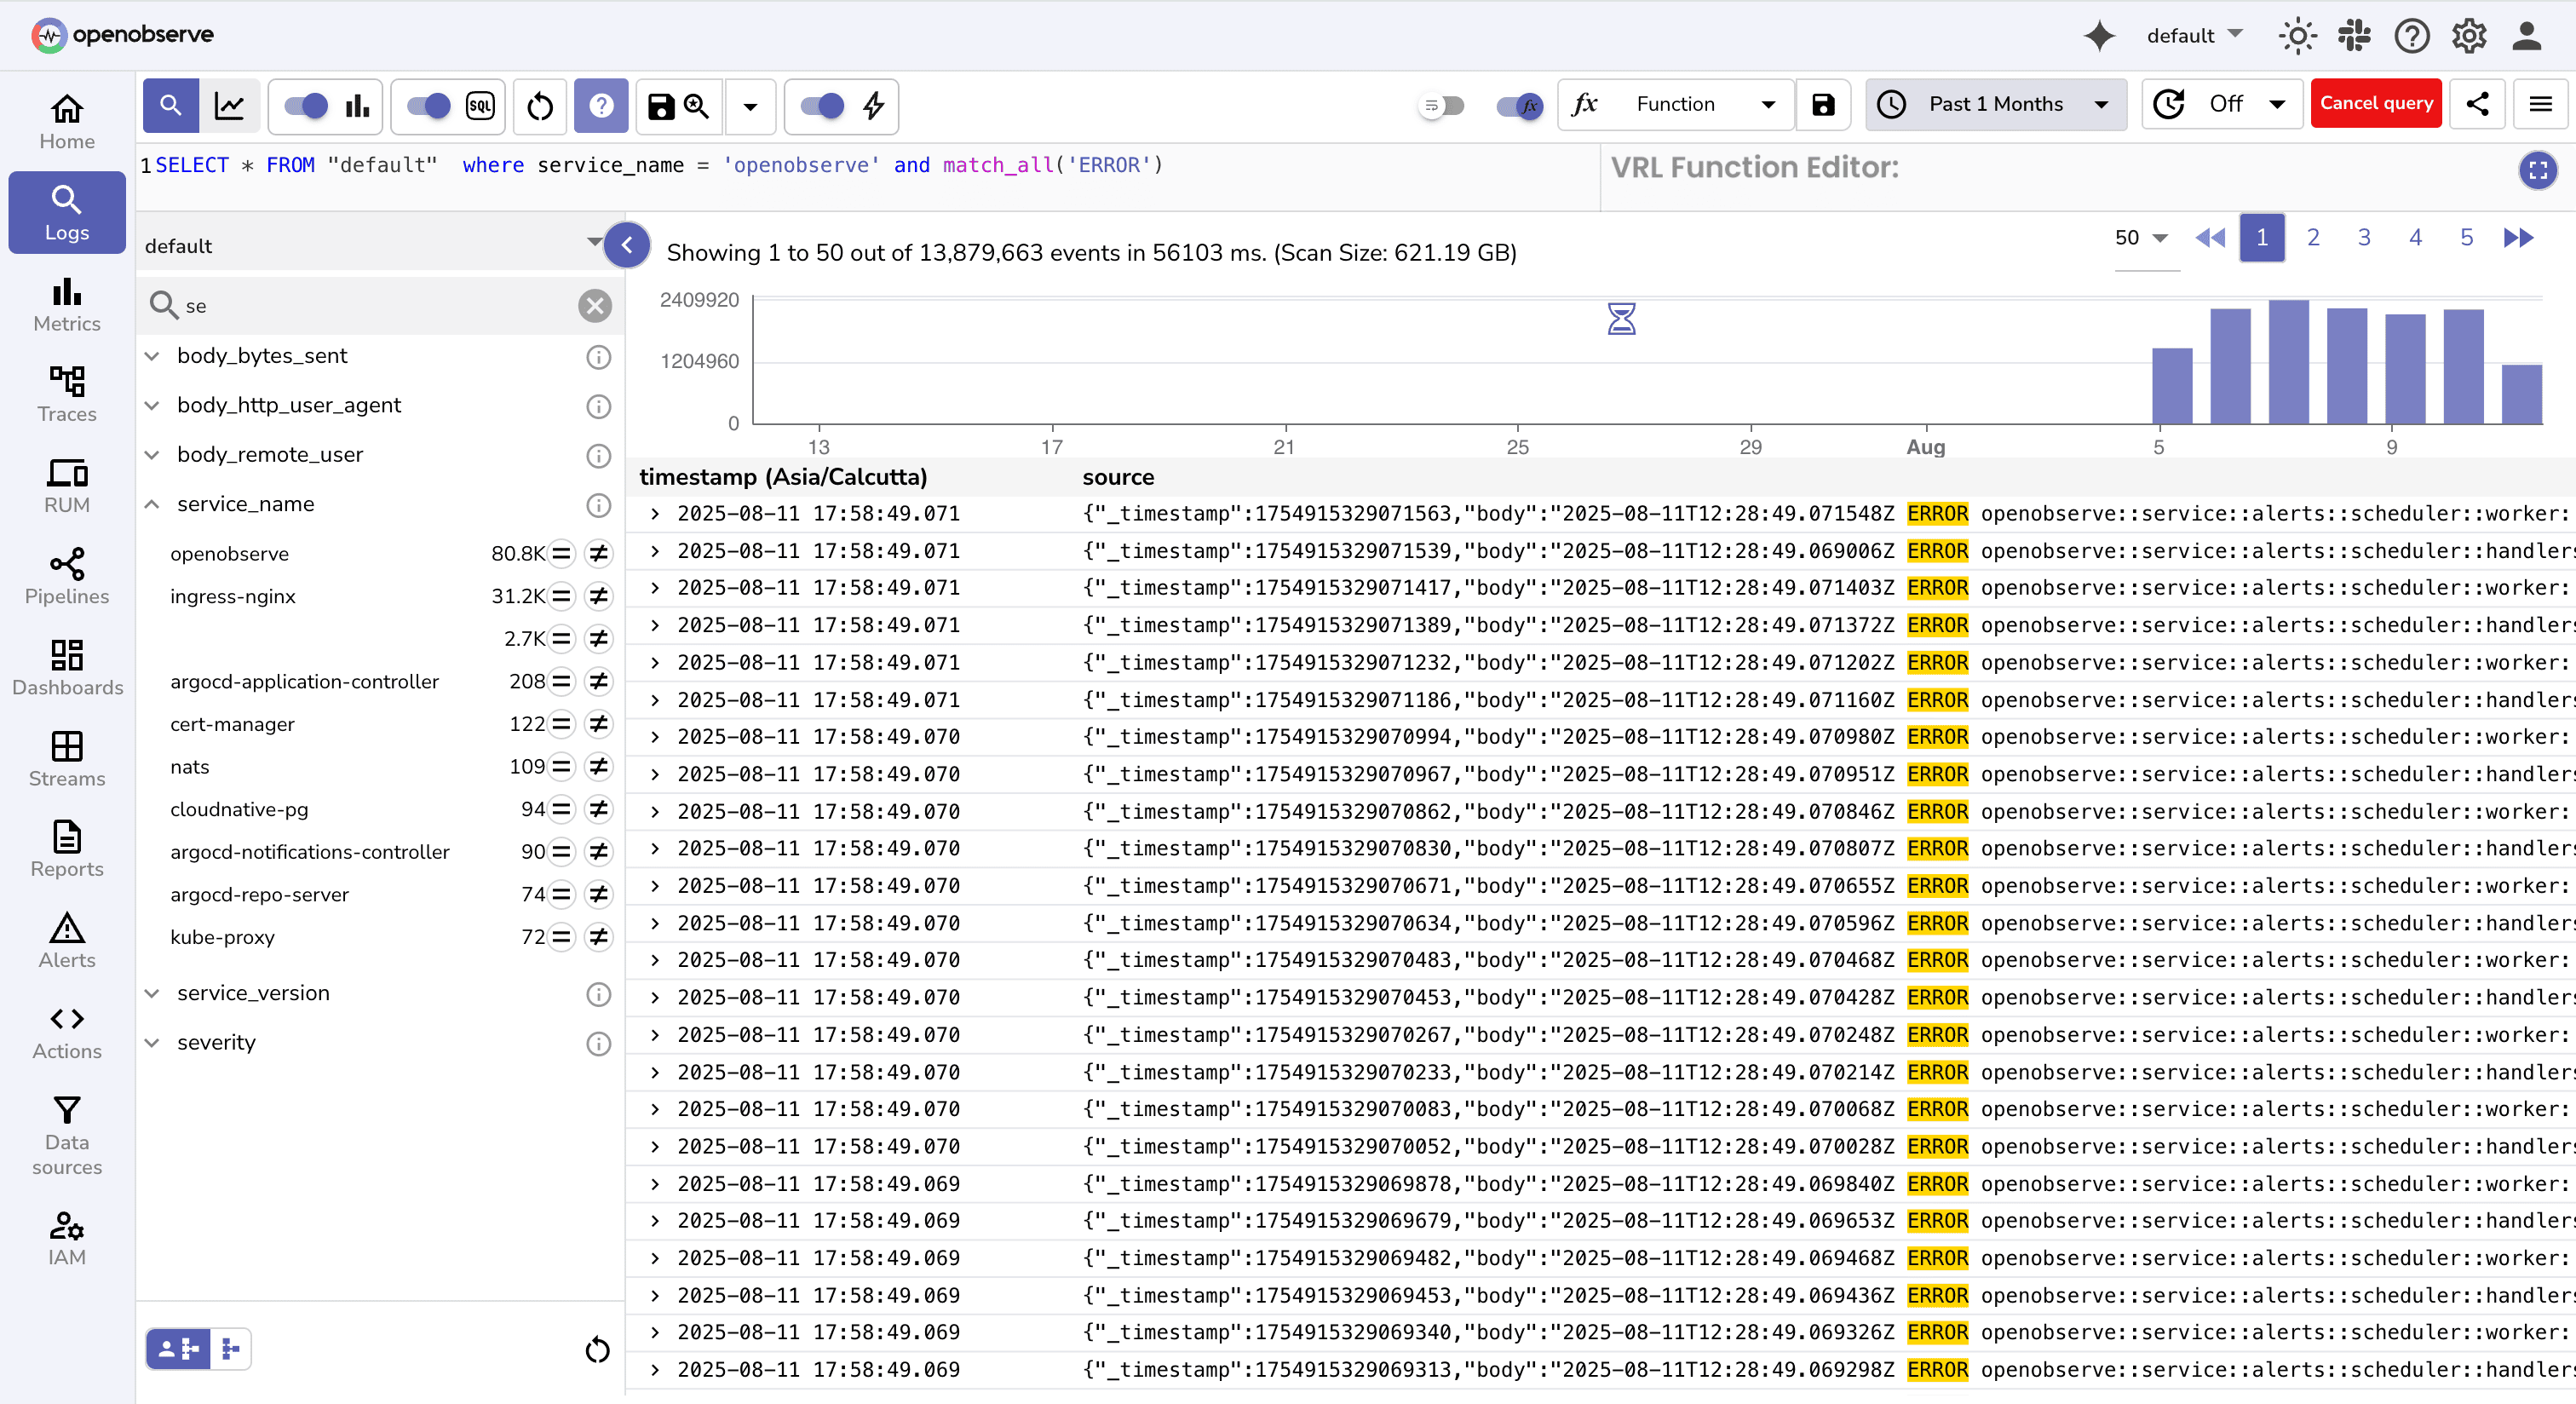
Log analysis tools make searching and visualizing logs straightforward. Check out how log parsing works in OpenObserve.
The Plot Thickens: Microservices
Your simple single-server app is growing. You've split it into multiple services:
Each service runs on its own server (or container). This is great for scalability and team independence, but creates a new problem.
The Third Problem: Where in My Distributed System Did Things Go Wrong?
A user reports: "I can't complete my purchase. The page just hangs."
You check your metrics, all services are healthy.
You check logs in each service... but which service was the user's request even touching? How do you follow a single user's journey across multiple services?
This is where traces become crucial.
A trace shows the path of a single request as it travels through your distributed system.
Imagine a user clicking “Buy Now.” The request first lands in the Order Service, which needs to verify the user, check product inventory, and process payment. To do this, it calls the User Service, the Product Service, and finally the Payment Service, which might in turn contact an external payment gateway. The responses then travel back up the chain until the user sees a success or failure message.
A trace records this entire journey from start to finish, revealing the relationships between services and the timing of each call.
But how does this actually work? Think of it like a relay race where runners pass a baton, but instead of a baton, they pass a unique ID.
When a user clicks "Buy Now":
Each service leaves its own breadcrumb trail, but they're all connected by that same trace ID. Later, the tracing system can gather all the breadcrumbs with ID "abc123" and show you the complete journey - which services were involved, how long each took, and in what order things happened.
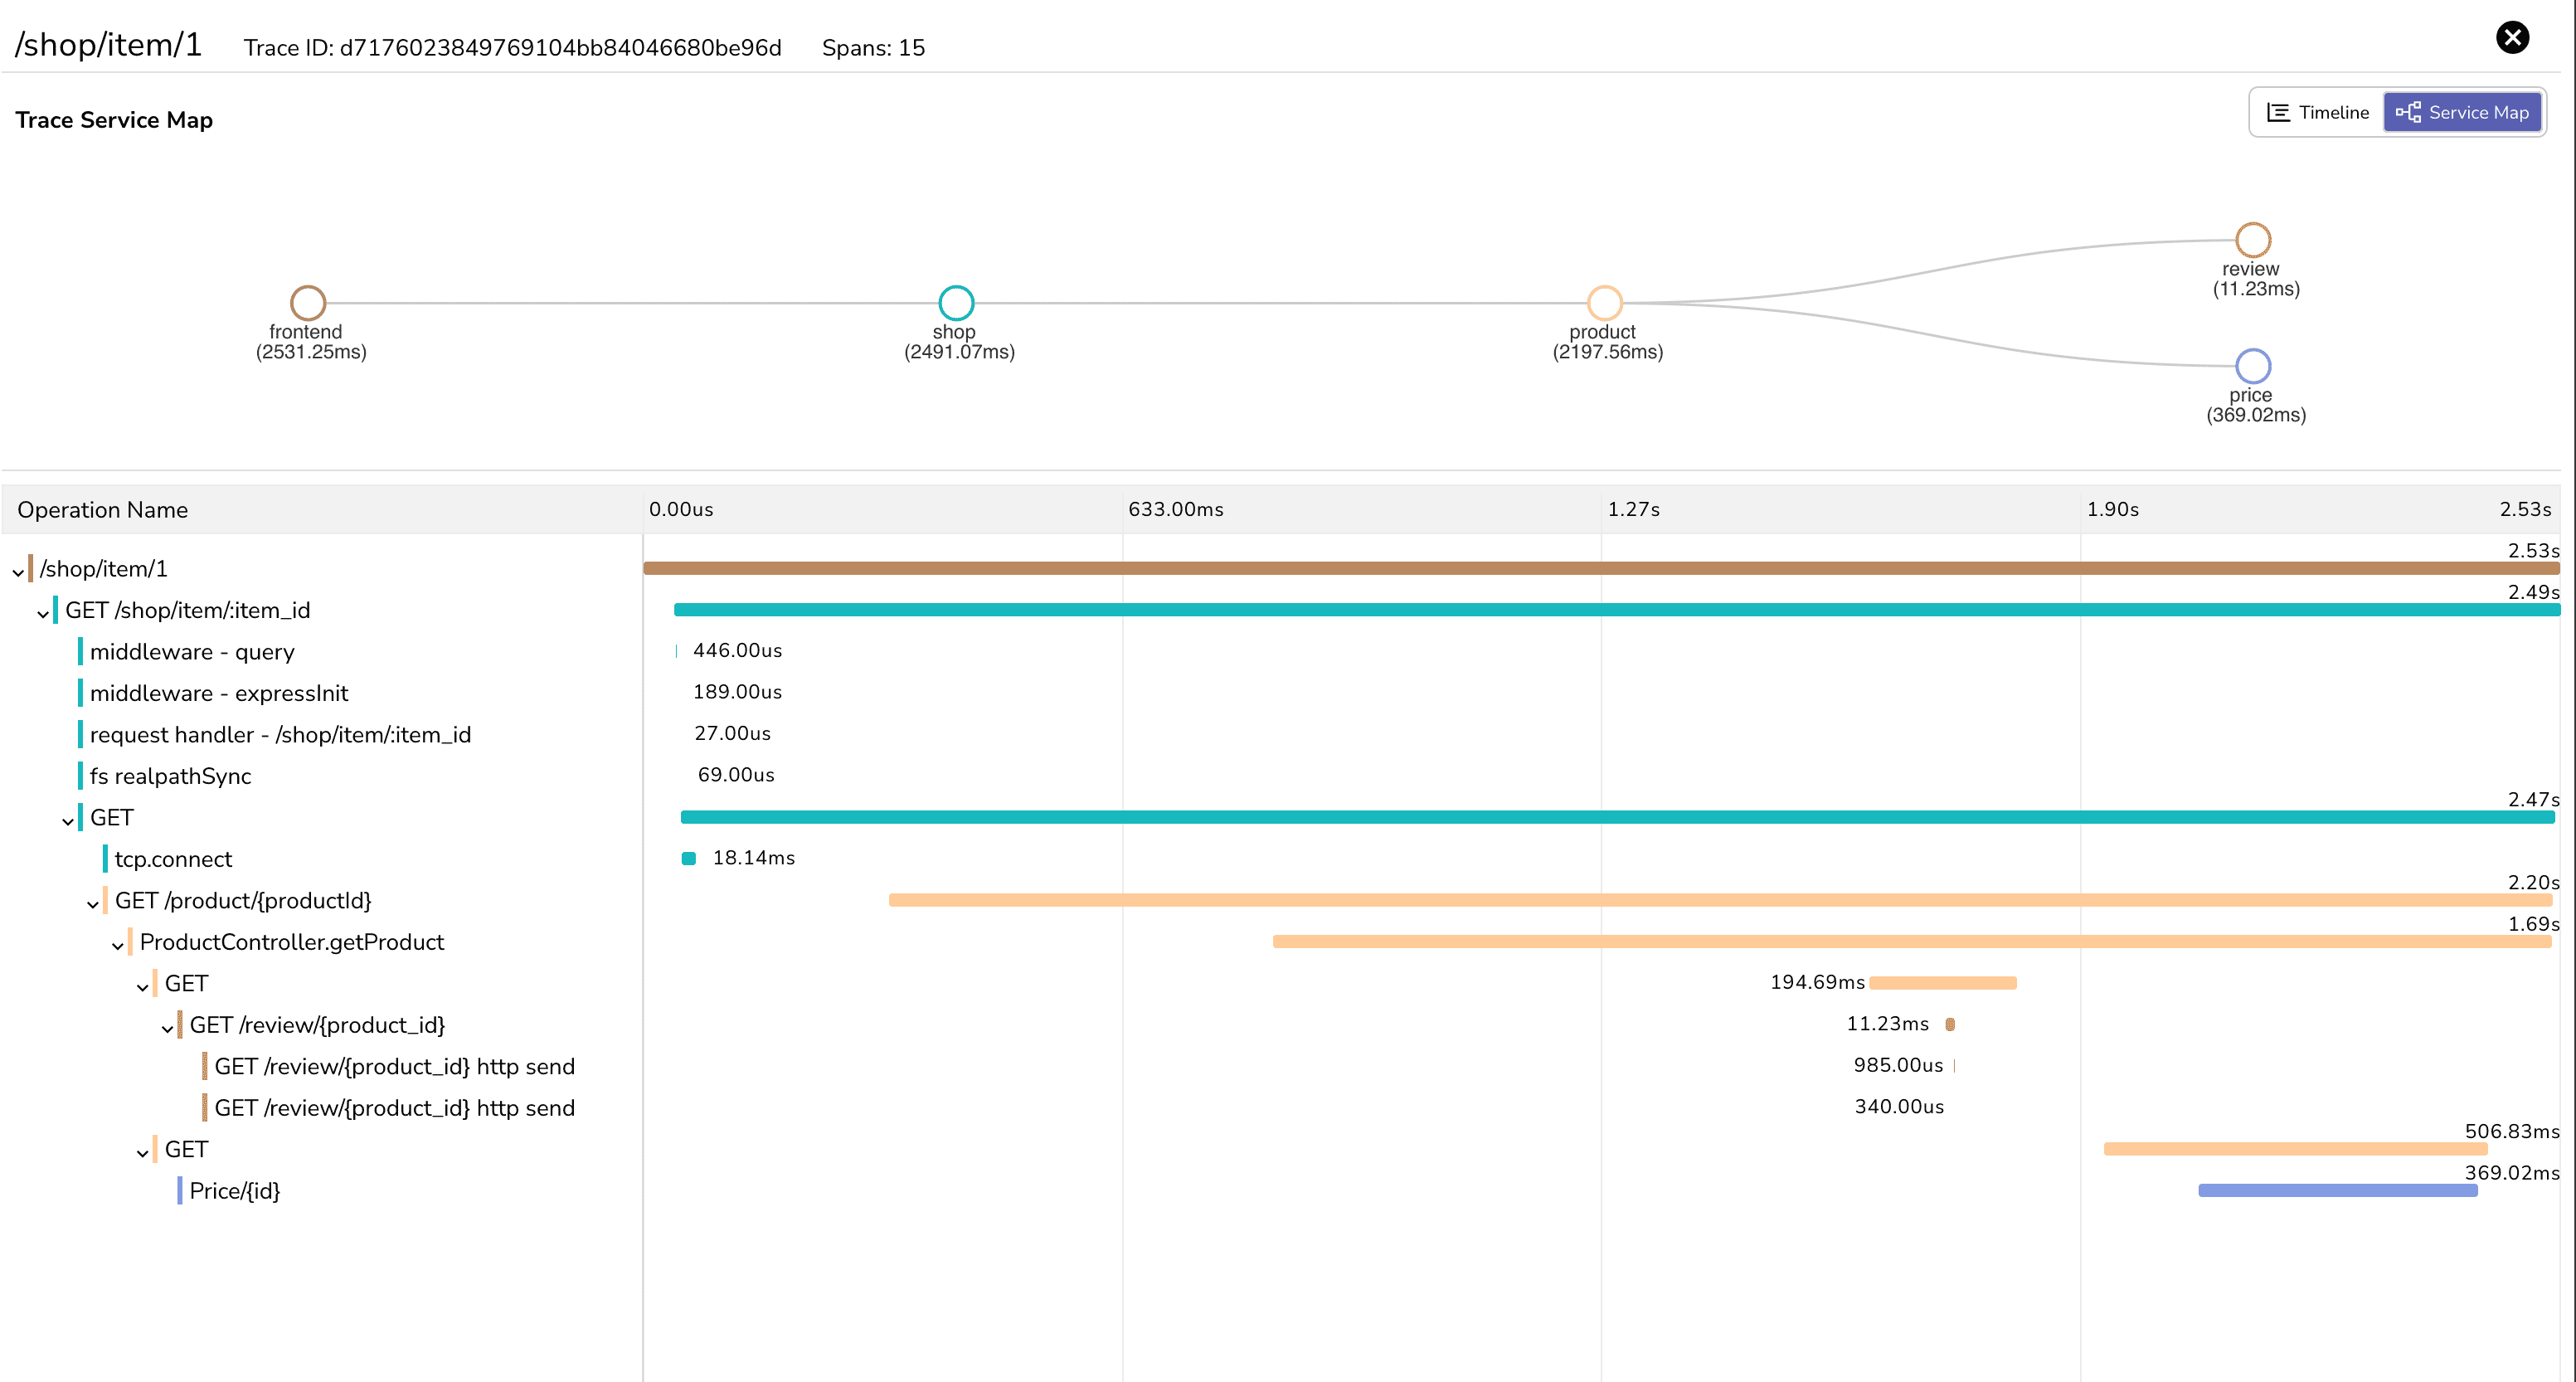
When you look at this in an observability tool's UI, you see something like:
Purchase Request [1,200ms total]
├── Order Service: Process Order [50ms]
├── User Service: Verify User [100ms] ✓
├── Product Service: Check Inventory [150ms] ✓
├── Payment Service: Charge Card [900ms] ⚠️
│   ├── Validate Card [100ms] ✓
│   ├── External Payment Gateway [750ms] ⚠️
│   └── Update Transaction [50ms] ✓
└── Order Service: Finalize Order [100ms] ✓
This trace immediately shows the problem: the external payment gateway is taking 750ms, making the entire request slow. Now you know exactly where to look.
Without traces, debugging distributed systems is like solving a puzzle with pieces scattered across different rooms. You might find errors in individual services, but understanding how they relate to a single user's experience is nearly impossible.
With traces, you can follow a failing request across every service it has touched, pinpoint the exact service causing delays, and see how a slowdown in one place ripples through the rest of the system. They’re especially powerful for untangling complex interactions where multiple services depend on each other.
The magic happens when you combine all three:
Scenario: Your e-commerce site is having issues during a Black Friday sale.
Root cause discovered: The fraud detection system (called by a payment service) has a bug that makes it extremely slow for high-value transactions. Without all three pieces of telemetry, you might have spent hours checking database connections, server resources, or network issues.
Setting up observability traditionally meant cobbling together multiple tools - one for metrics, another for logs, a third for traces. Each tool has its own interface, storage requirements, and learning curve. This complexity often prevents teams from getting started or forces them to choose just one pillar.
OpenObserve changes this by providing a unified platform for all three pillars of observability:
Instead of jumping between different tools to correlate metrics spikes with log errors and trace slowdowns, you see everything in one interface.
Rather than managing separate infrastructure for metrics storage, log indexing, and trace collection, OpenObserve handles it all. By consolidating infrastructure, teams save both time and costs.
Remember our Black Friday scenario? With traditional tools, you might notice a metrics spike in one dashboard, open a separate log analysis tool to find timeout errors, then jump into a tracing tool to investigate bottlenecks, manually lining up timestamps along the way.
With OpenObserve, this investigation happens in one place. You see the metrics spike, click to view related logs, and instantly access the traces for those specific failing requests. What used to take 30 minutes of tool-hopping becomes a 5-minute focused investigation.
Observability transforms you from someone who reacts to problems to someone who understands their system. Instead of frantically restarting services and hoping for the best, you'll know exactly what's wrong, why it's wrong, and how to fix it.
Your 2 AM debugging sessions will become rare, targeted investigations with clear answers. And when you do need to debug, you'll have the data to solve problems quickly instead of guessing.
That's the real value of observability: turning the mystery of "my app is down" into the clarity of "I know exactly what's wrong and how to fix it."
Passionate about observability, AI systems, and cloud-native tools. All in on DevOps and improving the developer experience.


