Choosing the Right SaaS Monitoring Solution: Features, Best Practices, and ROI


Try OpenObserve Cloud today for more efficient and performant observability.
Get Started For Free
In today's digital-first business environment, Software as a Service (SaaS) applications have become indispensable. A 2023 study found that organizations are using an average of 130 SaaS apps, an 18% increase from the previous year. This rapid adoption has transformed how businesses operate, enabling greater flexibility, scalability, and collaboration. However, this proliferation of SaaS tools also brings significant challenges in terms of management, security, and monitoring.
The stakes are high: unplanned downtime costs businesses an average of $14,056 per minute, rising to $23,750 for large enterprises. Without effective SaaS monitoring tools, these essential applications can quickly become a source of frustration, lost productivity, and substantial financial impact.
This guide will help you navigate the complex world of SaaS monitoring solutions, empowering you to make informed decisions that align with your organization's needs and goals. Although this guide uses OpenObserve as an example, its primary objective is to empower you to select the optimal SaaS monitoring solution for your business.

SaaS monitoring involves the continuous tracking and analysis of SaaS application performance to ensure reliability, availability, and optimal user experience. It goes beyond simple uptime checks, providing a holistic view of application health and user satisfaction.
To truly understand the health and performance of SaaS applications, it's essential to track a comprehensive set of metrics. The Golden Signals, a concept introduced by Google's Site Reliability Engineering (SRE) team, provide a foundation for effective monitoring through four key metrics: Latency, Traffic, Errors, and Saturation (LTES).
| Metric | Description | Impact | Industry Benchmark |
|---|---|---|---|
| Latency | Measures how quickly applications respond to user requests | Amazon found that every 100ms of latency cost them 1% in sales | < 200ms for optimal user experience |
| Traffic | Tracks the number of requests or load on the system | Helps identify usage patterns and capacity needs | Varies by application type and business requirements |
| Errors | Monitors the frequency and types of errors | Google's SRE team aims for a 99.99% success rate for critical services | < 1% for optimal performance |
| Saturation | Measures resource utilization (CPU, memory, etc.) | Prevents performance bottlenecks | < 70% utilization for optimal performance |
For a deeper level of visibility into the health and performance of a SaaS application, the following additional metrics should also be tracked: uptime, user activity, business impact, and security events.
| Metric | Description | Impact | Industry Benchmark |
|---|---|---|---|
| Uptime | Tracks service availability | A 99.9% uptime still allows for 8.76 hours of downtime per year | 99.99% or higher for critical applications |
| User Activity | Analyzes user behavior and usage patterns | Informs product development and UX improvements | Varies by application |
| Business Impact | Measures conversion rates and user engagement | Directly ties to business outcomes | Industry-specific |
| Security Events | Monitors security-related incidents | Critical for maintaining data integrity | Zero tolerance for breaches |
By tracking all of these metrics comprehensively, organizations can:
This combination of Golden Signals and additional critical metrics provides a holistic view of your SaaS application's health, performance, and business impact. An optimal SaaS observability solution should be able to track, analyze, and visualize all of the key metrics that are most important for your specific business needs.
The landscape of SaaS monitoring tools is vast and varied, with numerous solutions offering a wide array of features. To effectively monitor your SaaS ecosystem, it's crucial to understand the key features that can make a significant difference in maintaining optimal performance. Let's explore the essential features any comprehensive SaaS monitoring tool should offer, along with practical examples of how these features can be implemented using OpenObserve.
While real-time alerting helps you respond to immediate issues, comprehensive performance metrics tracking provides the data needed for long-term trend analysis, capacity planning, and continuous improvement.
Essential components include but are not limited to:
Application Performance Monitoring (APM) should be a key feature of any SaaS monitoring solution. Look for an observability solution that offers comprehensive APM features that allow you to easily monitor key performance metrics for any stack, at any scale, and build meaningful monitoring dashboards that facilitate educated business decisions.
In the fast-paced world of SaaS applications, real-time monitoring and alerting form the cornerstone of effective management. This feature enables IT teams to stay ahead of potential problems and maintain high levels of service quality.
Key features include:
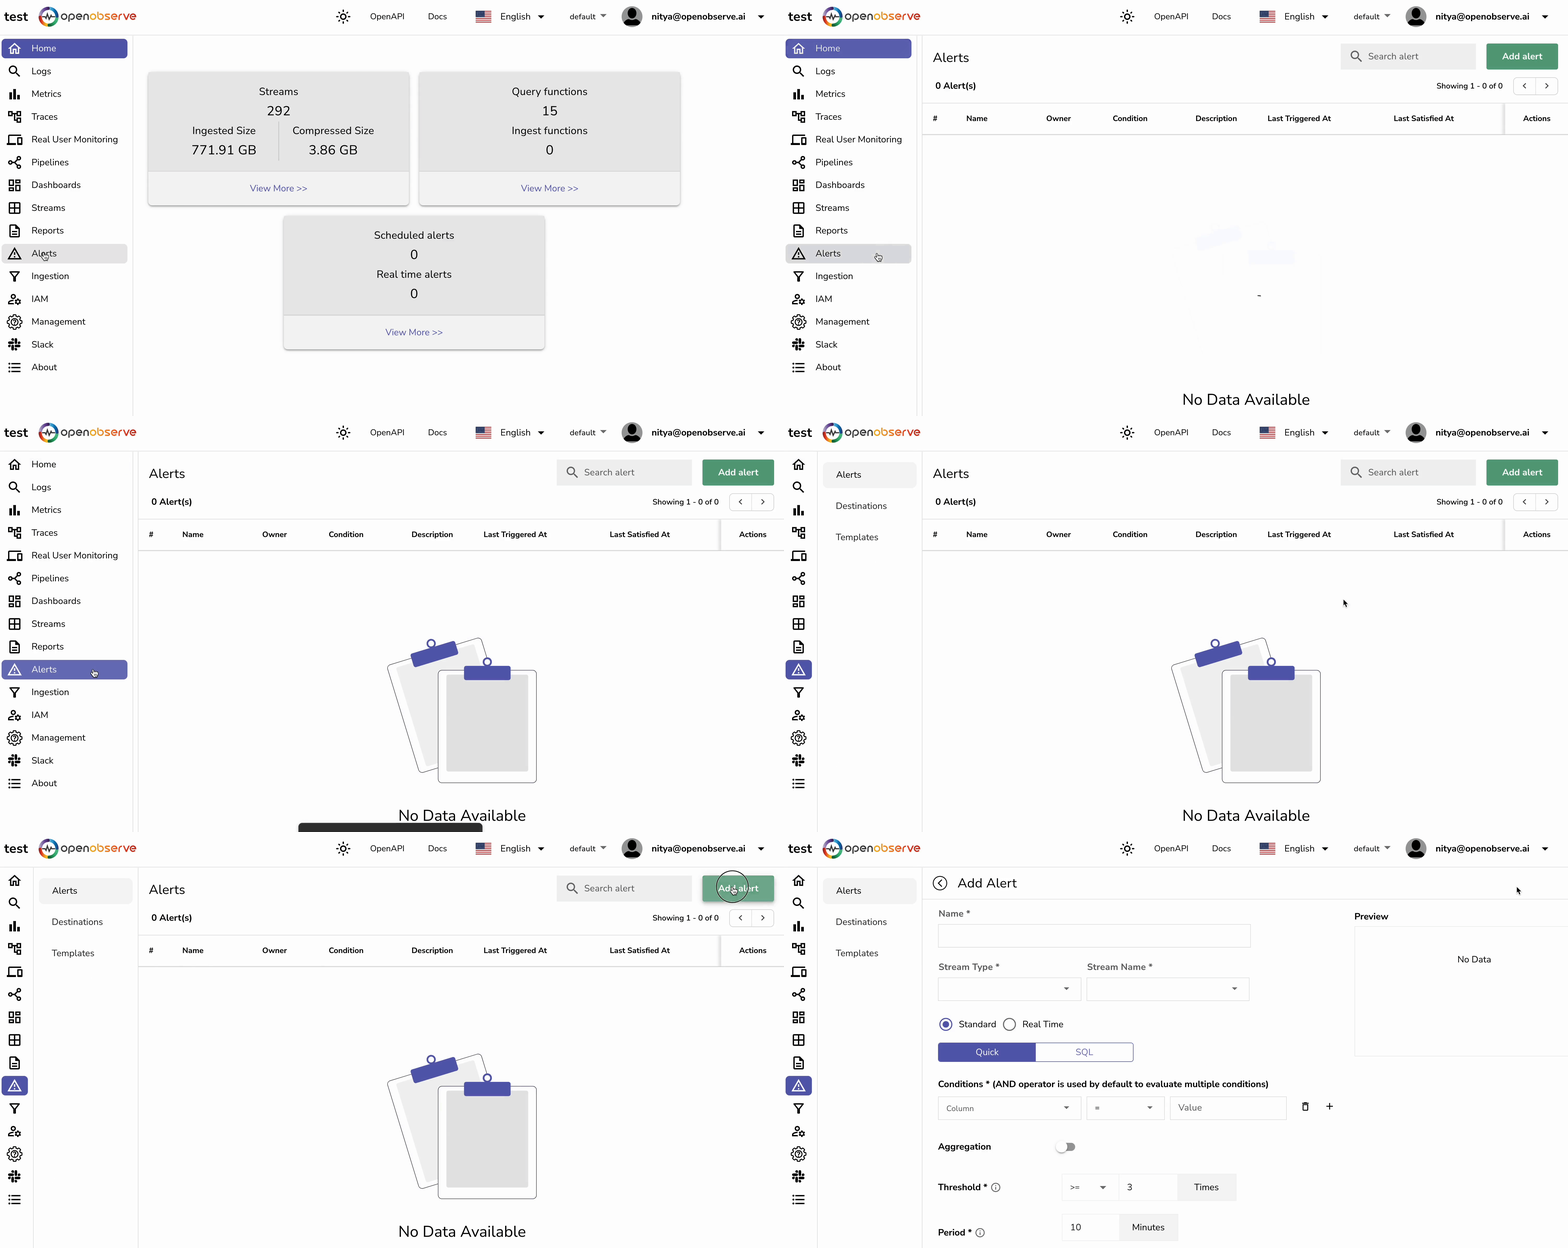
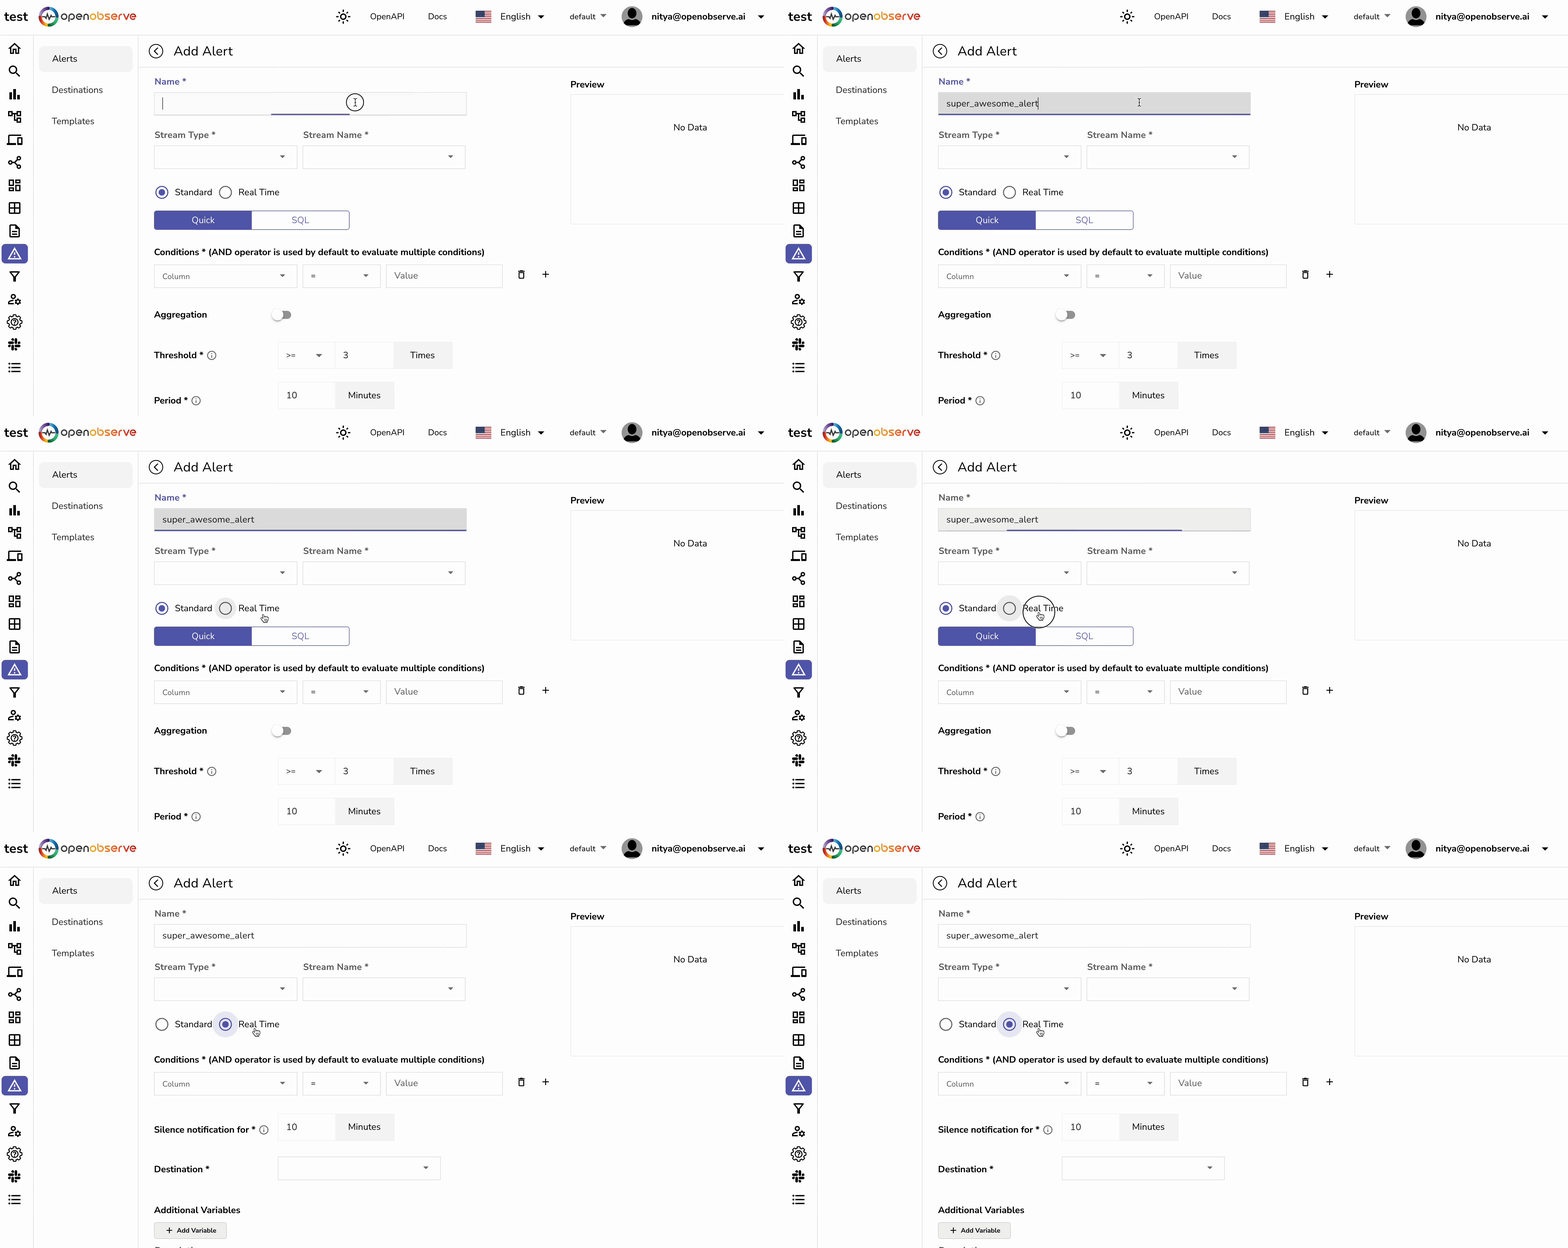
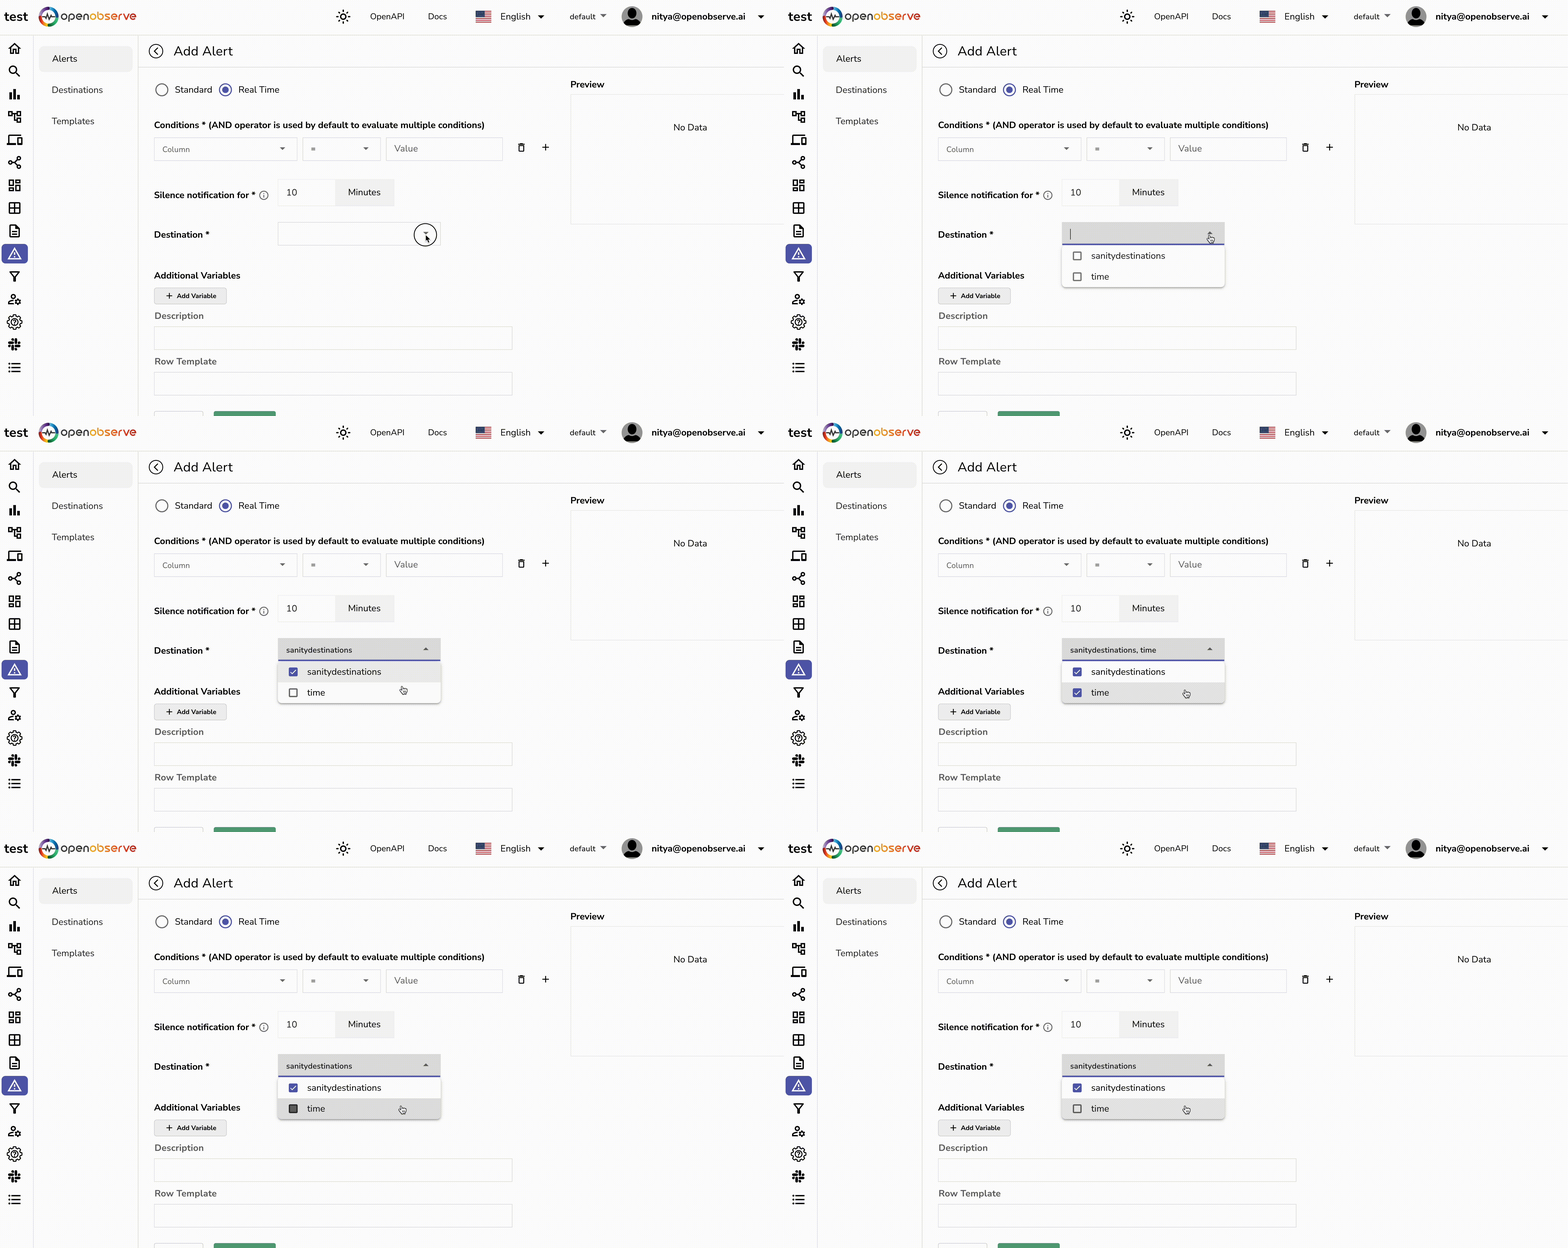
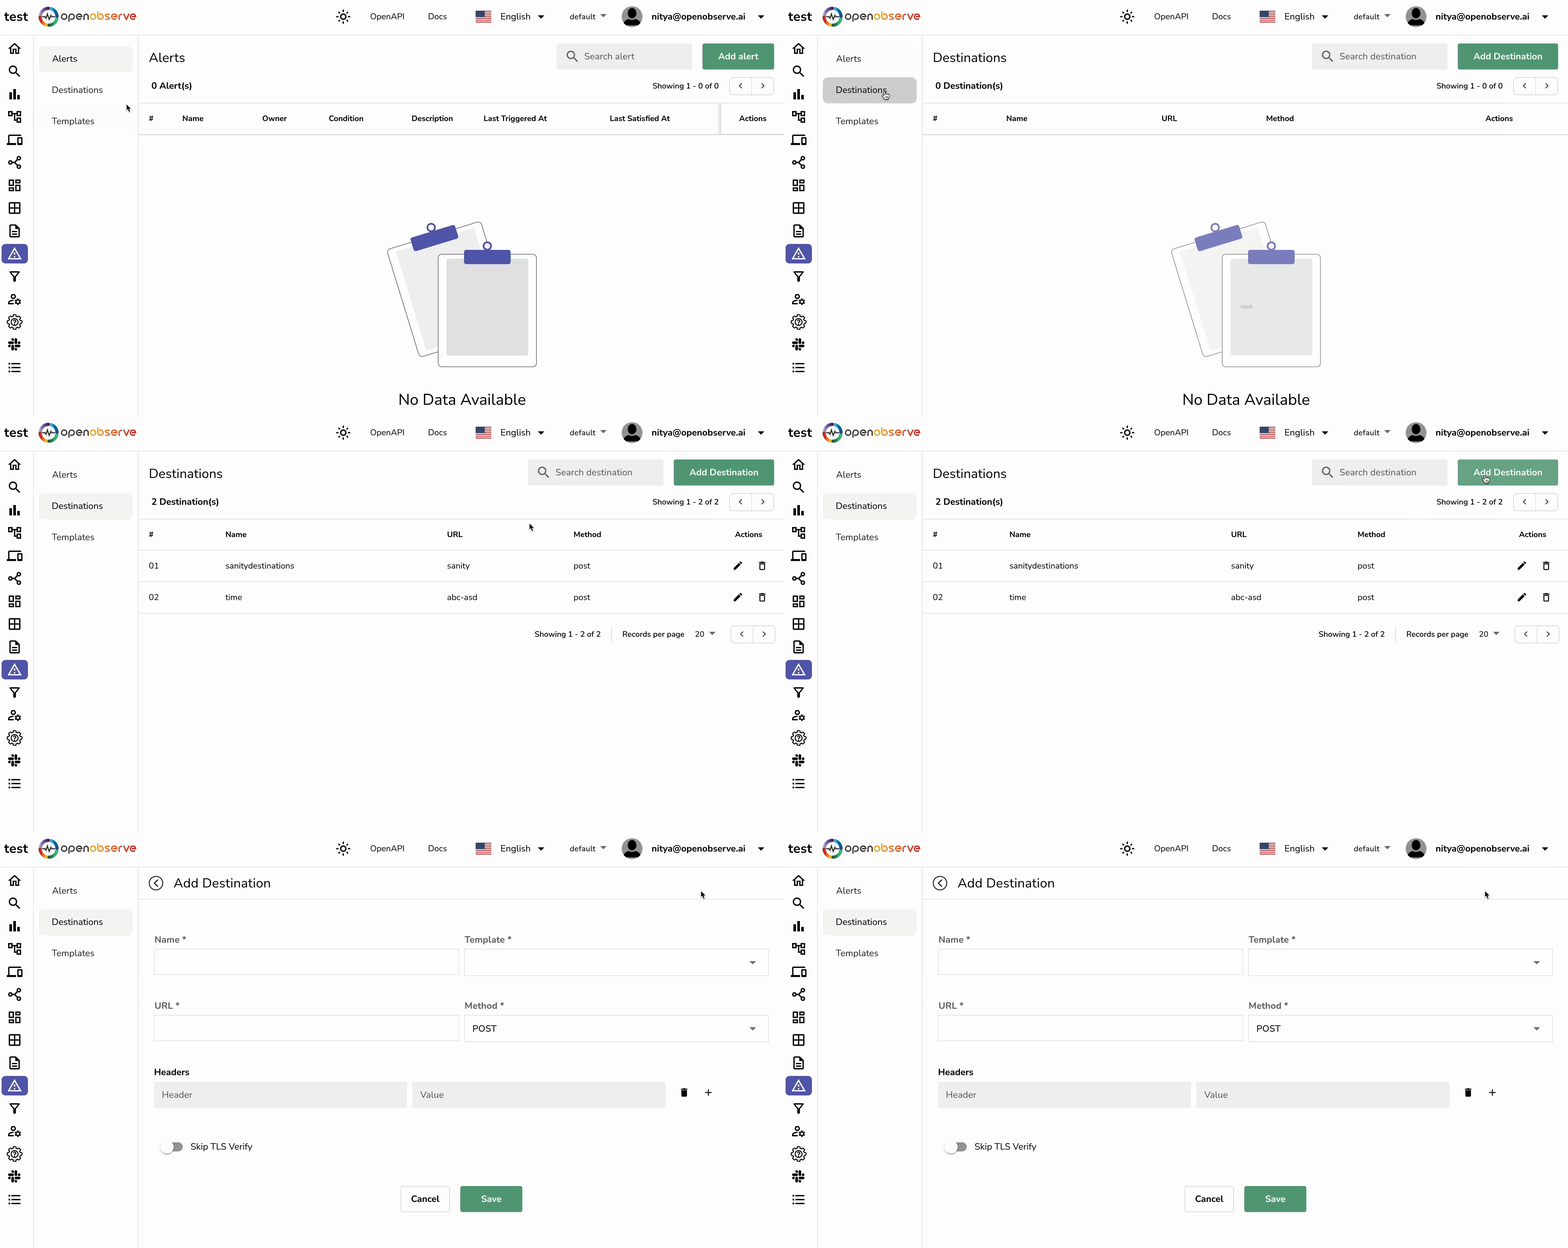
Here is an example of how you might set up a scheduled or real-time alert (using OpenObserve in this case):
Step 1: After logging in to the OpenObserve dashboard, navigate to “Alerts” (on the left hand side) and click on “Add alert” to set up a new customized alert:
Step 2: Add alert details and specify any rules:
Step 3: Set a destination, or multiple destinations:
You can easily add additional Destinations or create your own Templates to further simplify the process of dispatching alerts:
The right monitoring solution should give you real-time visibility into the behavior of your users and provide timely alerts.
User experience monitoring bridges the gap between technical performance and business outcomes by providing insights into how end-users interact with the application. This feature is crucial for ensuring that your SaaS applications not only perform well technically but also meet user expectations.
Key components include:
OpenObserve offers extensive user experience monitoring capabilities, including a robust Real User Monitoring (RUM) toolkit to track, analyze, and visualize real-time user interactions and performance metrics. By enabling RUM, you can gain a thorough understanding of the user experience on the frontend of any SaaS application.
While SaaS applications often abstract away infrastructure concerns, monitoring underlying resources remains crucial for optimal performance, especially for organizations running their own SaaS platforms or those with hybrid cloud environments.
Essential features include:
OpenObserve not only supports the comprehensive monitoring of infrastructure and cloud resources, but also provides valuable insights that can result in 140x lower storage costs (compared to other observability solutions) and 10x lower overall costs.
The optimal SaaS monitoring solution should not only offer insights on the current performance of your system but also promote continuous improvement and sustainability.
Effective log management is critical for troubleshooting and maintaining security. A robust log management and analysis feature set can significantly reduce the time it takes to identify and resolve issues.
Key features include:
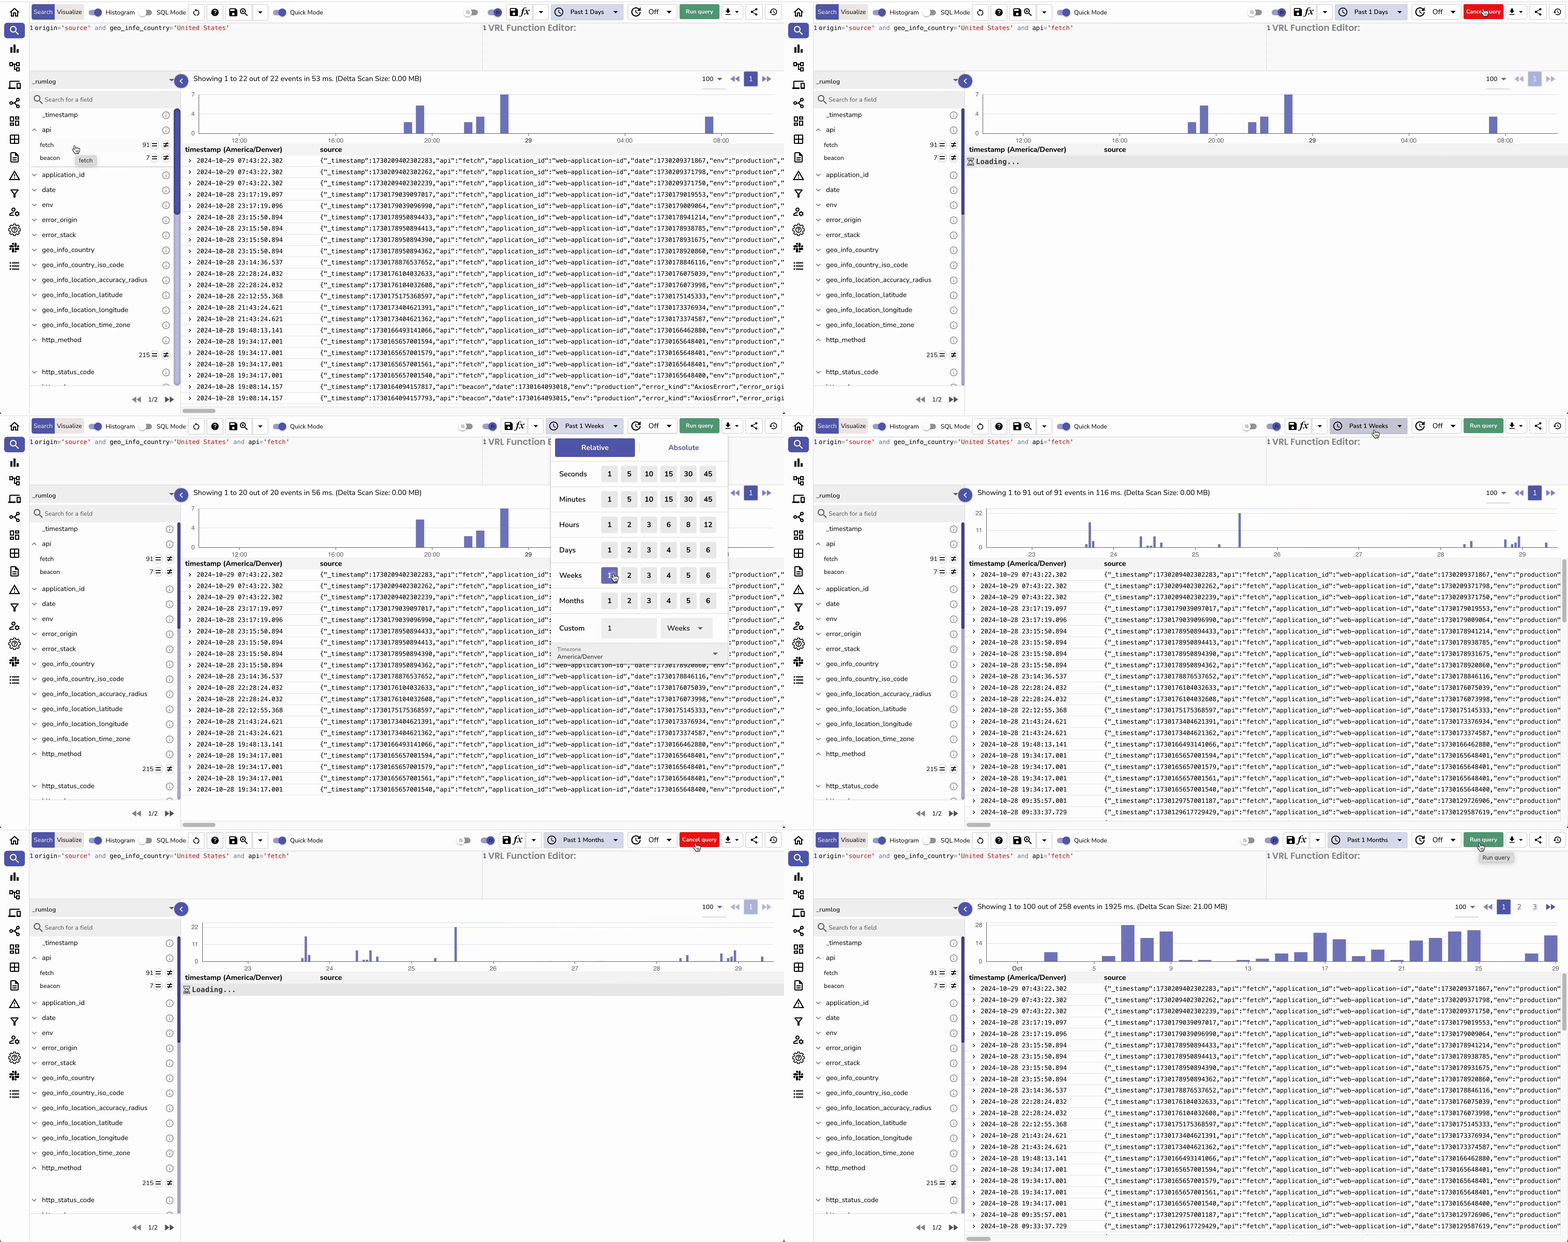
OpenObserve makes it extremely easy to manage and analyze logs, as well as correlate logs with traces and metrics using consistent metadata. Correlating data across your entire application provides 360-degree visibility into your entire application ecosystem.
To maximize value, your monitoring solution should seamlessly integrate with your existing tools and workflows. Customization and integration capabilities ensure that your monitoring solution can adapt to your specific needs and evolve with your organization.
Essential features include:
OpenObserve offers extensive integration capabilities with major cloud providers and popular systems:
Cloud Platform Integrations:
System Log Integration and Analysis:
These integrations, combined with OpenObserve's customizable dashboards and robust API access, provide a comprehensive monitoring solution that adapts to your specific infrastructure and workflows. Whether you're running applications on major cloud platforms or managing on-premises systems, OpenObserve offers the flexibility and integration capabilities needed for effective SaaS monitoring.
Choosing the right SaaS monitoring solution is crucial for ensuring optimal performance, user satisfaction, and business success. By understanding key features, implementing best practices, and considering ROI, you can make an informed decision that aligns with your organization's specific needs.
Remember, the ideal solution should offer comprehensive visibility, scalability, and integration capabilities while being user-friendly and cost-effective. As you evaluate your options, consider how these factors apply to your unique SaaS ecosystem:
Whether you're just starting your SaaS monitoring journey or looking to enhance your current approach, taking these steps will help you make an informed decision and set your organization up for success.
For more information on SaaS monitoring best practices or to explore how OpenObserve can address your specific needs, visit our FAQs page or contact our team for a personalized discussion.