Explore latest insights and updates
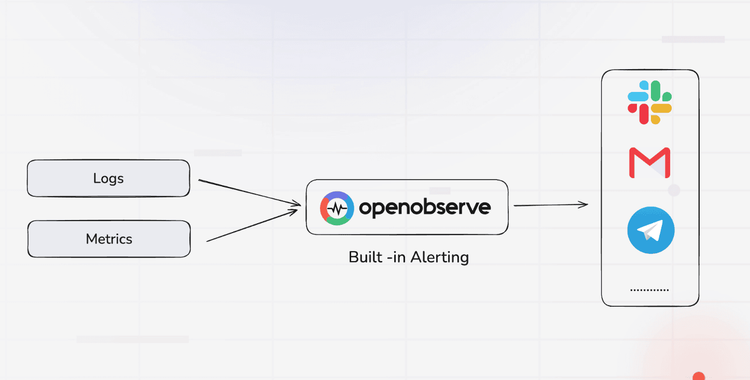
Simplify Prometheus Alertmanager setups with OpenObserve -unified alerts for metrics, logs, and traces, no YAML required.
Learn how OpenObserve reduces Mean Time to Detect and Mean Time to Resolve through intelligent alert correlation, deduplication, and automated incident creation. Cut through alert fatigue with SLO-based prioritization and Actions automation.
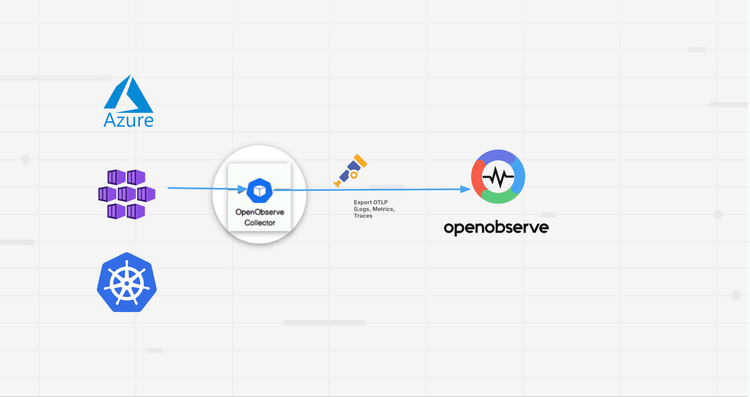
Learn how to set up comprehensive AKS monitoring with OpenObserve. Deploy the OpenObserve Collector to capture logs, metrics, and traces from your Azure Kubernetes clusters. Get unified observability with significant cost savings compared to Azure Log Analytics.
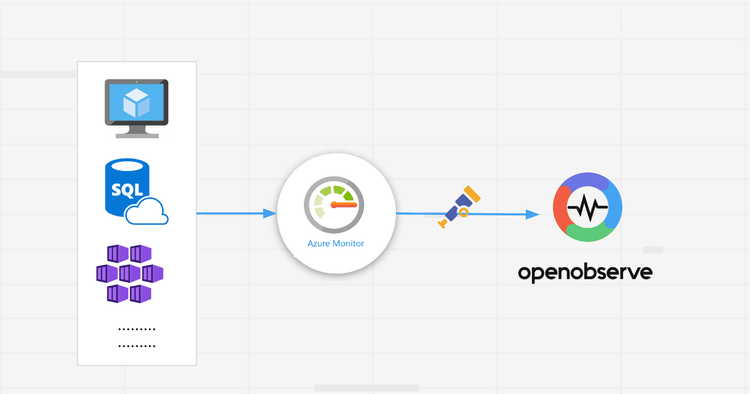
Collect and export Azure Monitor metrics to OpenObserve using the OpenTelemetry Collector. Build real-time dashboards, query metrics, and set up SQL-based alerts for Azure VMs, AKS, and other resources.
A clear, developer-focused guide to Prometheus metric types, when to use each one, and how OpenObserve enhances Prometheus by solving retention, scalability, and correlation limitations.
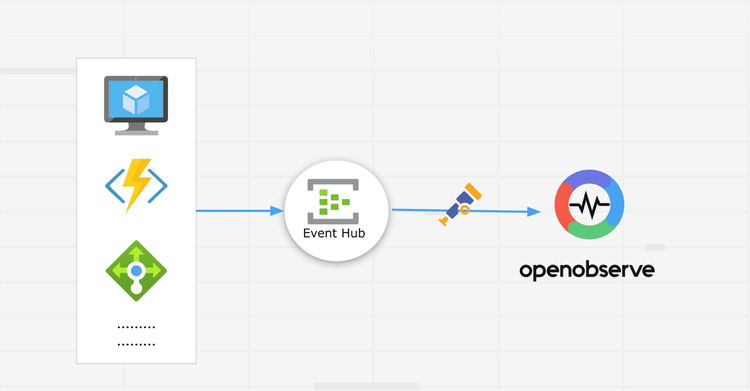
Monitor Azure VMs, databases, storage, and networking with a single pipeline using Event Hub → OTel Collector → OpenObserve. Simplify logging & metrics.
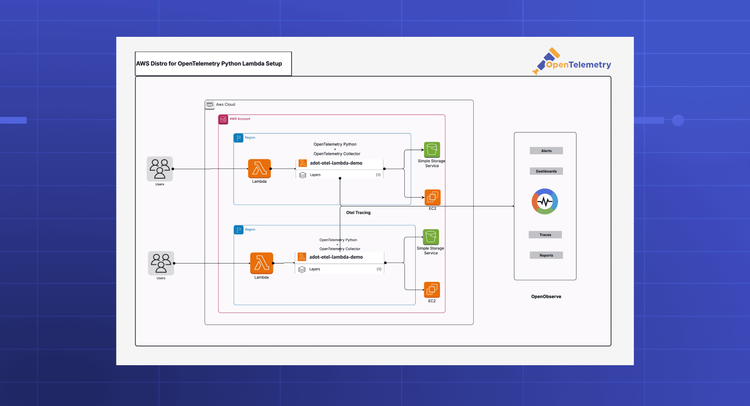
Learn how to implement distributed tracing for AWS Lambda using the AWS Distro for OpenTelemetry (ADOT) layer. This step-by-step guide shows you how to automatically capture traces from AWS SDK calls and send them to OpenObserve without writing any instrumentation code. Get full visibility into your serverless applications with open standards.
Learn how to integrate ServiceNow with OpenObserve to automatically create incidents from alerts. Step-by-step guide covering webhook integration and openobserve actions with deduplication support.
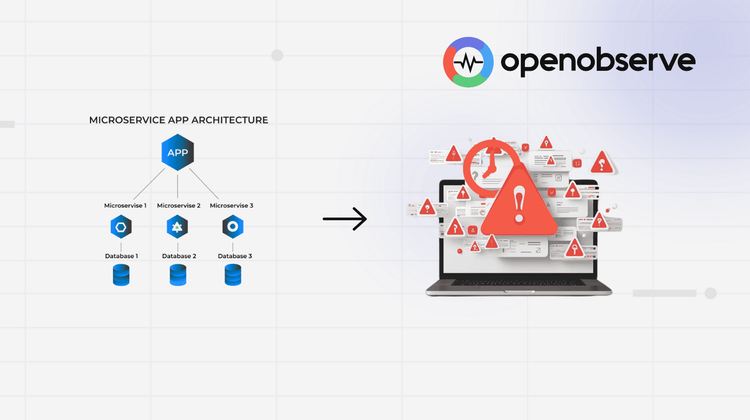
Discover how full-stack observability helps teams correlate telemetry across systems to cut MTTR, reduce data costs, and improve performance.
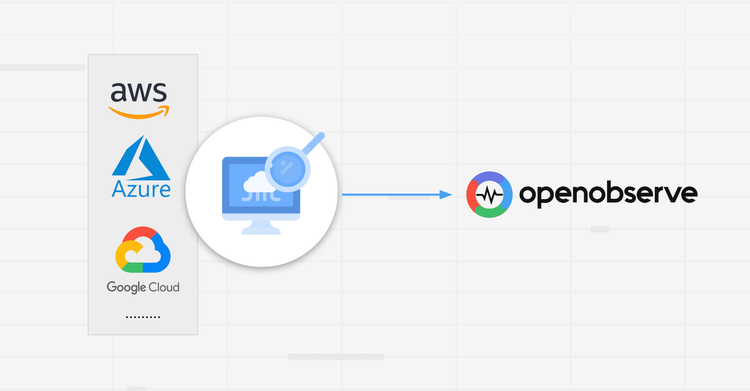
Discover how to monitor cloud resources effectively. Use OpenObserve to analyze logs, metrics, and traces for better visibility, alerts, and performance.
OpenObserve v0.16.1 delivers meaningful new features including Alert History for debugging monitoring reliability, Pipeline History for execution tracking, and automatic Log Pattern extraction that groups millions of logs into actionable insights. This release brings significant performance improvements with optimized indexing and query execution, alongside UI/UX refinements that enhance readability and usability across the platform. Teams can now better understand their system behavior, reduce alert fatigue through deduplication, and troubleshoot issues faster with comprehensive execution history and diagnostics.
Learn how to scale observability systems to handle Black Friday-level traffic without losing visibility. Discover best practices for ingestion tuning, query optimization, and resilience using OpenObserve.
Explore how OpenObserve’s Sensitive Data Redaction protects PII in observability pipelines. Configure regex-based rules to redact, hash, or drop sensitive data at ingestion or query time for full GDPR and HIPAA compliance.
Monitor NVIDIA H100, H200, and A100 GPUs with DCGM Exporter and OpenObserve. Complete setup guide with dashboards, alerts, and 89% cost savings vs traditional tools.
An observability customer story showcasing how a brick-and-mortar and e-commerce fashion brand consolidated observability tools while drastically reducing their TCO.
Learn how to deploy OpenObserve on DigitalOcean with Kubernetes, Spaces, and managed PostgreSQL. Complete production-ready setup guide with Helm configuration.
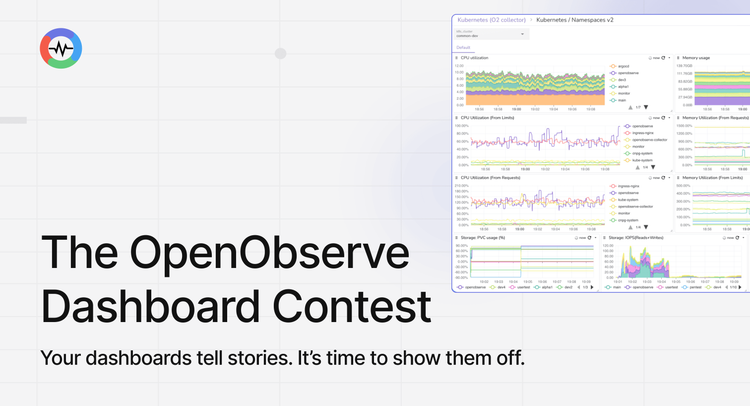
Join the OpenObserve Dashboard Contest and show off your best dashboards. Share your build on LinkedIn with #BuiltWithOpenObserve and #DashboardDrop for a chance to win $300, exclusive swag, and a feature on the OpenObserve blog. Entries close November 21, 2025.
Learn how to add complete observability to your microservices for distributed tracing without changing a single line of code. This hands-on demo shows auto-instrumentation across Go, Node.js, Java, Python, and .NET using OpenTelemetry and OpenObserve.
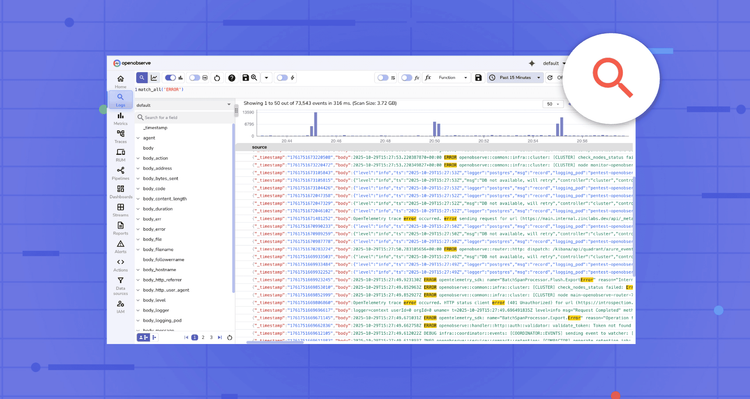
Search, filter, and analyze logs efficiently to uncover insights faster. Explore advanced log search techniques, query filters, and best practices for managing large-scale log data
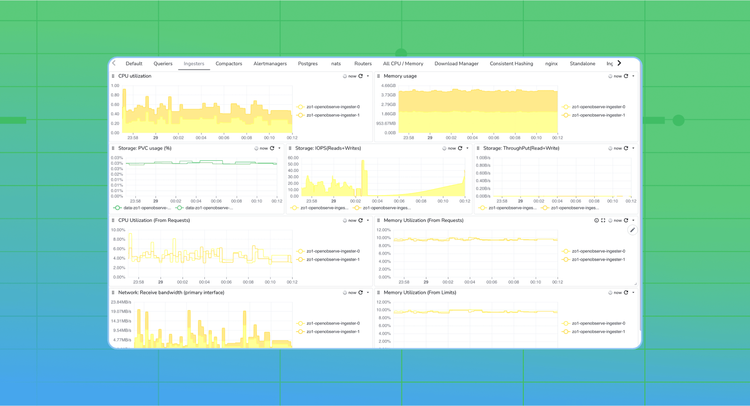
Learn how to effectively monitor your OpenObserve deployment, starting from system health metrics like CPU, memory, and network usage, to OpenObserve’s own internal metrics exposed in Prometheus format. This guide walks through best practices, setup steps, and configuration examples.
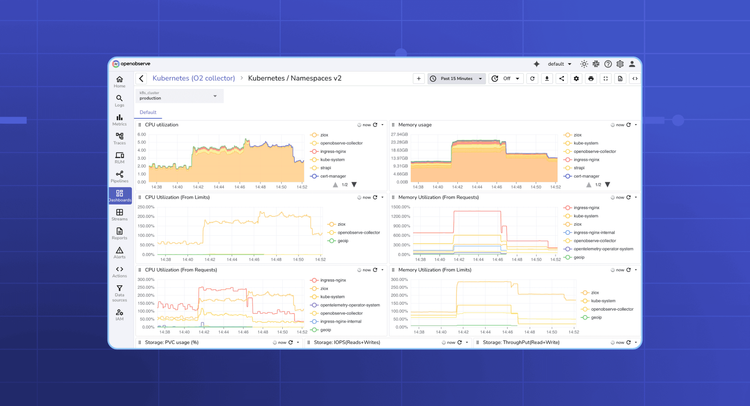
Import OpenObserve’s prebuilt Kubernetes dashboards for end-to-end visibility, trend analysis, and proactive alerts across clusters.