Major Product Update: AI Assistant, LLM Observability & v0.70.0 ( March 2026)

Manas Sharma
March 16, 2026
5 min read
Don’t forget to share!
Try OpenObserve Cloud today for more efficient and performant observability.
March is a big month for OpenObserve. The AI Assistant and LLM Observability are now live in public preview on O2 Cloud — bringing intelligent, context-aware assistance and first-class LLM monitoring directly into your observability workflow. Alongside that, v0.70.0 lands with one of the most feature-dense releases to date: a rebuilt Service Graph, a visual query builder for logs, panel-level time ranges, a new Incident Event Timeline, and much more. Here's what's new.
The Assistant is an intelligent AI assistant deeply integrated with the OpenObserve observability platform. It enhances user productivity, streamlines troubleshooting, and accelerates insights from your log, metric, and trace data.
Fast Q&A Get instant answers about any OpenObserve data, component, or best practice — without leaving the platform.
End-to-End Traceability Query, correlate, and diagnose issues across all telemetry types — logs, metrics, and traces — from a single conversation thread.
Create Resources on the Fly Using MCP tooling available for OpenObserve, generate dashboards, panels, visuals, and alert conditions from a single prompt in seconds.
NLP for SQL, PromQL, and VRL Describe what you want in plain language. The assistant translates it into SQL queries, PromQL expressions, or VRL transformation scripts — ready to run or refine.
LLM Observability provides purpose-built views for monitoring and understanding LLM application behavior.
Learn more: LLM Observability Documentation
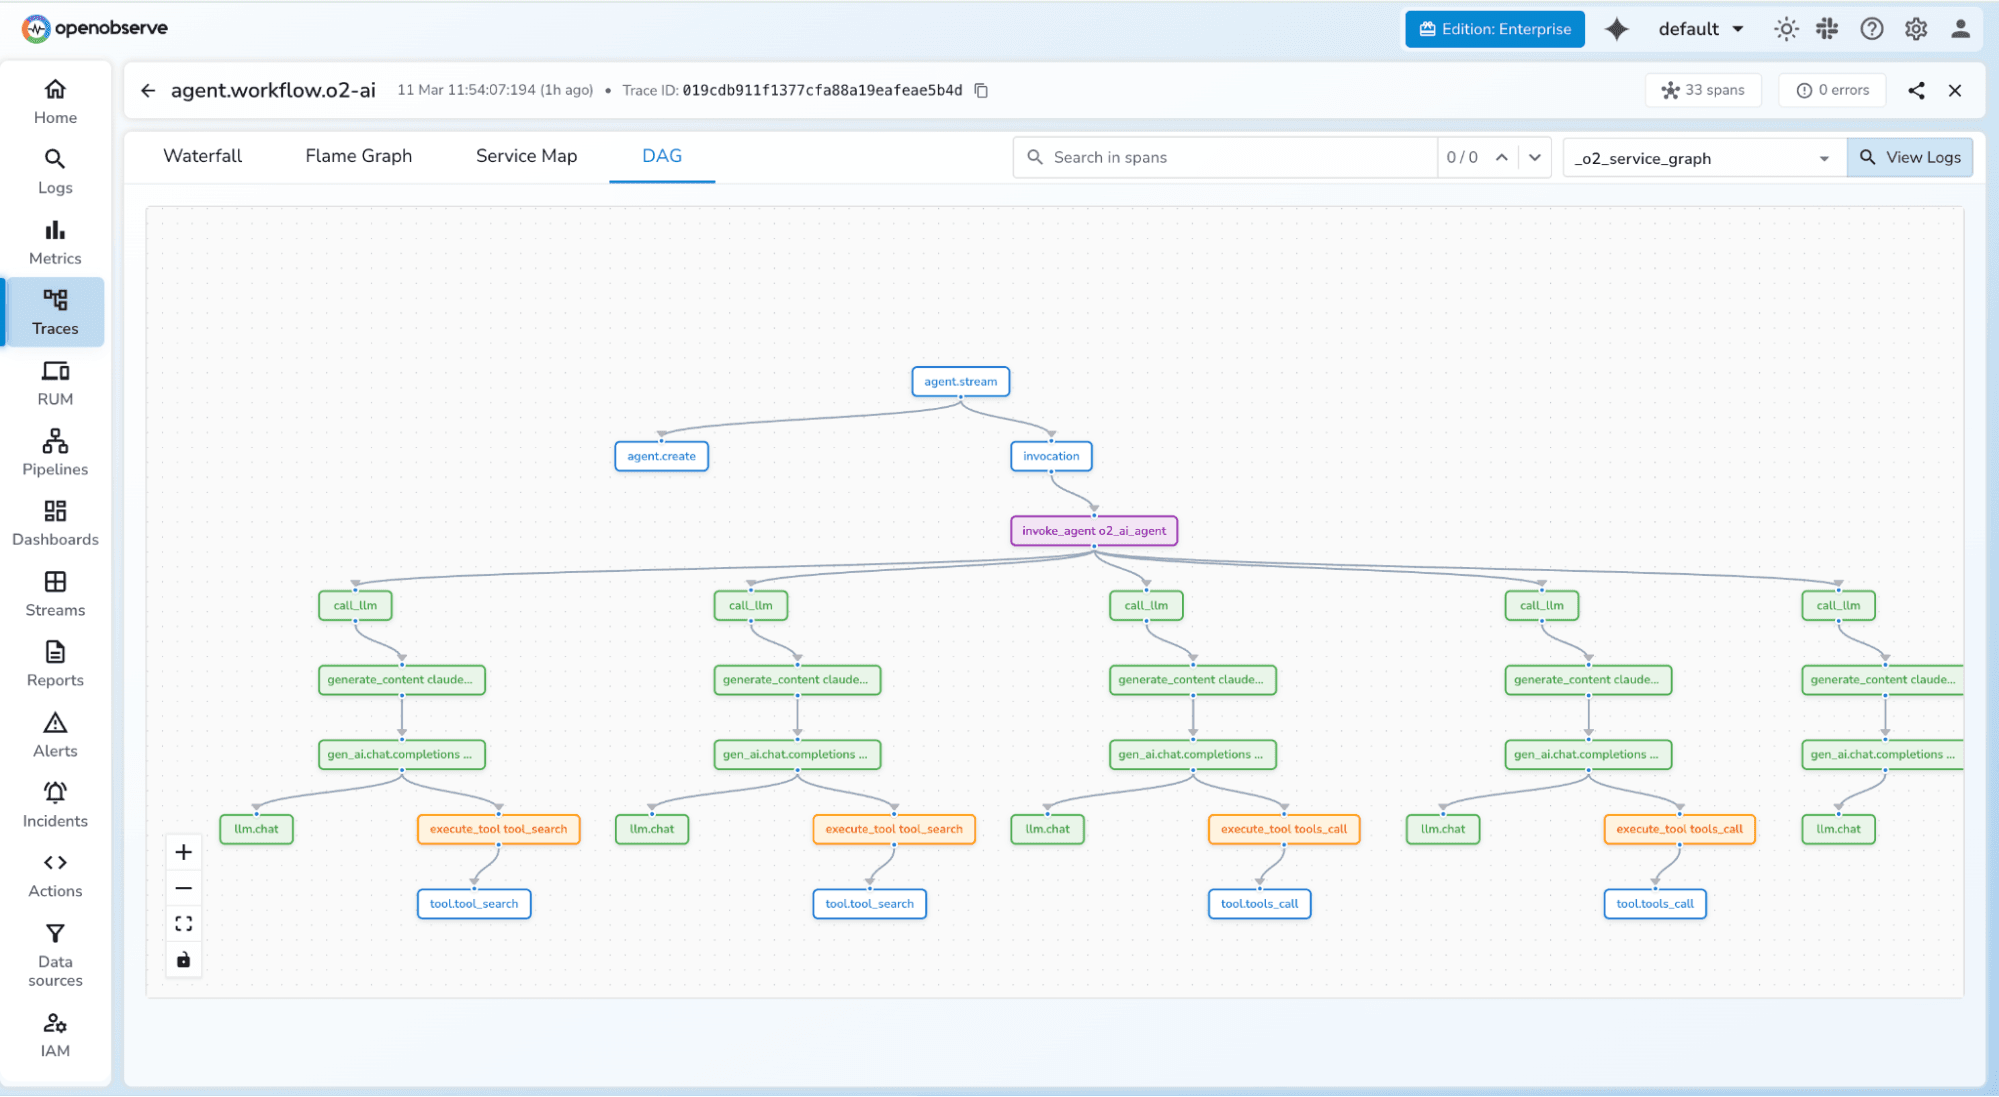
DAG Graph for LLM Traces LLM traces are visualized as directed acyclic graphs, making it straightforward to understand model call chains, tool invocations, and response flows within a single request.
Session View Inspect full LLM sessions with complete context — every turn, tool call, and model response in sequence. Useful for debugging multi-turn conversations and agentic workflows.
User-Level Analytics Track LLM usage by individual user, including request volume, token consumption, and latency patterns. Helps identify heavy users, anomalies, and cost attribution.
The Service Graph has been significantly redesigned in this release.
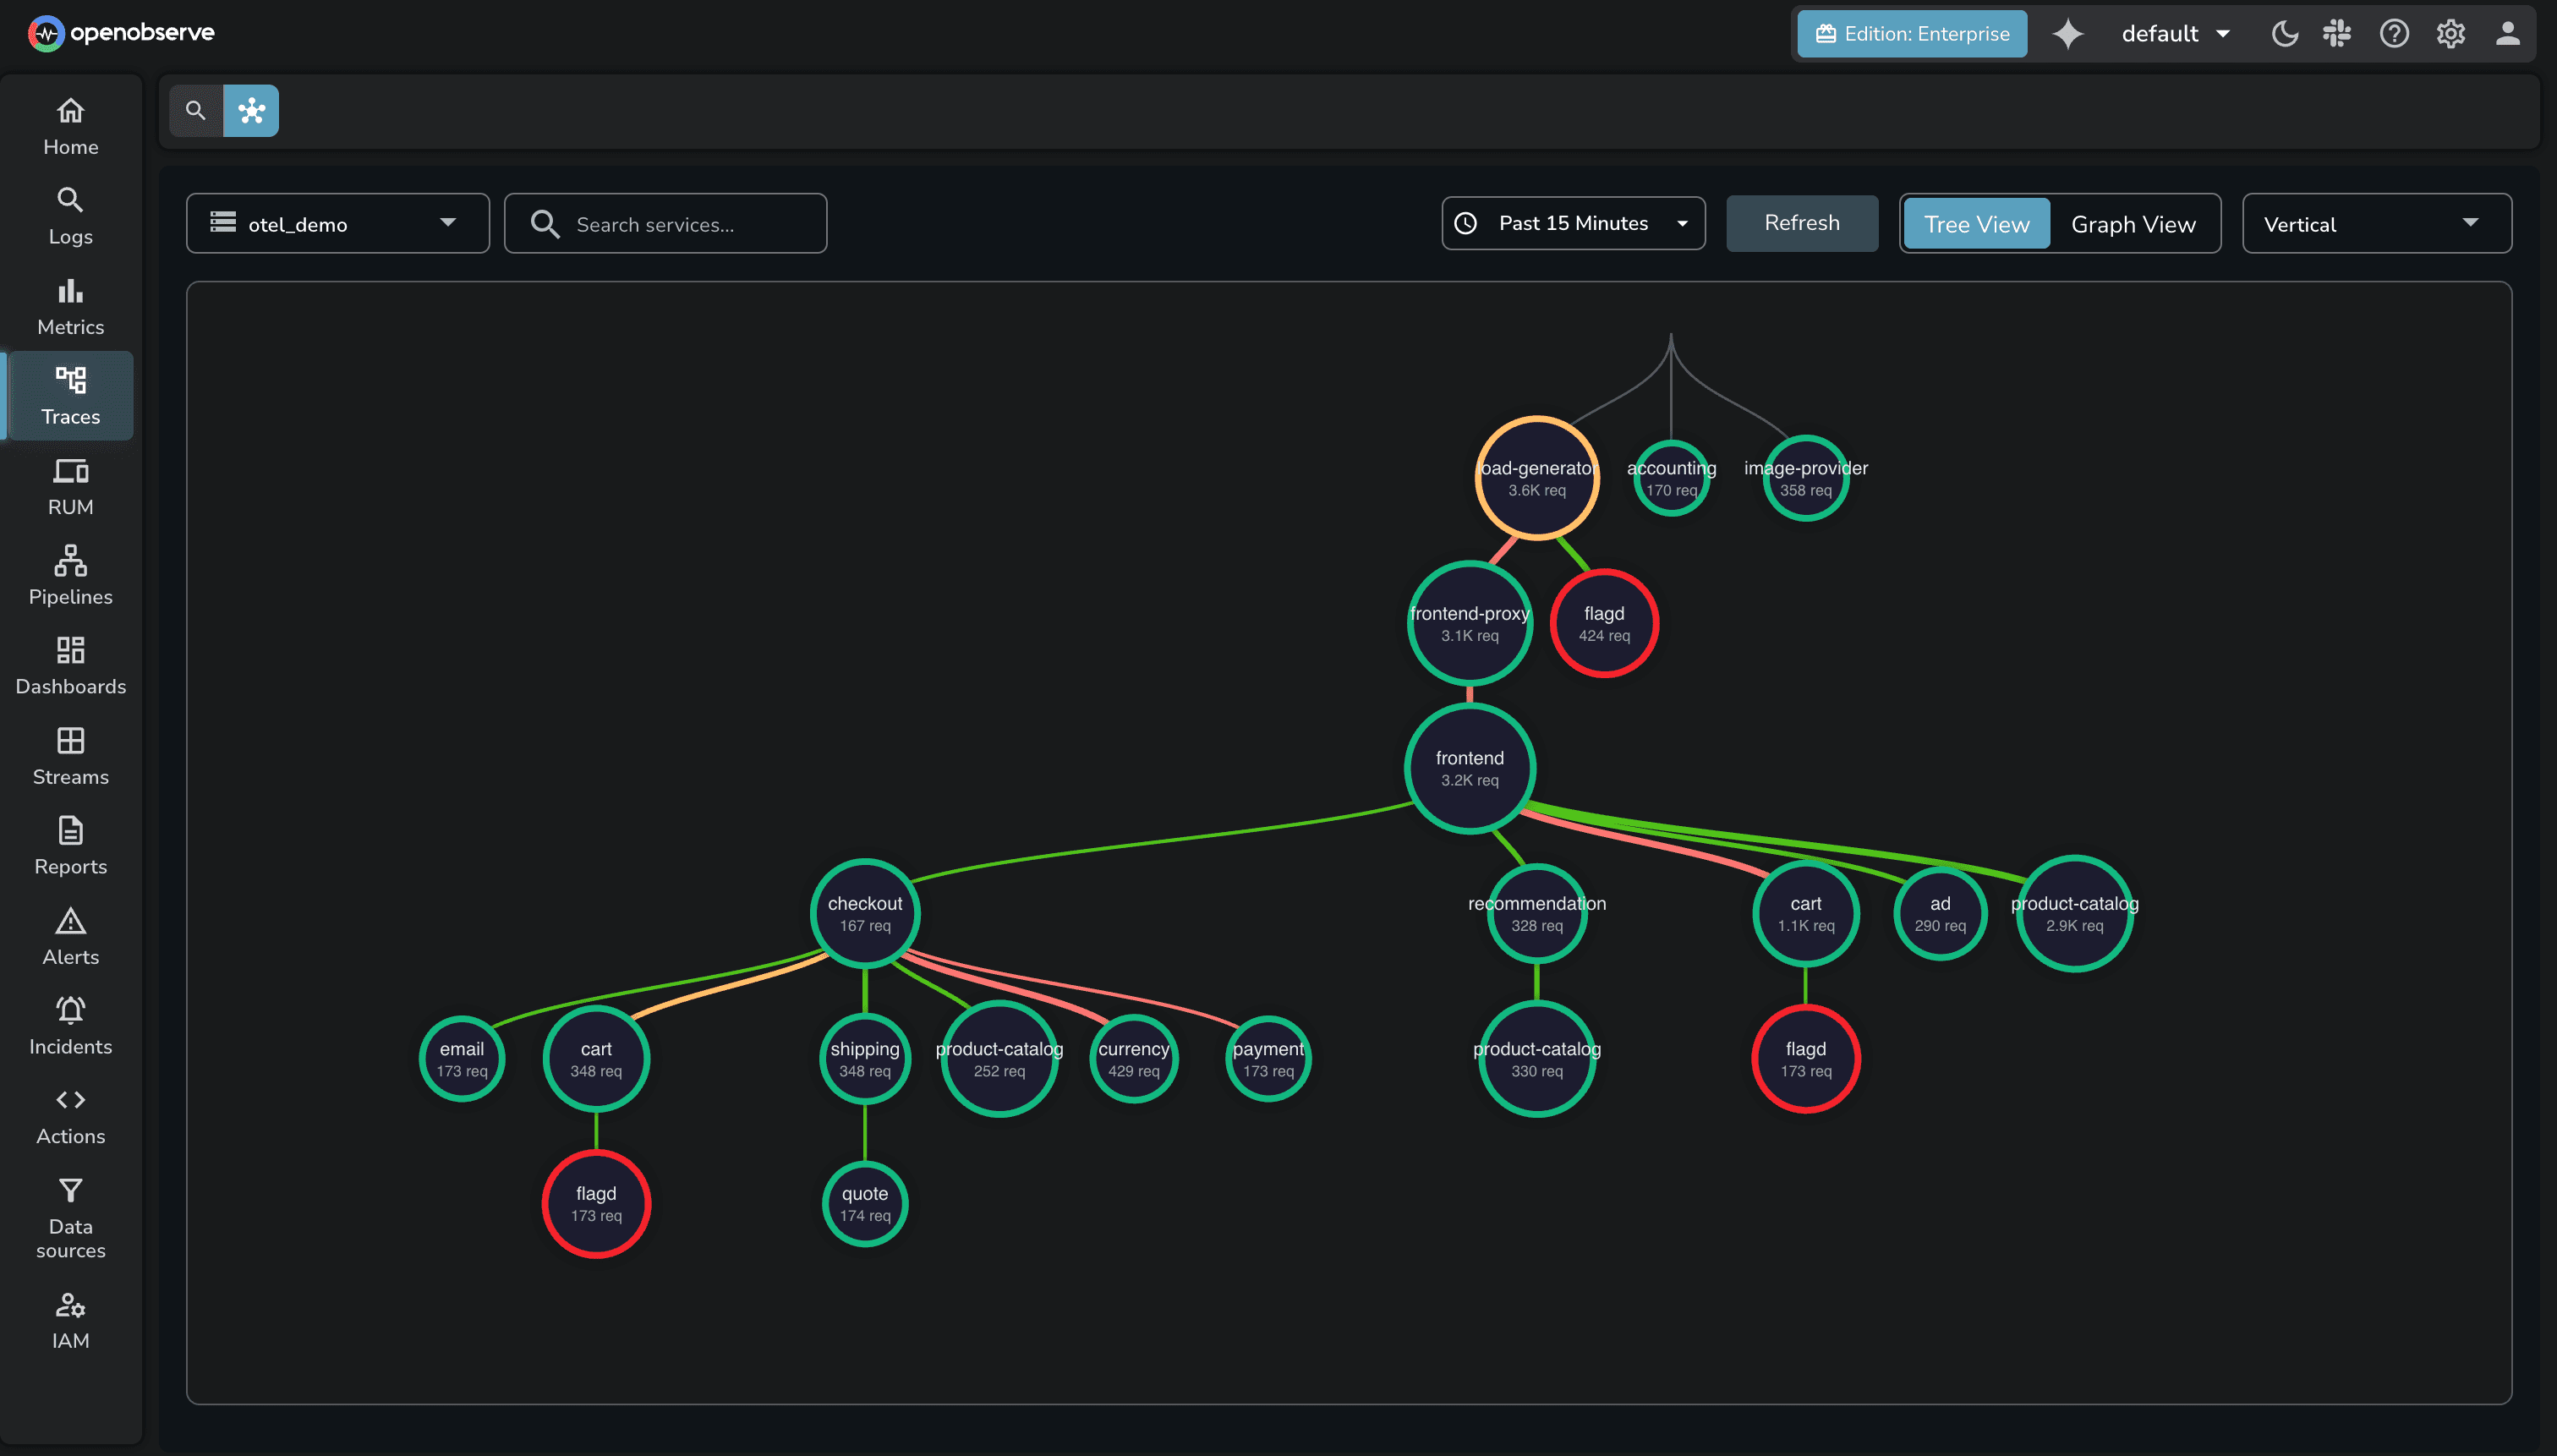
Edge Latency Trend Charts Each edge in the service graph now shows a latency trend chart on hover, giving you a time-series view of inter-service latency without leaving the graph.
Baseline-Driven Edge Coloring Edges are now colored based on how current latency compares to a calculated baseline from the previous time slot. Elevated latency is immediately visible without needing to interpret raw numbers.
Tree View Improvements The tree view now supports telemetry correlation, custom tooltips, inside-node labels, and dynamic node sizing that adjusts based on traffic volume.
Interaction Overhaul The interaction model for the service graph has been redesigned for better usability — cleaner hover states, more responsive tooltips, and reduced visual lag.
A new Activity tab on incident detail pages provides a chronological event timeline for each incident. It captures alert state changes, dimension updates, acknowledgments, and other events in one place.
Alert dimensions are now automatically extracted from query conditions — so when an alert fires, the relevant fields (service name, host, environment, etc.) are already attached to the incident without manual configuration.
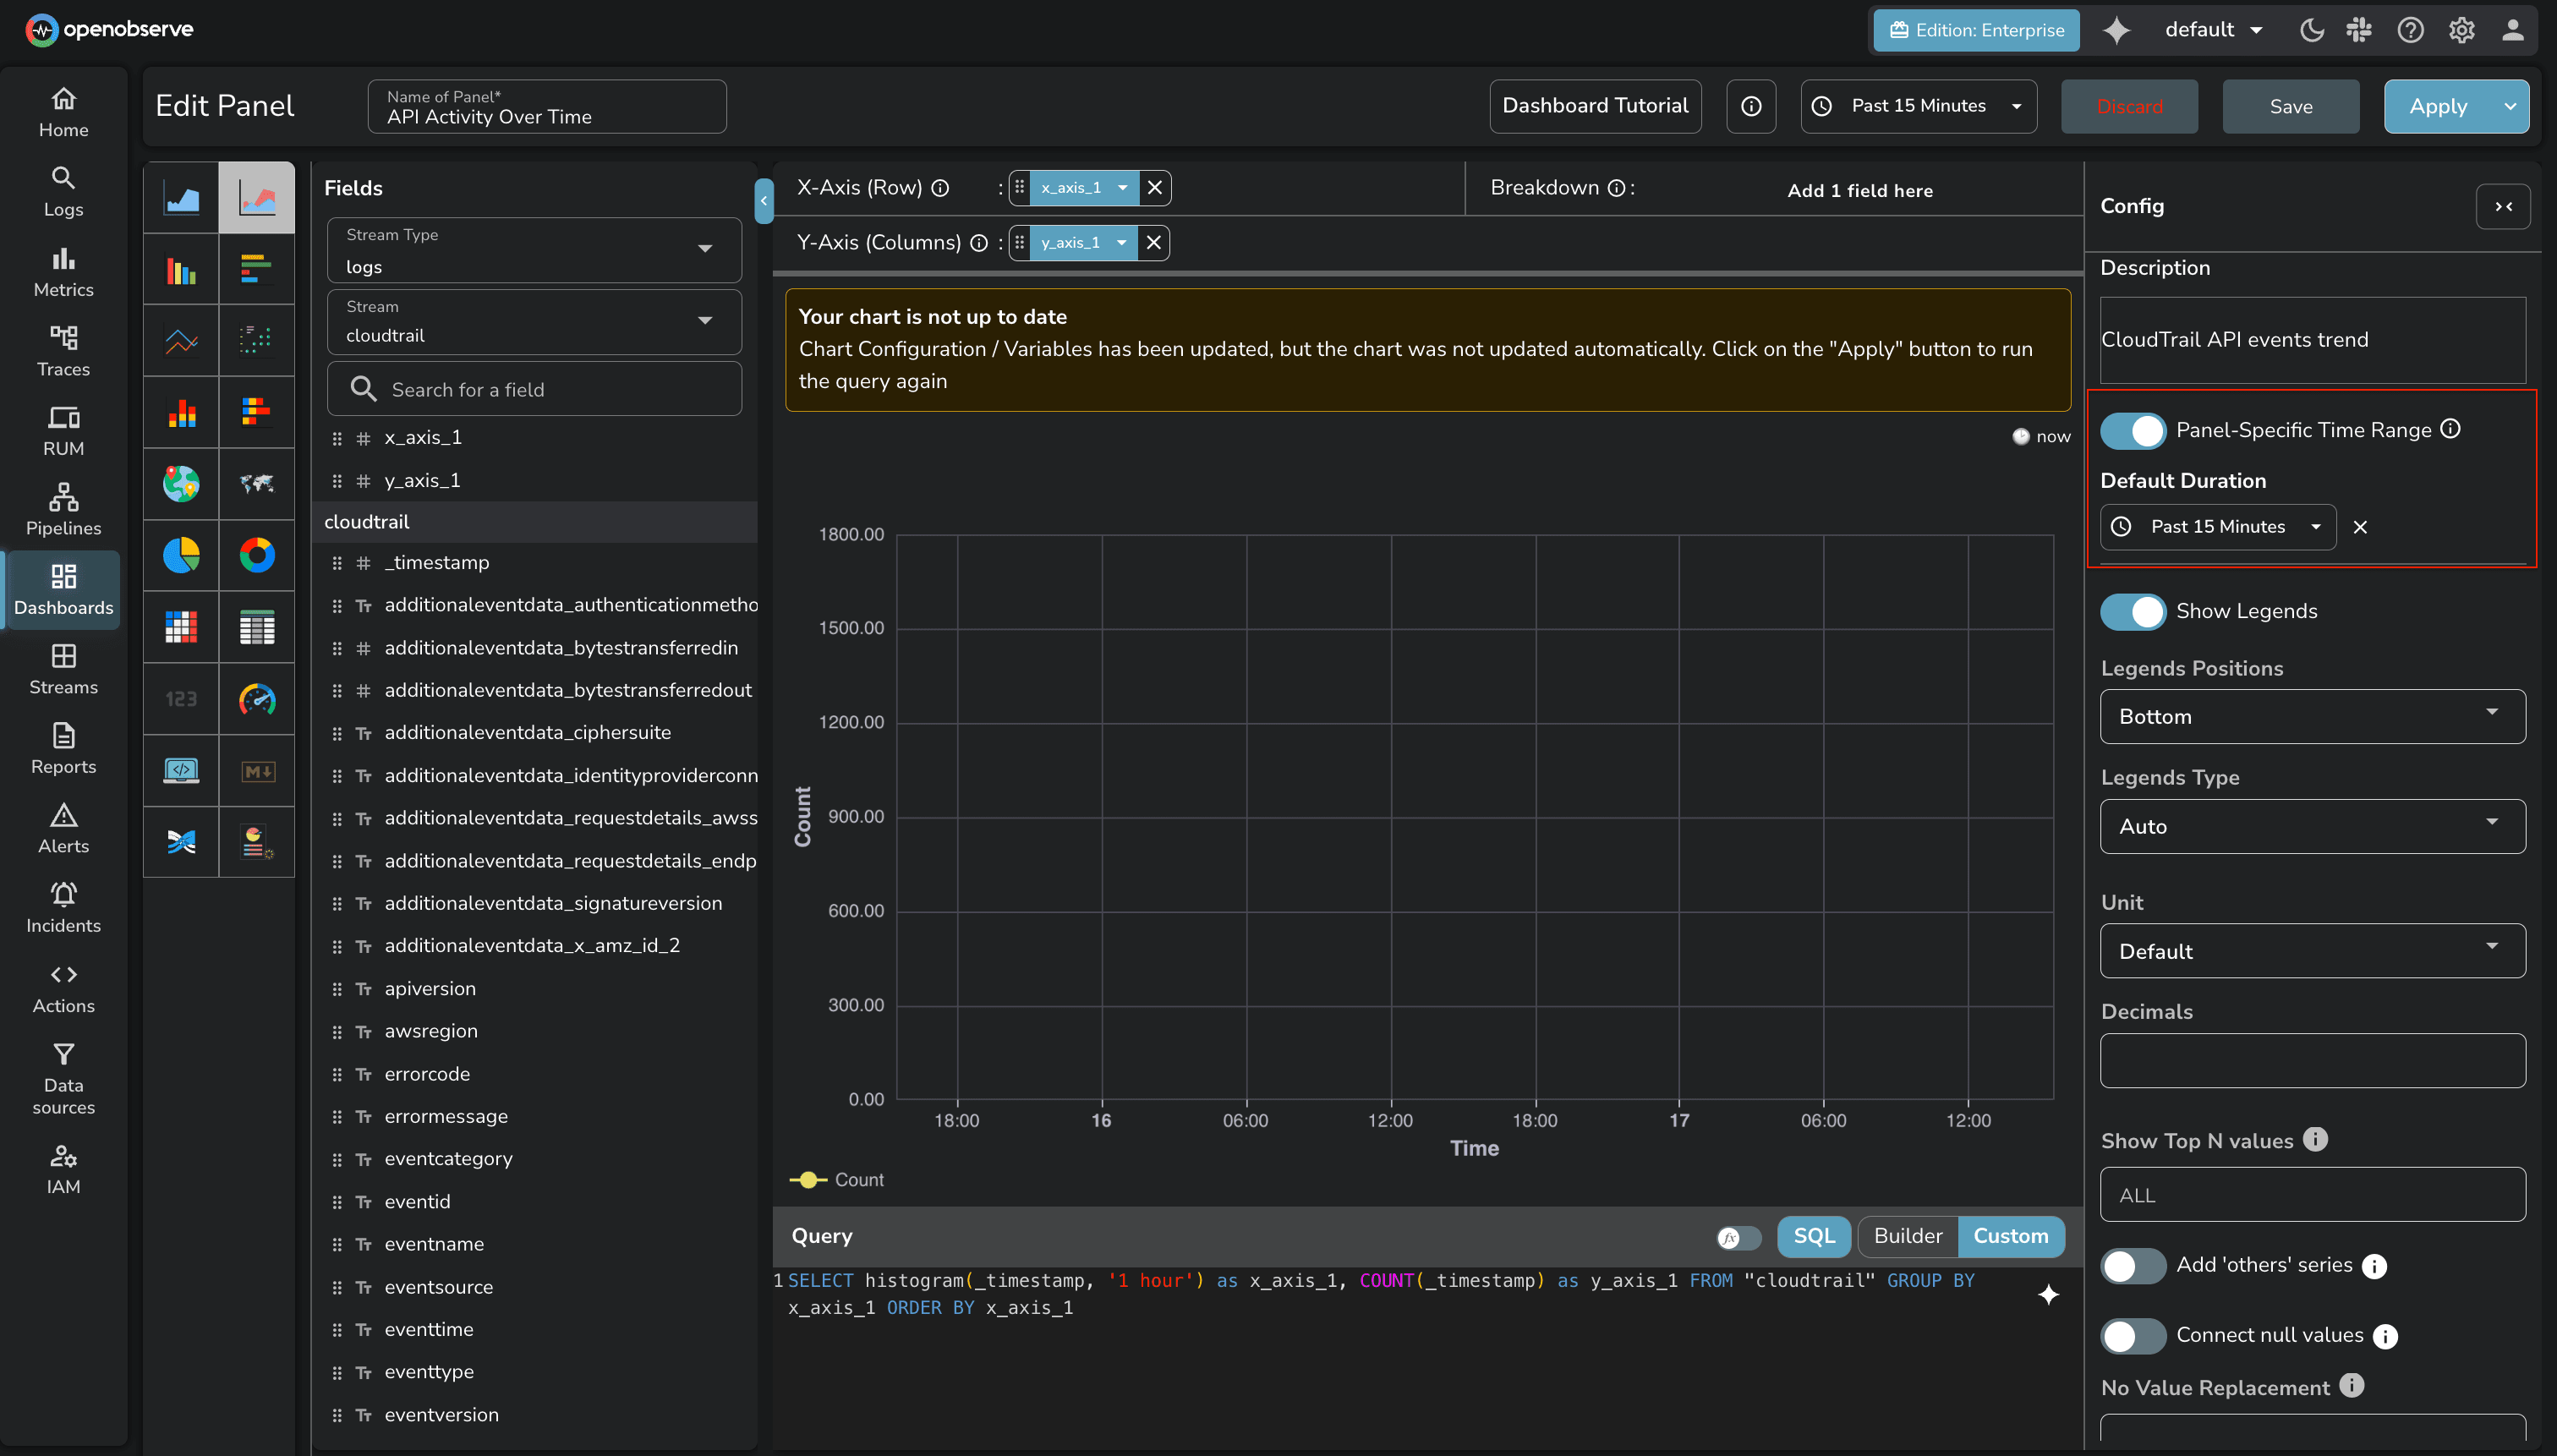
Panel-Level Time Range Individual panels can now have their own time range, independent of the dashboard-level selector. Useful for side-by-side comparisons across different time windows.
Stream and Field Variables Dashboard variables can now drive stream and field selection — not just filter values. This enables more dynamic dashboards where the data source itself changes based on a variable.
Table Chart Pagination Table chart panels now support pagination, making large result sets practical to navigate without truncation.
iFrame Support in HTML Chart Panels Embed external content directly within a dashboard panel using iFrame support in HTML chart panels.
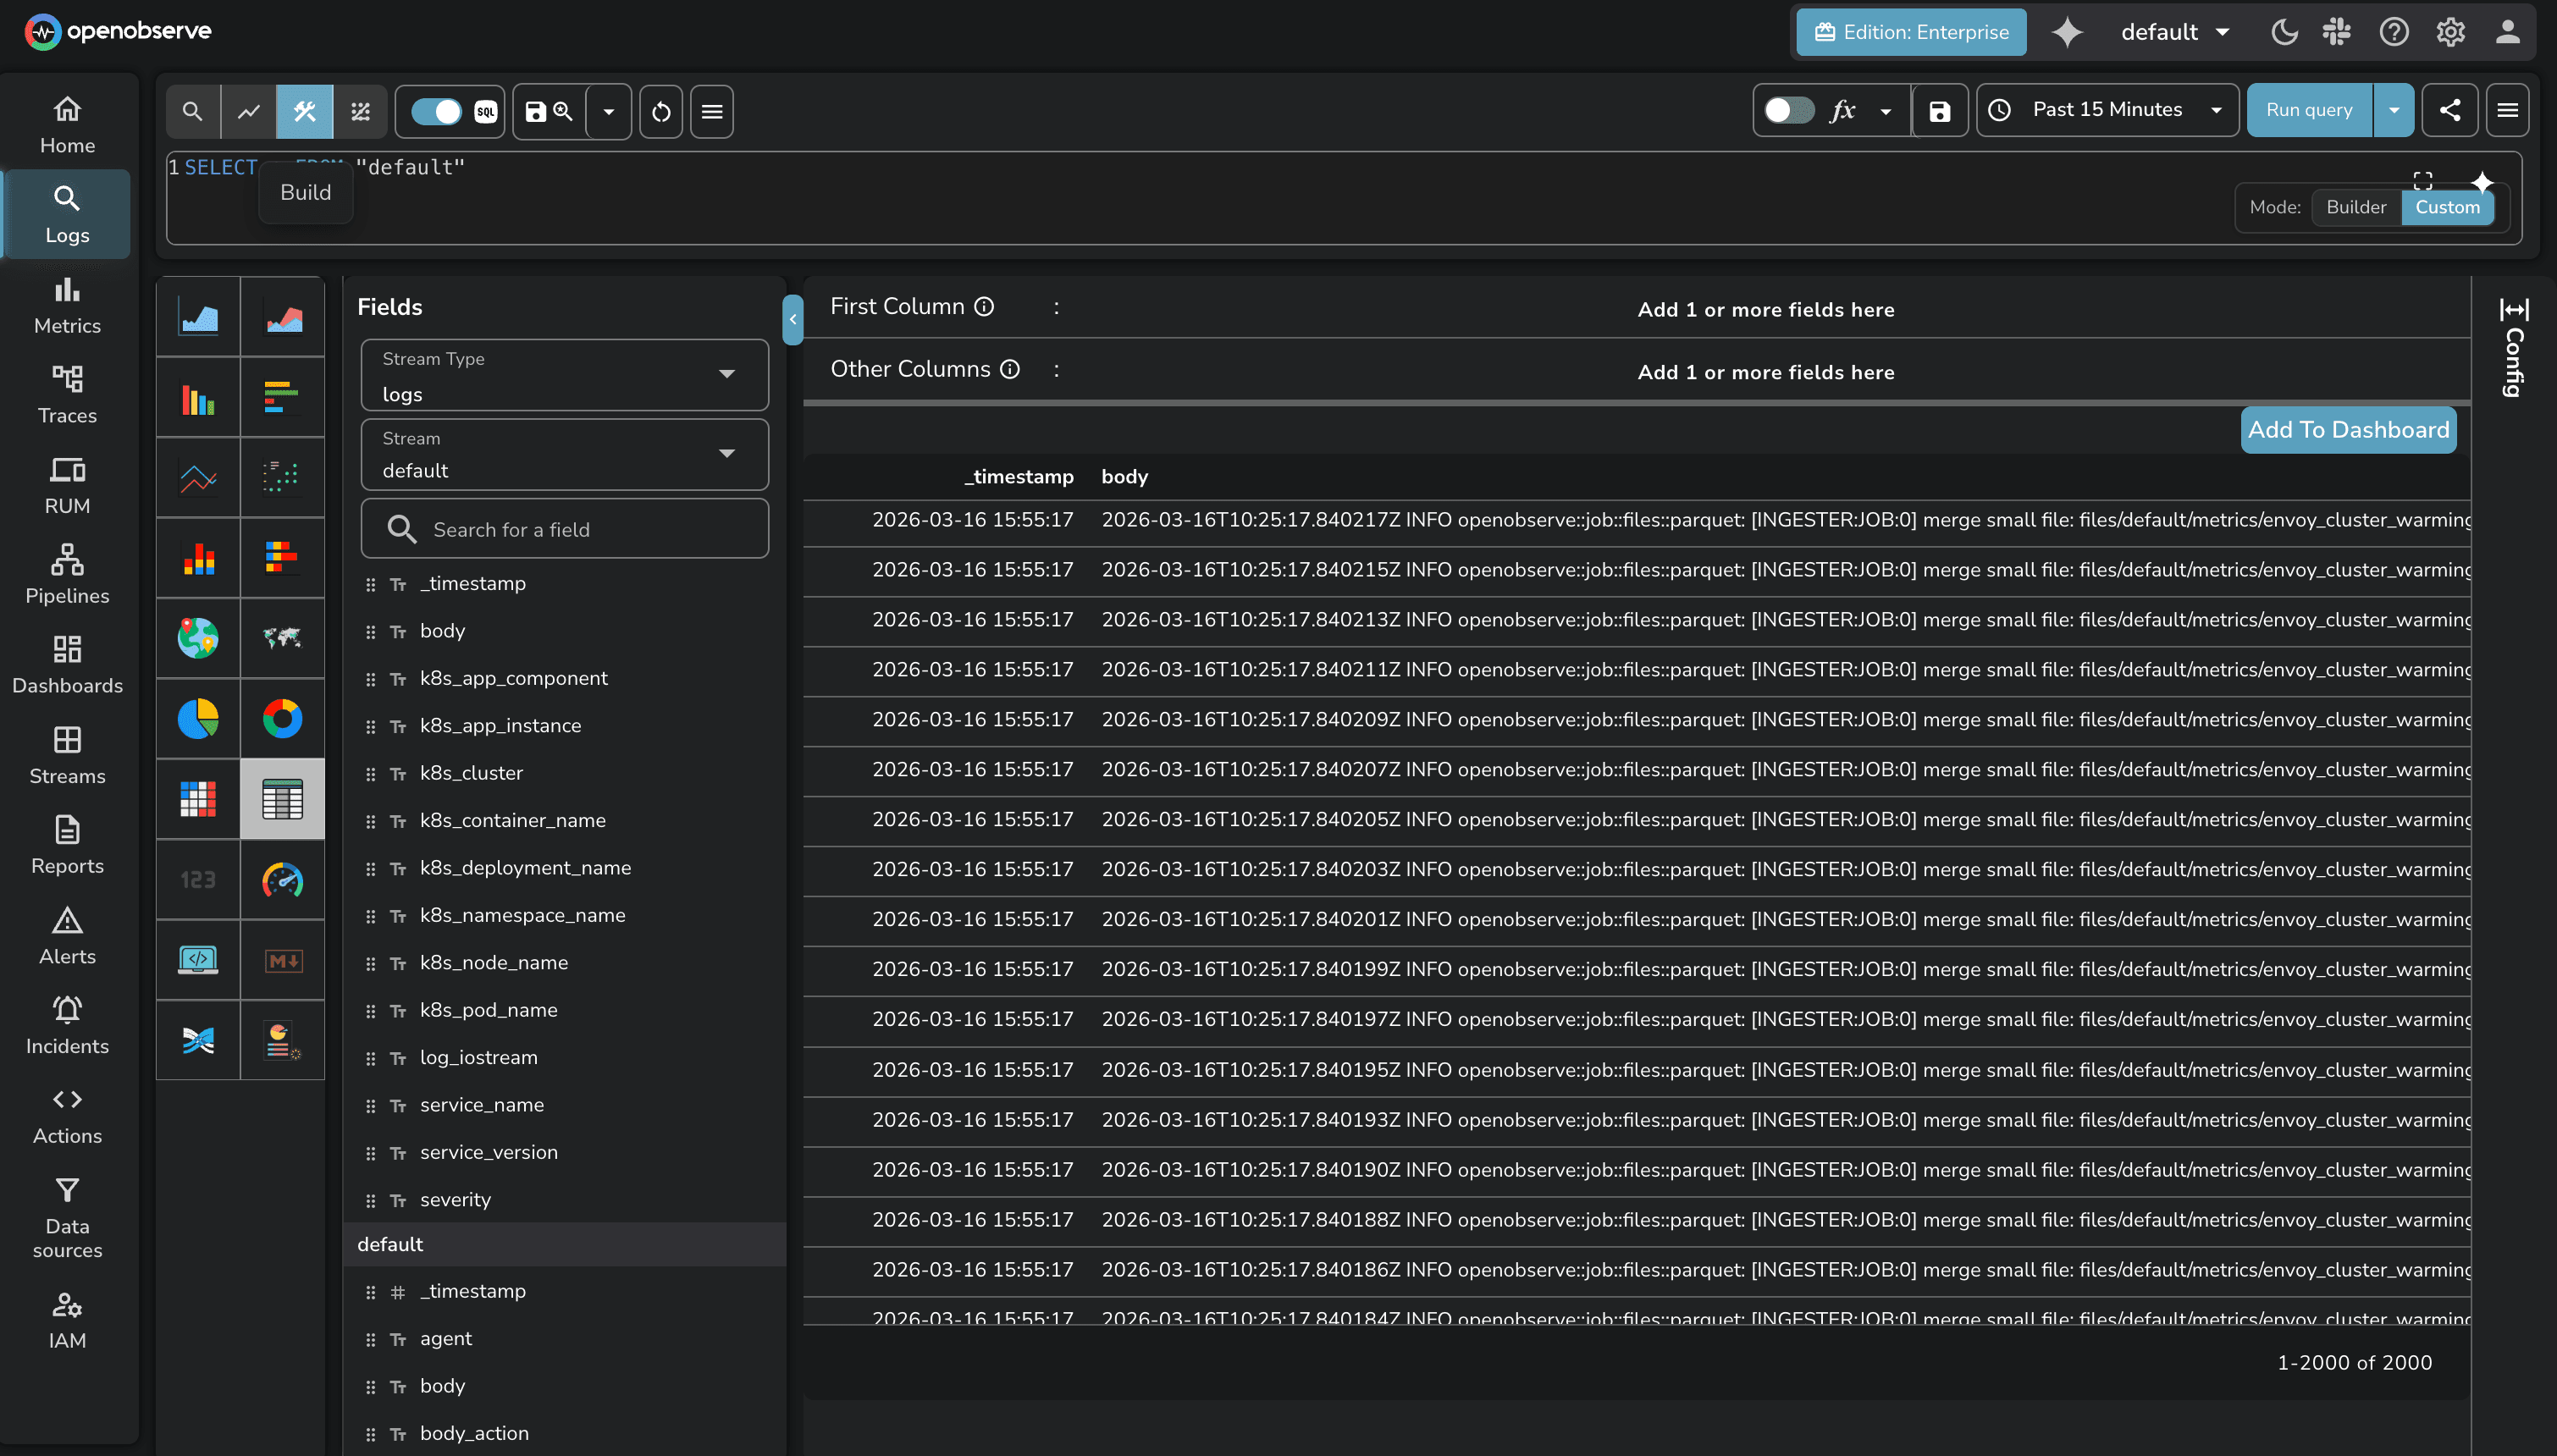
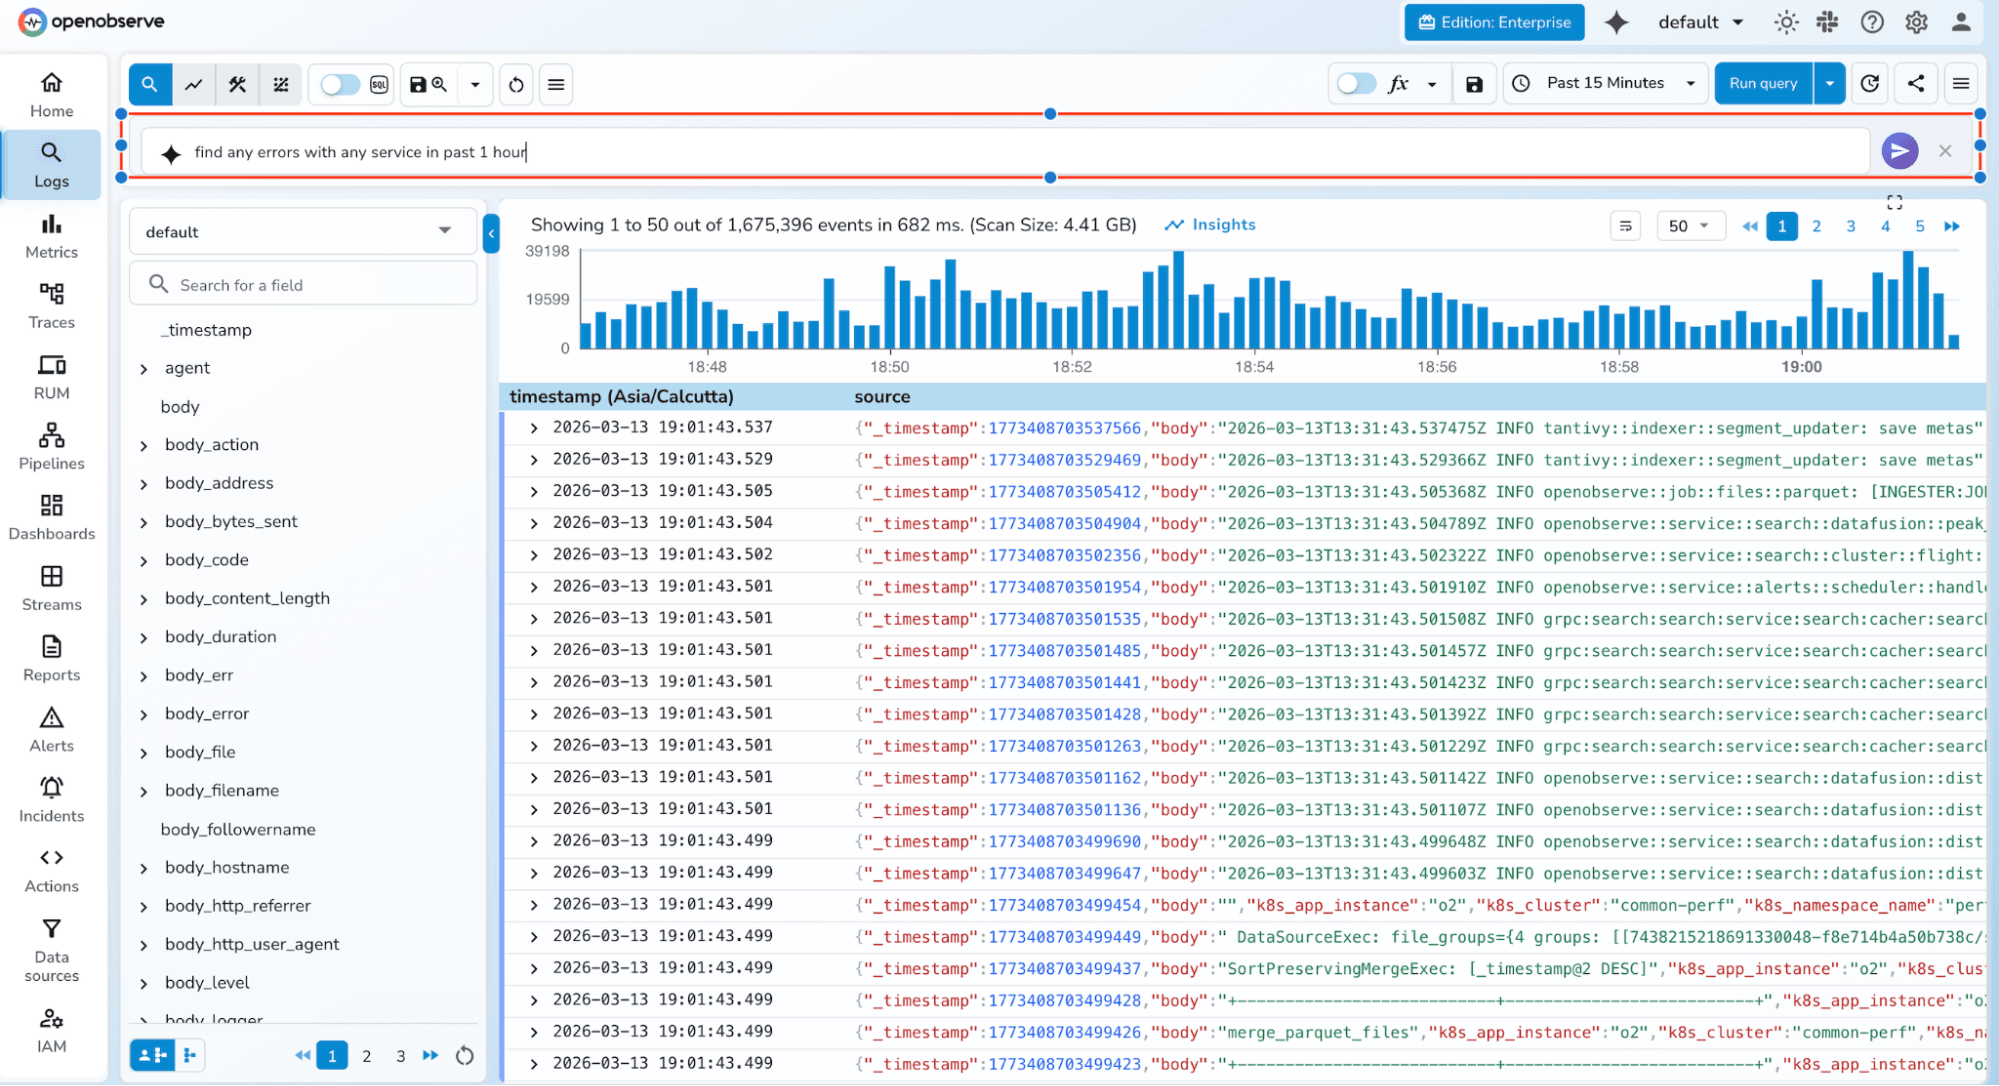
A visual SQL query builder is now available on the Logs page. It provides a point-and-click interface for constructing queries — filters, aggregations, group-by — without writing SQL by hand. Useful for users who are less familiar with SQL syntax or want to build queries faster.
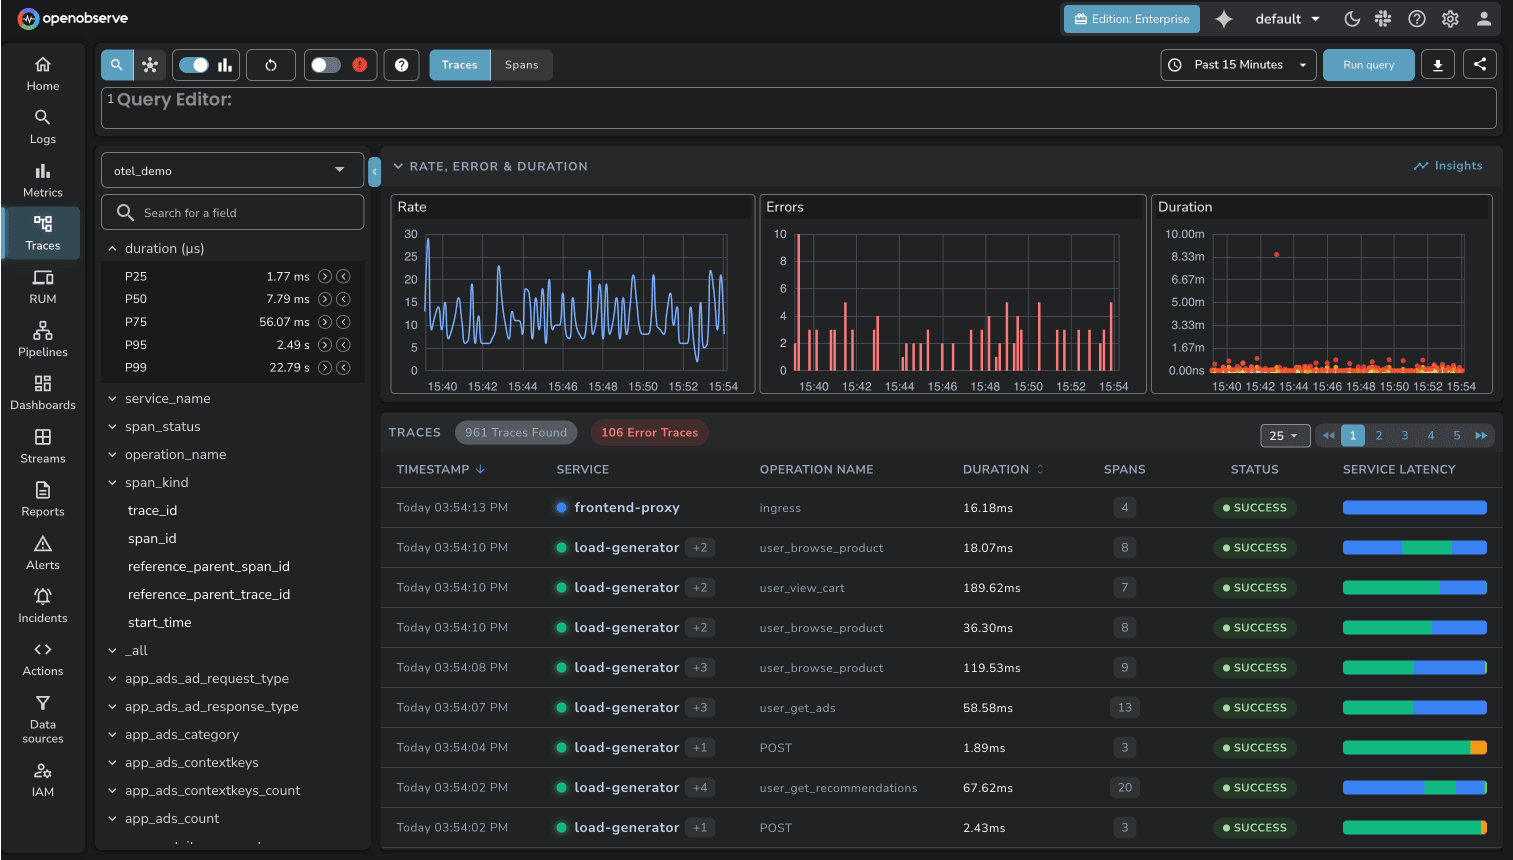
Sort by Duration The traces list now supports sorting by duration, making it straightforward to surface the slowest traces in a given time window.
Traces UI Improvements The traces list interface has been updated with improved readability — cleaner layout, better spacing, and more scannable span information.
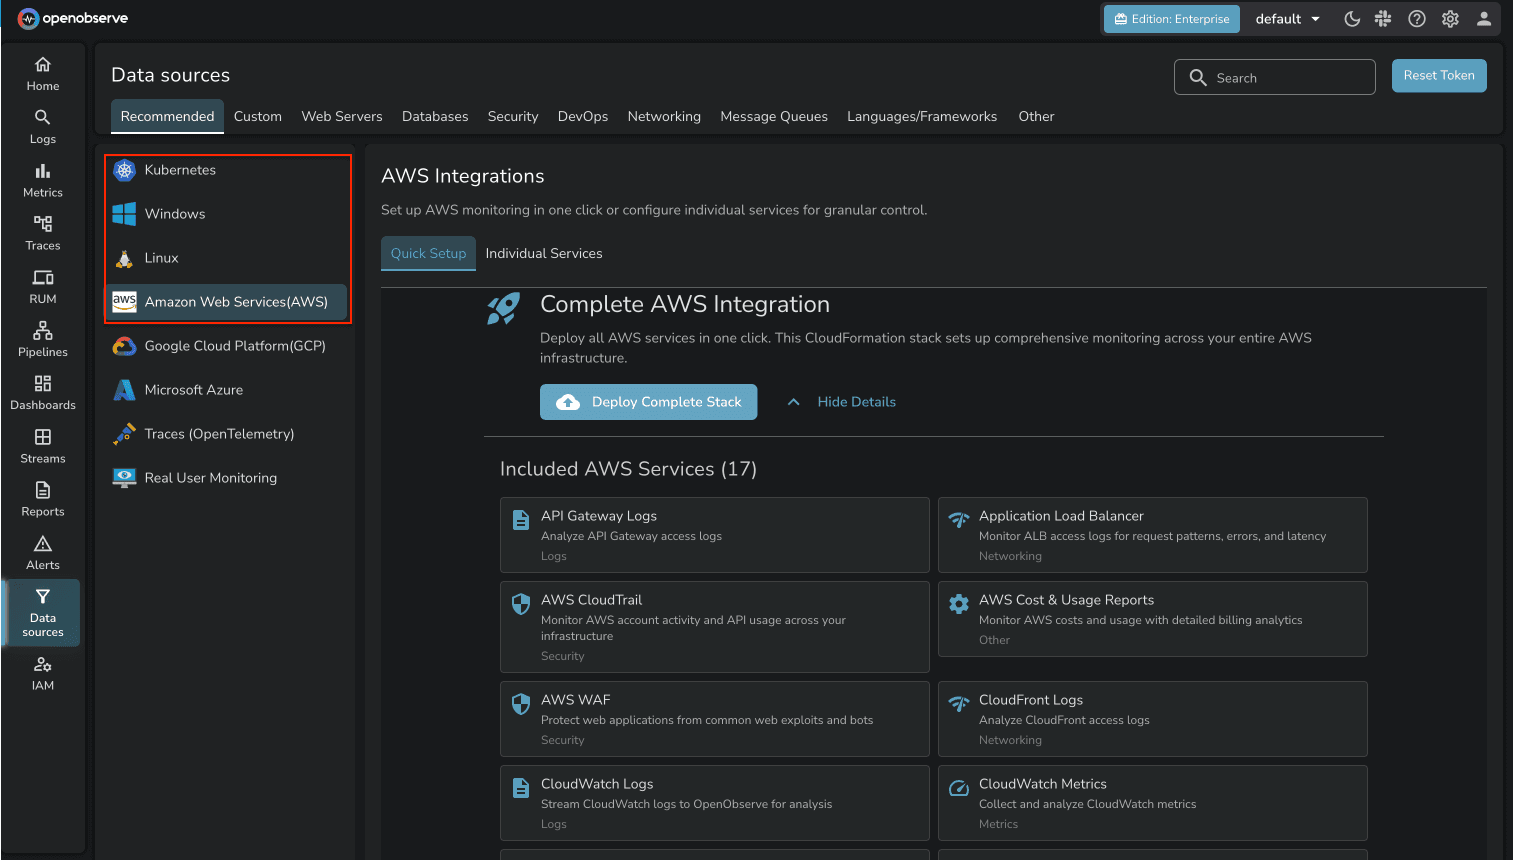
A new onboarding flow simplifies getting data into OpenObserve for the first time. Rather than navigating through documentation and configuration steps, users can complete initial setup through a guided one-click process.
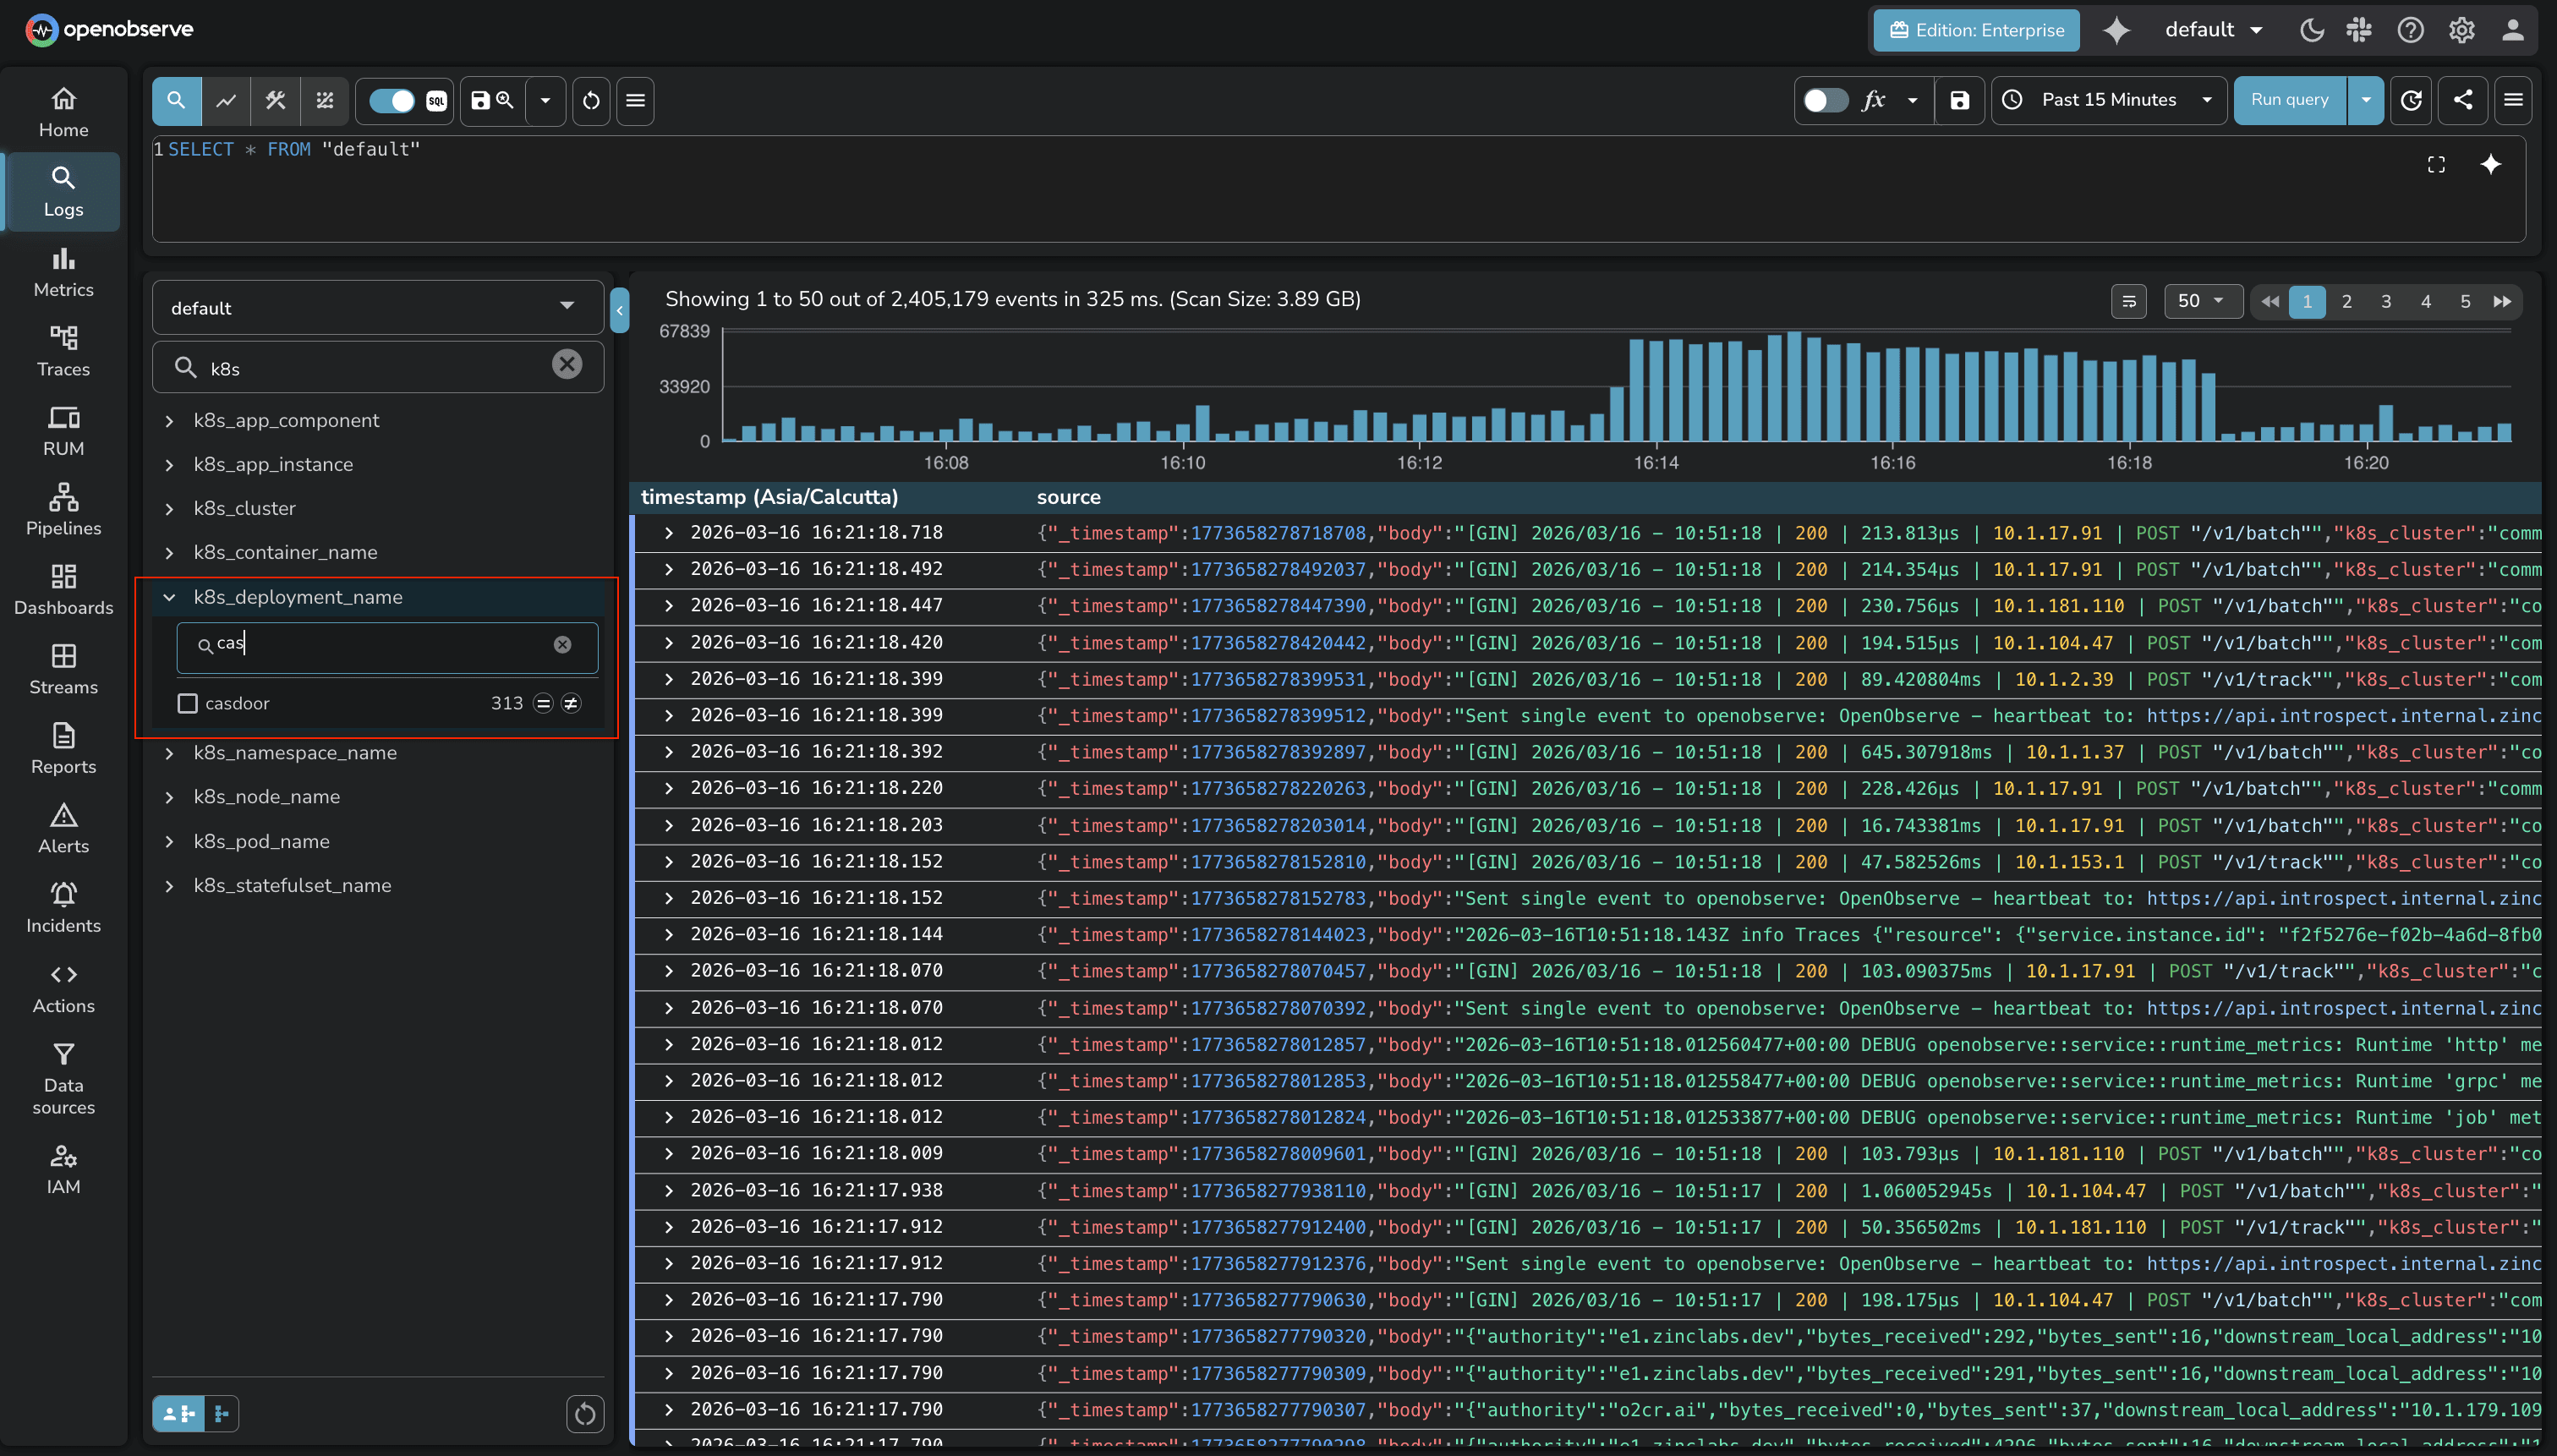
Field value search in stream exploration now supports a natural language mode. Instead of typing exact field values, you can describe what you're looking for and the system will interpret the intent.
If you haven't started with OpenObserve yet, now is a good time. Signing up for O2 Cloud is the fastest way to get going — no infrastructure setup, and the AI Assistant and LLM Observability features are available immediately on your account.
New to OpenObserve? Register for our Getting Started Workshop for a quick walkthrough.
Try OpenObserve: Download for self-hosting or sign up for OpenObserve Cloud with a 14-day free trial.
Manas is a passionate Dev and Cloud Advocate with a strong focus on cloud-native technologies, including observability, cloud, kubernetes, and opensource. building bridges between tech and community.


